
Environmental effects of ozone depletion and its interactions with climate change: Progress report, 2016

United Nations Environment Programme, Environmental Effects Assessment Panel. Photochem Photobiol Sci. .

Abstract

The Parties to the Montreal Protocol are informed by three Panels of experts. One of these is the Environmental Effects Assessment Panel (EEAP), which deals with two focal issues. The first focus is the effects of UV radiation on human health, animals, plants, biogeochemistry, air quality, and materials. The second focus is on interactions between UV radiation and global climate change and how these may affect humans and the environment. When considering the effects of climate change, it has become clear that processes resulting in changes in stratospheric ozone are more complex than previously believed. As a result of this, human health and environmental issues will be longer-lasting and more regionally variable. Like the other Panels, the EEAP produces a detailed report every four years; the most recent was published as a series of seven papers in 2015 (Photochem. Photobiol. Sci., 2015, 14, 1-184). In the years in between, the EEAP produces less detailed and shorter Progress Reports of the relevant scientific findings. The most recent of these was for 2015 (Photochem. Photobiol. Sci., 2016, 15, 141-147). The present Progress Report for 2016 assesses some of the highlights and new insights with regard to the interactive nature of the direct and indirect effects of UV radiation, atmospheric processes, and climate change. The more detailed Quadrennial Assessment will be made available in 2018.


Figures

Fig. 1
Fig. 1
Daily maximum UV Index measured at the South Pole in 2015 (red line) compared with the average (white line) and the lowest and highest values (grey shading) of observations performed between 1990 and 2014. Measurements between the second half of October 2015 to mid-December 2015 were close to the upper limit of historical observations. These large values can be attributed to the deep ozone ‘hole’ of 2015, which was well centered over the South Pole. The figure is adapted from r ef. and updated with data from November and December 2015.
Fig. 2
Fig. 2
A schematic diagram of the superficial layers of human skin. Epidermal cells originate in the deeper layers and move toward the surface as they age, with new cells constantly being produced below them. The horny layer consists of dead keratinocytes that are shed and replaced from below.
Fig. 3
Fig. 3
The figure shows the complete protection afforded by a watch strap, incomplete protection on the arm from a combination of clothing and sunscreen, sunburn where a patch of skin was exposed by movement of clothing and not covered with sunscreen, tanning on the unprotected skin of the hand.
Fig. 4
Fig. 4
Distribution map of the proportion of population who have A), vitamin D deficiency (<50 nmol L−1) and B), severe vitamin D deficiency (<30 nmol L−1), with restriction to population-based samples and a vitamin D assay that is standardised to the Vitamin D Standardisation Program.
Fig. 5
Fig. 5
The location of UV sunscreens in plant leaves and the diurnal changes in UV sunscreen protection. A. shows a cross-section of a leaf of a typical broad-leaved plant illustrating the arrangement of major cells and tissues and the location of UV sunscreens (flavonoid pigments) in epidermal tissue. B. shows diurnal changes in solar UV radiation reaching the ground under a typical clear sky and the response of a plant species that adjusts its UV protection over the day (okra) and one that does not (corn).
Fig. 6
Fig. 6
Similar to ozone in the atmosphere, dissolved organic matter (DOM) in aquatic ecosystems selectively absorbs UV radiation. The selectivity of absorption by DOM is not as strong as that of ozone, but stronger than that by smoke from wildfires. Adapted from Williamson et al. 2016.
Fig. 7
Fig. 7
Increases in dissolved organic matter (DOM) and decreases in UV transparency (depth to which 1% of subsurface 320 nm UV penetrates) related to browning in Lake Giles, Pennsylvania, USA, in recent decades. Adapted from Williamson et al. 2015.
Fig. 8
Fig. 8
Water transparency to UV radiation and visible light decreases substantially following storm event periods with higher precipitation, but increases following periods of low precipitation during a similar time of year. Data are from Lake Giles, Pennsylvania, USA. Adapted from Williamson et al. 2016.
Fig. 9
Fig. 9
The incident UV: visible light ratio at Lake Tahoe decreased by almost half during the 2013 Rim Fire in California. These changes in incident UV: visible light can alter the vertical distribution of zooplankton in the lake (Urmy et al. 2016). Adapted from Williamson et al. 2016.
Fig. 10
Fig. 10
Spring 2012 ice break-up in the Arctic Ocean along the coast of Greenland. Trends of earlier ice break-up and shorter periods of ice cover result in earlier exposure to UV radiation and longer growing seasons for these aquatic ecosystems. Photo credit: Samuel Hylander.
fig. 11
fig. 11
Interactive effects of solar UV radiation and climate change on processes and flows within and between terrestrial and aquatic ecosystems. The processes or flows indicated by arrows are discussed in sections 5.2–5.5 and 5.7. Key to symbols: black arrows indicate linkages between environmental factors: + shows an increase in a process or flow, – a decrease in a process or flow. Dashed arrows indicate direct effects of solar UV radiation on decomposer organisms. Grey arrows indicate the flow of carbon within ecosystems. Blue arrows indicate the flow of carbon from terrestrial to aquatic ecosystems. Green arrows refer to the process of “priming” (see sections 5.2, 5.3, and 5.5). Red arrows indicate the production of carbon dioxide in terrestrial and aquatic ecosystems. POM and DOM stand for particulate and dissolved organic matter, respectively.
Fig. 12
Fig. 12
Schematic illustration of the evolution of ground-level ozone in urban air and its outflow, as a function of distance from emission sources. Dashed curve gives reference using current UV radiation, while the solid curve is for decreased UV radiation expected upon recovery of stratospheric ozone. The green hatched area shows the resultant de-crease in urban ozone, while the red hatched area shows the increase in regional (background) ozone.

References

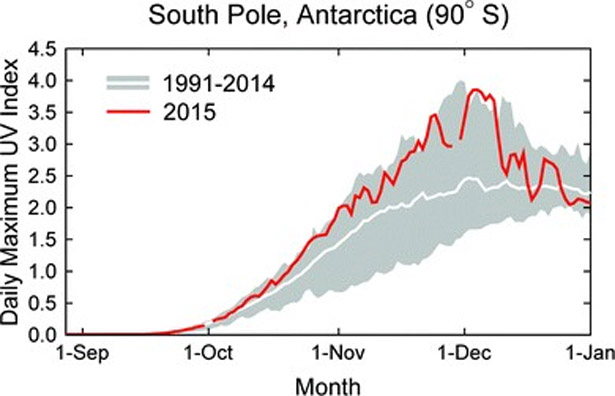
    1. Solomon S, Ivy DJ, Kinnison D, Mills MJ, Neely RR and Schmidt A, Emergence of healing in the Antarctic ozone layer, Science, 2016, 353, 269–274 WMO, Antarctic Ozone Bulletin; 5/2015, ed. - PubMed
    1. Braathen G, World Meteorological Organisation, http://www.wmo.int/pages/prog/arep/WMOAntarcticOzoneBulletins2015.html, 2015
    1. Butler A, Daniel JS, Portmann RW, Ravishankara A, Young PJ, Fahey DW and Rosenlof KH, Diverse policy implications for future ozone and surface UV in a changing climate, Environ. Res. Lett, 2016, 11(6), 064017
    1. IPCC, Climate Change 2013: The Physical Science Basis. Contribution of Working Group I to the Fifth Assessment Report of the Intergovernmental Panel on Climate Change Report No, Cambridge, United Kingdom and New York, NY, USA, 2013, p. 1355 http://www.ipcc.ch/.
    1. Bais AF, McKenzie RL, Bernhard G, Aucamp PJ, Ilyas M, Madronich S and Tourpali K, Ozone depletion and climate change: impacts on UV radiation, Photochem. Photobiol. Sci, 2015, 14, 19–52. - PubMed