

Antioxidant Pre-Treatment Reduces the Toxic Effects of Oxalate on Renal Epithelial Cells in a Cell Culture Model of Urolithiasis
- PMID: 28125004
- PMCID: PMC5295359
- DOI: 10.3390/ijerph14010109
Antioxidant Pre-Treatment Reduces the Toxic Effects of Oxalate on Renal Epithelial Cells in a Cell Culture Model of Urolithiasis
Abstract
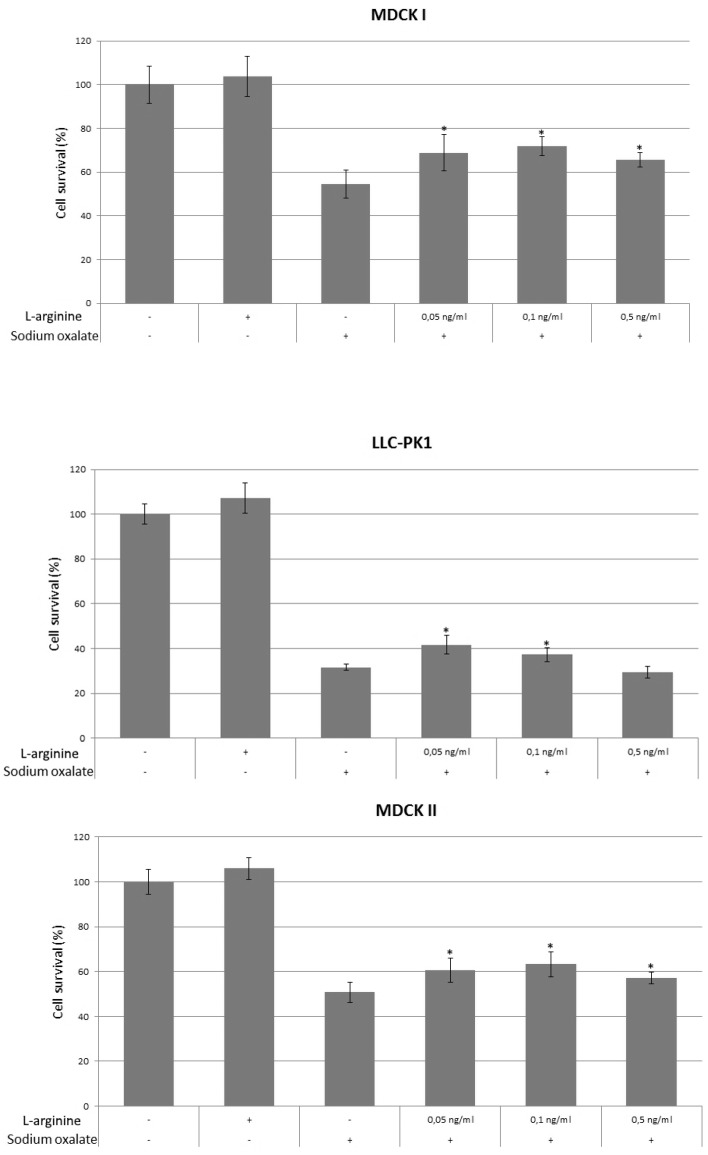
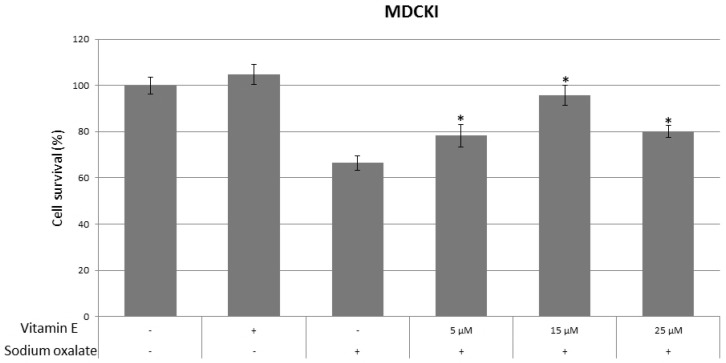
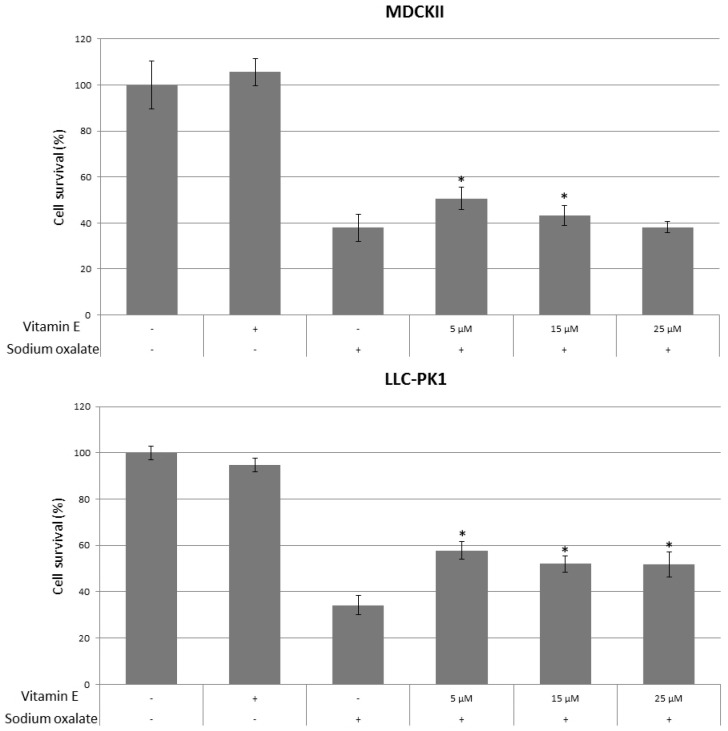
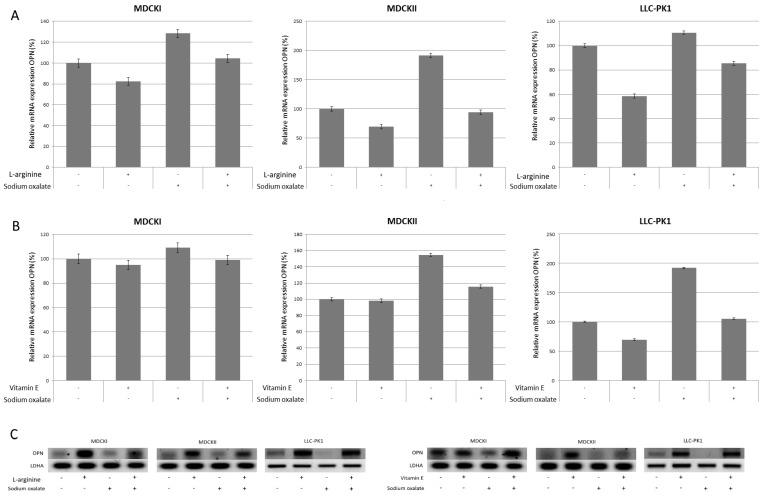
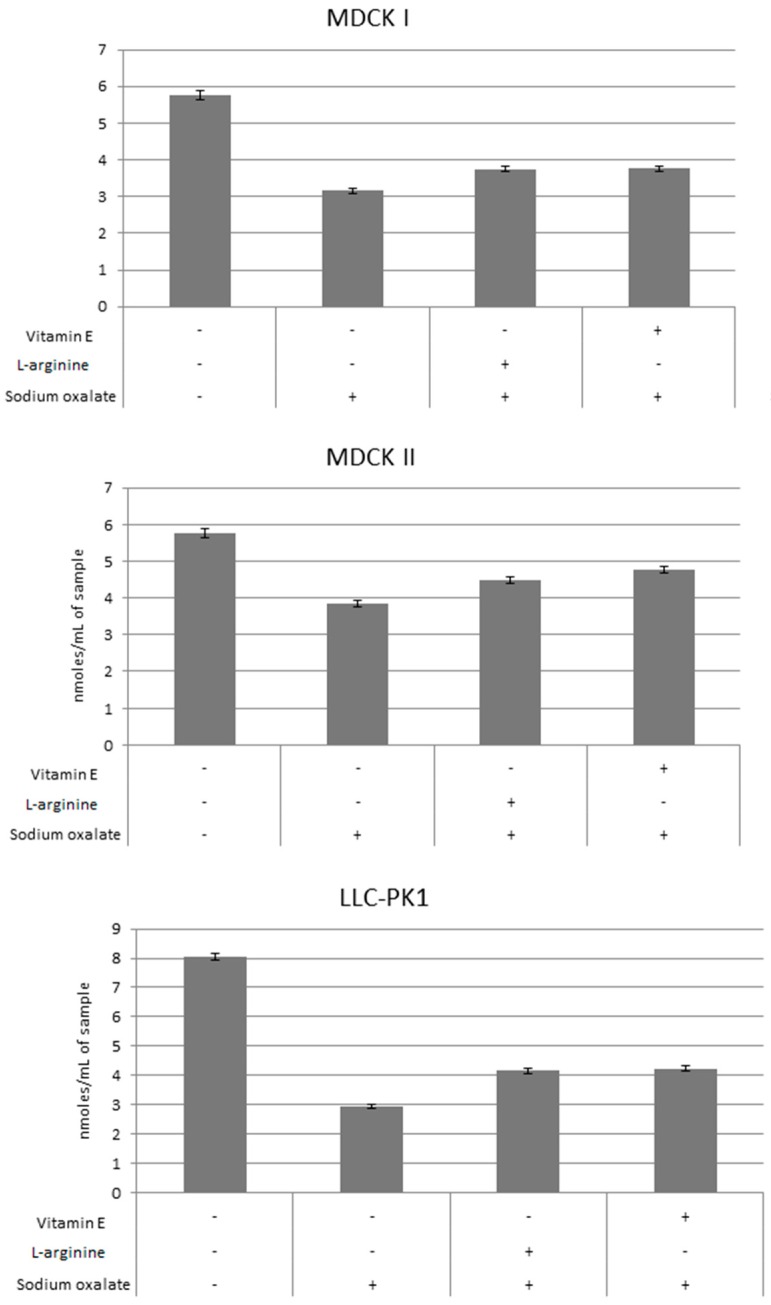
Urolithiasis is characterized by the formation and retention of solid crystals within the urinary tract. Kidney stones are mostly composed of calcium oxalate, which predominantly generates free radicals that are toxic to renal tubular cells. The aim of the study is to explore possible effects of antioxidant pre-treatment on inhibition of oxidative stress. Three cell lines were used as in vitro model of urolithiasis: MDCK I, MDCK II and LLC-PK1. Oxidative stress was induced by exposure of cells to sodium oxalate in concentration of 8 mM. In order to prevent oxidative stress, cells were pre-treated with three different concentrations of l-arginine and vitamin E. Oxidative stress was evaluated by determining the expression of superoxide dismutase (SOD), osteopontin (OPN), and by the concentration of glutathione (GSH). In all three cell lines, pre-treatment of antioxidants increased cell survival. Positive correlation of SOD and OPN expression as well as GSH concentration was observed in all groups of cells. Our results indicate that an antioxidant pre-treatment with l-arginine and vitamin E is able to hamper oxalate-induced oxidative stress in kidney epithelial cells and as such could play a role in prevention of urolithiasis.
Keywords: ">l-arginine; LLC-PK1 cells; Madin-Darby canine kidney cells; urolithiasis; vitamin E.
Conflict of interest statement
The authors declare no conflict of interest.
Figures
Similar articles
-
Oxalate at physiological urine concentrations induces oxidative injury in renal epithelial cells: effect of α-tocopherol and ascorbic acid.BJU Int. 2014 Jul;114(1):140-50. doi: 10.1111/bju.12642. BJU Int. 2014. PMID: 24460843
-
Cells of proximal and distal tubular origin respond differently to challenges of oxalate and calcium oxalate crystals.J Am Soc Nephrol. 1999 Nov;10 Suppl 14:S452-6. J Am Soc Nephrol. 1999. PMID: 10541282
-
Free radical scavengers, catalase and superoxide dismutase provide protection from oxalate-associated injury to LLC-PK1 and MDCK cells.J Urol. 2000 Jul;164(1):224-9. J Urol. 2000. PMID: 10840464
-
Nephrolithiasis: a consequence of renal epithelial cell exposure to oxalate and calcium oxalate crystals.Mol Urol. 2000 Winter;4(4):305-12. Mol Urol. 2000. PMID: 11156696 Review.
-
Pathophysiology-based treatment of urolithiasis.Int J Urol. 2017 Jan;24(1):32-38. doi: 10.1111/iju.13187. Epub 2016 Aug 18. Int J Urol. 2017. PMID: 27539983 Review.
Cited by
-
Mechanism and influencing factors of crystal-cell interaction in the formation of calcium oxalate stones.Zhong Nan Da Xue Xue Bao Yi Xue Ban. 2022 May 28;47(5):555-561. doi: 10.11817/j.issn.1672-7347.2022.210319. Zhong Nan Da Xue Xue Bao Yi Xue Ban. 2022. PMID: 35753725 Free PMC article. Chinese, English.
-
Lactiplantibacillus plantarum Reduced Renal Calcium Oxalate Stones by Regulating Arginine Metabolism in Gut Microbiota.Front Microbiol. 2021 Sep 24;12:743097. doi: 10.3389/fmicb.2021.743097. eCollection 2021. Front Microbiol. 2021. PMID: 34630369 Free PMC article.
-
Pretreatment of Garlic Oil Extracts Hampers Epithelial Damage in Cell Culture Model of Peptic Ulcer Disease.Medicina (Kaunas). 2022 Jan 7;58(1):91. doi: 10.3390/medicina58010091. Medicina (Kaunas). 2022. PMID: 35056399 Free PMC article.
-
Chronomics of Circulating Plasma Lipid Peroxides and Antioxidant Enzymes in Renal Stone Formers.Indian J Clin Biochem. 2019 Apr;34(2):195-200. doi: 10.1007/s12291-017-0726-6. Epub 2017 Dec 21. Indian J Clin Biochem. 2019. PMID: 31092993 Free PMC article.
-
Renal Benefits of SGLT 2 Inhibitors and GLP-1 Receptor Agonists: Evidence Supporting a Paradigm Shift in the Medical Management of Type 2 Diabetes.Int J Mol Sci. 2019 Nov 20;20(23):5831. doi: 10.3390/ijms20235831. Int J Mol Sci. 2019. PMID: 31757028 Free PMC article. Review.
References
MeSH terms
Substances
LinkOut - more resources
Full Text Sources
Other Literature Sources
Medical
Research Materials
