. 2017 Jan 26;12(1):e0170608.
doi: 10.1371/journal.pone.0170608. eCollection 2017.

Reversible Nuclear-Lipid-Droplet Morphology Induced by Oleic Acid: A Link to Cellular-Lipid Metabolism

Affiliations

Reversible Nuclear-Lipid-Droplet Morphology Induced by Oleic Acid: A Link to Cellular-Lipid Metabolism

Lucía C Lagrutta et al. PLoS One. .

Abstract

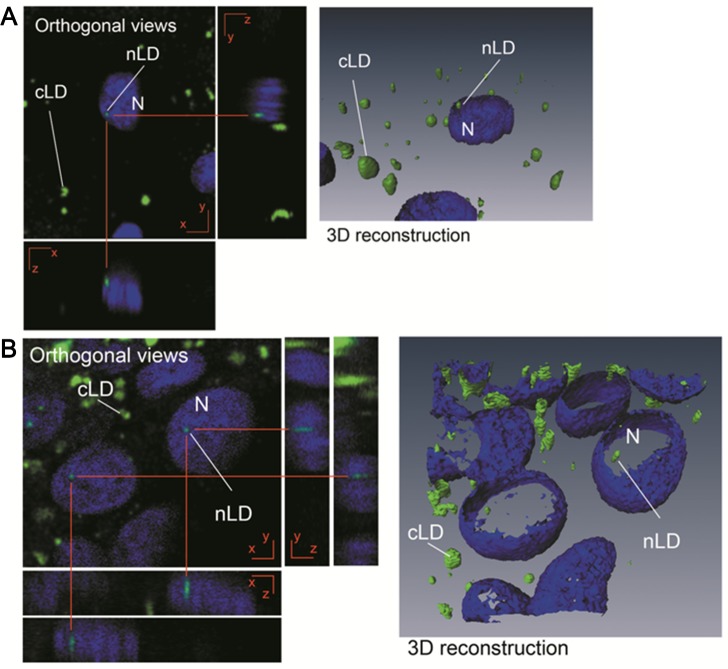
Neutral lipids-involved in many cellular processes-are stored as lipid droplets (LD), those mainly cytosolic (cLD) along with a small nuclear population (nLD). nLD could be involved in nuclear-lipid homeostasis serving as an endonuclear buffering system that would provide or incorporate lipids and proteins involved in signalling pathways as transcription factors and as enzymes of lipid metabolism and nuclear processes. Our aim was to determine if nLD constituted a dynamic domain. Oleic-acid (OA) added to rat hepatocytes or HepG2 cells in culture produced cellular-phenotypic LD modifications: increases in TAG, CE, C, and PL content and in cLD and nLD numbers and sizes. LD increments were reversed on exclusion of OA and were prevented by inhibition of acyl-CoA synthetase (with Triacsin C) and thus lipid biosynthesis. Under all conditions, nLD corresponded to a small population (2-10%) of total cellular LD. The anabolism triggered by OA, involving morphologic and size changes within the cLD and nLD populations, was reversed by a net balance of catabolism, upon eliminating OA. These catabolic processes included lipolysis and the mobilization of hydrolyzed FA from the LD to cytosolic-oxidation sites. These results would imply that nLD are actively involved in nuclear processes that include lipids. In conclusion, nLD are a dynamic nuclear domain since they are modified by OA through a reversible mechanism in combination with cLD; this process involves acyl-CoA-synthetase activity; ongoing TAG, CE, and PL biosynthesis. Thus, liver nLD and cLD are both dynamic cellular organelles.


Conflict of interest statement

The authors have declared that no competing interests exist.

Figures

Fig 1
Fig 1. Experimental protocol for the different treatments used with rat primary hepatocytes and HepG2 cells.
Cells treated with the respective vehicle of OA or Triacsin C, ethanol+BSA or methanol, constituted the controls for the different experimental groups.
Fig 2
Fig 2. Analysis of primary rat hepatocytes and HepG2 cells by microscopy.
(A) Rat primary hepatocytes; (B) HepG2 cells, both cultured under control conditions. Nuclei and LD (nLD and cLD) were stained with DAPI (blue) and BODIPY 493/503 (green), respectively, and observed by confocal laser-scanning microscopy. Z-plane cross sections through the central position of a nucleus were obtained and the different planes reconstructed to give XZ and YZ orthogonal projections. Three-dimensional reconstructions were performed and the nLD visualized through isosurface rendering by BODIPY (green) and outline rendering by DAPI (blue). The photographs correspond to representative observations. N, nucleus.
Fig 3
Fig 3. Analysis of cLD and nLD populations from rat primary hepatocytes by fluorescence microscopy.
Nuclei (N) and lipid droplets (nLD and cLD) were stained with DAPI (blue) and BODIPY 493/503 (green), respectively. The red and yellow arrows indicate the cLD and nLD, respectively. Control, cells cultured under control conditions for 24 h; 400 OA, cells treated with 400 μM OA for 24 h; 400 OA + 5TC: cells treated with 400 μM OA plus 5 μM TC for 24 h;–OA (48) and–OA (72), cells treated with 400 μM OA for 24h and then incubated in the absence of OA for 48 or 72 h, respectively. The photographs correspond to representative observations.
Fig 4
Fig 4. Analysis of the cLD and nLD morphologic parameters of rat hepatocytes in primary culture.
The morphologic parameters of hepatocyte-LD populations (cLD and nLD) were measured in fluorescence-microscopy images (equivalent those of to Fig 3) through the use of Image-Pro Plus software as described in the Materials and Methods section. Experimental groups, Control: cells cultured in medium plus ethanol (solvent in which OA was dissolved), BSA (OA vehicle) and methanol (TC vehicle) for 24 h; OA 400: cells treated with 400 μM OA for 24 h; OA 400 + 1TC, 2.5TC, or 5TC: cells treated with 400 μM OA plus 1, 2.5, or 5 μM TC, respectively for 24 h;–OA (48) and–OA (72): cells treated with 400 μM OA for 24 h and then incubated in the absence of OA for 48 or 72 h, respectively. (A) LD sizes (diameters). The diameter values measured for cLD and nLD under each experimental condition are represented by box plots; where the minimum, median (indicated as a black line across the bar), and maximum values are displayed and the three quartiles of the data (Q2 = median value). The maximum diameter (dmax) corresponds to the maximum diameter measured in the cLD or nLD population. The statistical significance of differences in the data was analyzed by the Kruskal-Wallis test with post-hoc comparisons of the medians (the Nemenyi test). Each treatment was compared with the corresponding control condition: *p <0.05, **p <0.01, ***p <0.001. In the figure the LD diameter is plotted on the ordinate for each of the experimental groups indicated on the abscissa. Note the difference in the size scales on the left (cLD) and right (nLD) ordinates. (B) Size distribution of LD populations. The sizes of the cLD and nLD populations were evaluated by defining three categories according to the quartiles of the diameter data, Q1 (0.51 μm) and Q3 (0.77 μm) as follows: small, (beige bar area), ≤0.51; medium, (light-violet bar area), between 0.51 and 0.77 (>0.51 and ≤0.77); large, (dark-violet bar area), >0.77. To compare the LD size distribution, the data were analyzed by multiple significance tests with the Bonferroni correction (see S1 and S2 Tables). Each experimental treatment was compared with the corresponding control condition for the same LD-size category (small, medium, or large; *p<0.05, **p<0.01, ***p<0.001). In the figure, the relative abundance as a percent of each size class is plotted on the ordinate for each of the experimental groups indicated on the abscissa. (C) Total numbers and volumes of the LD populations. The total volume of each LD population (μm3) was calculated under the assumption that the LD were spheres by multiplying the volume of an ideal LD (i. e., one having the median diameter of the population) by the mean number present in the cytoplasm (cLD) and nucleus (nLD). The statistical significance of differences in the number and volume was analyzed by the Student's t test and the Kruskal-Wallis test with post-hoc comparisons of the medians (the Nemenyi test), respectively. Each treatment was compared with the corresponding control condition: *p <0.05, **p <0.01, ***p <0.001. In the figure, the number and volume (μm3) of LD are plotted on the ordinate for each of the experimental groups indicated on the abscissa.
Fig 5
Fig 5. Analysis of cLD and nLD populations of HepG2 cells by fluorescence microscopy.
Nuclei (N) and lipid droplets (nLD and cLD) were stained with DAPI (blue) and BODIPY 493/503 (green), respectively. The red and yellow arrows indicate the cLD and nLD, respectively. Control, cells cultured under control conditions for 24 h; 100 OA, 400 OA, cells treated with 400 μM OA for 24 h; 400 OA + 5TC: cells treated with 400 μM OA plus 5 μM TC for 24 h;–OA (48) and–OA (72), cells treated with 400 μM OA for 24 h and then incubated in the absence of OA for 48 or 72 h, respectively. The photographs correspond to representative observations.
Fig 6
Fig 6. Analysis of the cLD and nLD morphologic parameters of HepG2 cells.
HepG2-cell LD populations (cLD and nLD) were measured in fluorescence-microscopy images (equivalent to Fig 5) through the use of Image-Pro Plus software as described in Fig 4. To compare the LD size distribution, the data were analyzed by multiple significance tests with the Bonferroni correction (see S3 and S4 Tables). The experimental groups were the same as for the rat-liver hepatocytes except that this experiment also included a group of cultures treated with 100 μM OA and the incubations in the presence of 1 and 2.5 μM TC were excluded.
Fig 7
Fig 7. Analysis of HepG2 cells treated with OA by confocal laser-scanning microscopy.
(A) HepG2 cells cultured under control conditions; (B) treated for 24 h with 100 μM OA, (C) treated for 24 h with 400 μM OA. For microscopical analysis the nucleus (N) and nLD and cLD were stained with DAPI (blue) and BODIPY 493/503 (green), respectively. Z-plane cross sections through the central position of a nucleus were obtained and the different planes reconstructed to give XZ and YZ orthogonal projections. Three-dimensional reconstructions were performed and the LD visualized through isosurface rendering by BODIPY and outline rendering by DAPI. The photographs correspond to representative observations.
Fig 8
Fig 8. Lipid composition of HepG2 cells.
The results for each experimental condition—calculated as a percent of the respective control values and plotted on the ordinate for each lipid class indicated on the abscissa—are presented as the means ± SD of 3 independent experiments expressed as nmol per 106 cells of each lipid class as calculated on the basis of the following molecular weights: PL, 796; TG, 864; C, 387; and CE, 641. *p <0.05, **p <0.01, ***p <0.001. Experimental groups: 400 OA, HepG2 cells cultured in the presence of 400 μM OA for 24 h;–OA (72), 400 OA cells cultured for 72 h after OA removal. Since the lipid spectrum of this permanent cell line may change during each culture passage, we needed a nonstimulated control for a given experimental condition at each time point. Therefore, the control for Group 400 OA was unstimulated cells after 72 h in culture and for the Group–OA (72) parallel cultures without treatment for 144 h (cf. Fig 1. Accordingly, the lipid composition of the control for Group 400 OA was PL = 6.8 ± 0.1, TAG = 5.0 ± 1.4, C = 3.8 ± 1.0, CE = 0.8 ± 0.3and for Group–OA (72) was PL = 11.6 ± 2.1, TAG = 3.4 ± 1.9, C = 12.7 ± 2.9, CE = 2.6 ± 0.4.
Fig 9
Fig 9. HepG2-cell viability after treatment with OA and the lipid-synthesis inhibitor Triacsin C.
Cell viability was determined by the MTT assay. The data are expressed as the mean ± SD of 3 independent experiments (n = 3); *p <0.05, **p <0.01, ***p <0.001. Experimental groups: Control, cells incubated under control culture conditions; 400 OA, cells treated with 400 μM OA for 24 h; 400 OA + 1 TC, cells treated with 400 μM OA plus 1 μM TC for 24 h; 400 OA + 2.5 TC, cells treated with 400 μM OA plus 2.5 μM TC for 24 h; 400 OA + 5 TC, cells treated with 400 μM OA plus 5 μM TC for 24 h. In the figure, the percent viability is plotted on the ordinate for the experimental groups indicated on the abscissa.
Fig 10
Fig 10. Cell viability of rat primary hepatocytes treated with OA and Triacsin C inhibitor.
Cell viability was determined by the MTT assay. The data are expressed as the mean ± SD of 3 independent experiments (n = 3); *p <0.05, **p <0.01, ***p <0.001. Experimental groups: Control: cells incubated under control culture conditions; 400 OA, cells treated with 400 μM OA for 24 h; 400 OA + 1 TC, cells treated with 400 μM OA plus 1 μM TC for 24 h; 400 OA + 2.5 TC, cells treated with 400 μM OA plus 2.5 μM TC for 24 h; 400 OA + 5 TC, cells treated with 400 μM OA plus 5 μM TC for 24 h. In the figure, the percent viability is plotted on the ordinate for the experimental groups indicated on the abscissa.

References

    1. Mao YS, Zhang B, Spector DL. Biogenesis and function of nuclear bodies. Trends in Genetics. 2011. pp. 295–306. 10.1016/j.tig.2011.05.006 - DOI - PMC - PubMed
    1. Layerenza JP, González P, García De Bravo MM, Polo MP, Sisti MS, Ves-Losada A. Nuclear lipid droplets: A novel nuclear domain. Biochim Biophys Acta—2013;1831: 327–340. 10.1016/j.bbalip.2012.10.005 - DOI - PubMed
    1. Ohsaki Y, Kawai T, Yoshikawa Y, Cheng J, Jokitalo E, Fujimoto T. PML isoform II plays a critical role in nuclear lipid droplet formation. J Cell Biol.; 2016;212: 29–38. 10.1083/jcb.201507122 - DOI - PMC - PubMed
    1. Farese R. V, & Walther T. C. (2016). Lipid droplets go nuclear. The Journal of Cell Biology, 212(1), 7–8. JOUR. Retrieved from http://jcb.rupress.org/content/212/1/7.abstract 10.1083/jcb.201512056 - DOI - PMC - PubMed
    1. Hillman N, Hillman R. Ultrastructural studies of tw32/tw32 mouse embryos. Development. 1975;33: 685–695. Available: http://dev.biologists.org/content/33/3/685.abstract - PubMed