. 2017 Jan 26;12(1):e0170825.
doi: 10.1371/journal.pone.0170825. eCollection 2017.

Prophylactic versus Therapeutic Fingolimod: Restoration of Presynaptic Defects in Mice Suffering from Experimental Autoimmune Encephalomyelitis

Affiliations

Prophylactic versus Therapeutic Fingolimod: Restoration of Presynaptic Defects in Mice Suffering from Experimental Autoimmune Encephalomyelitis

Tommaso Bonfiglio et al. PLoS One. .

Erratum in

Abstract

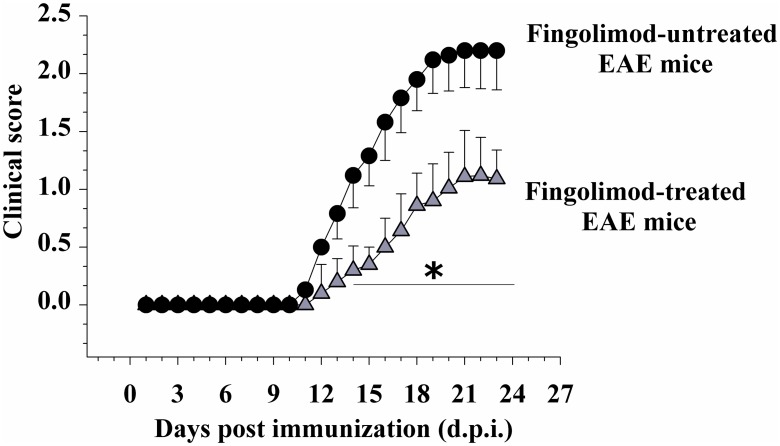
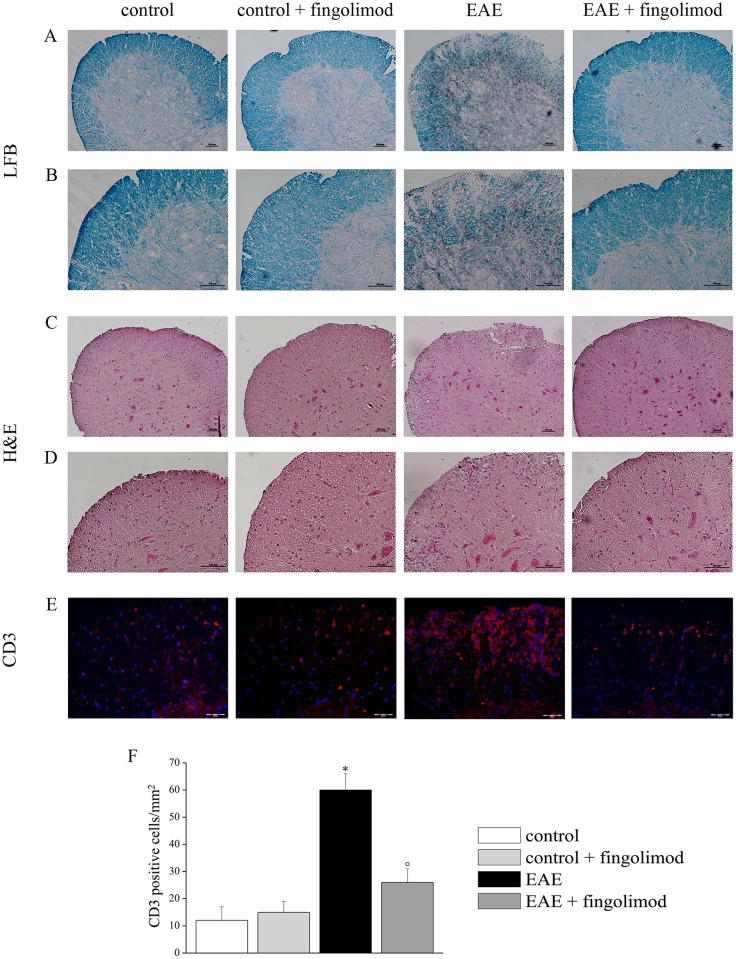
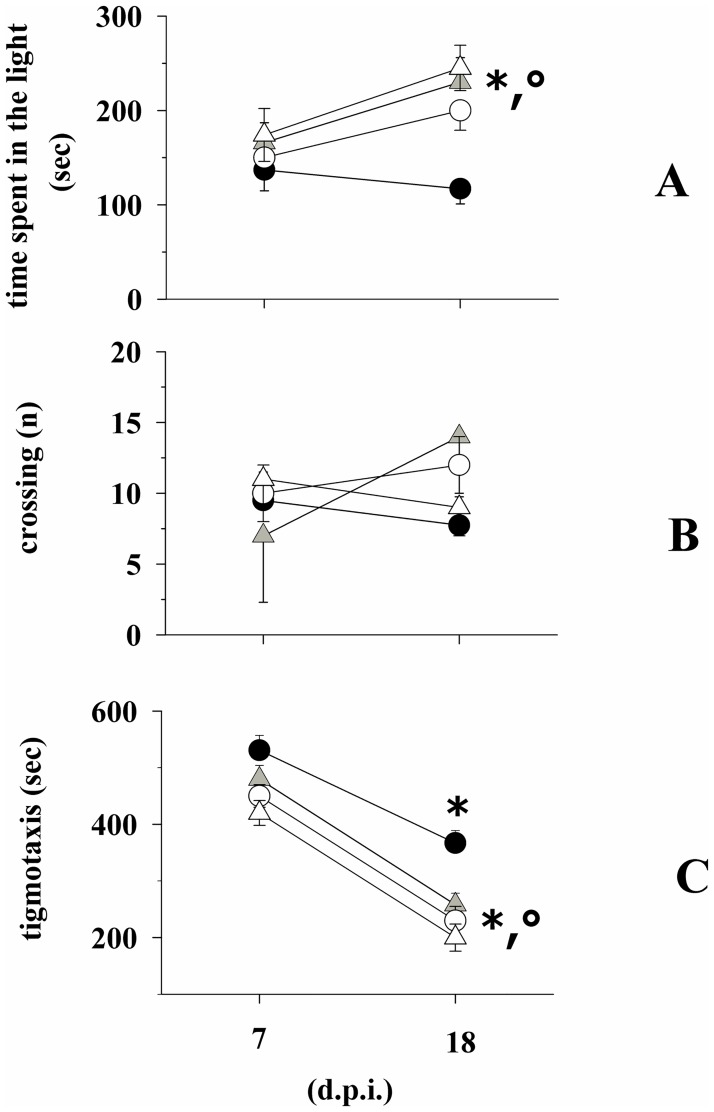
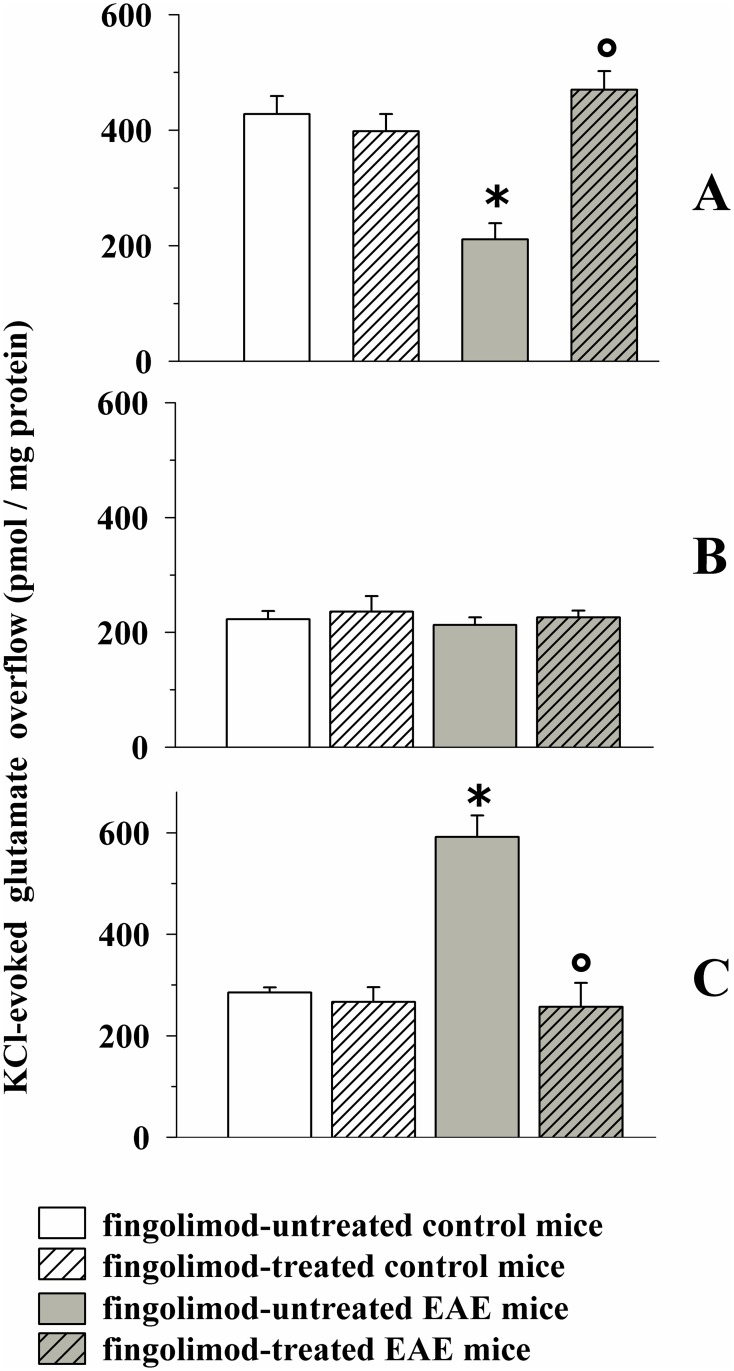
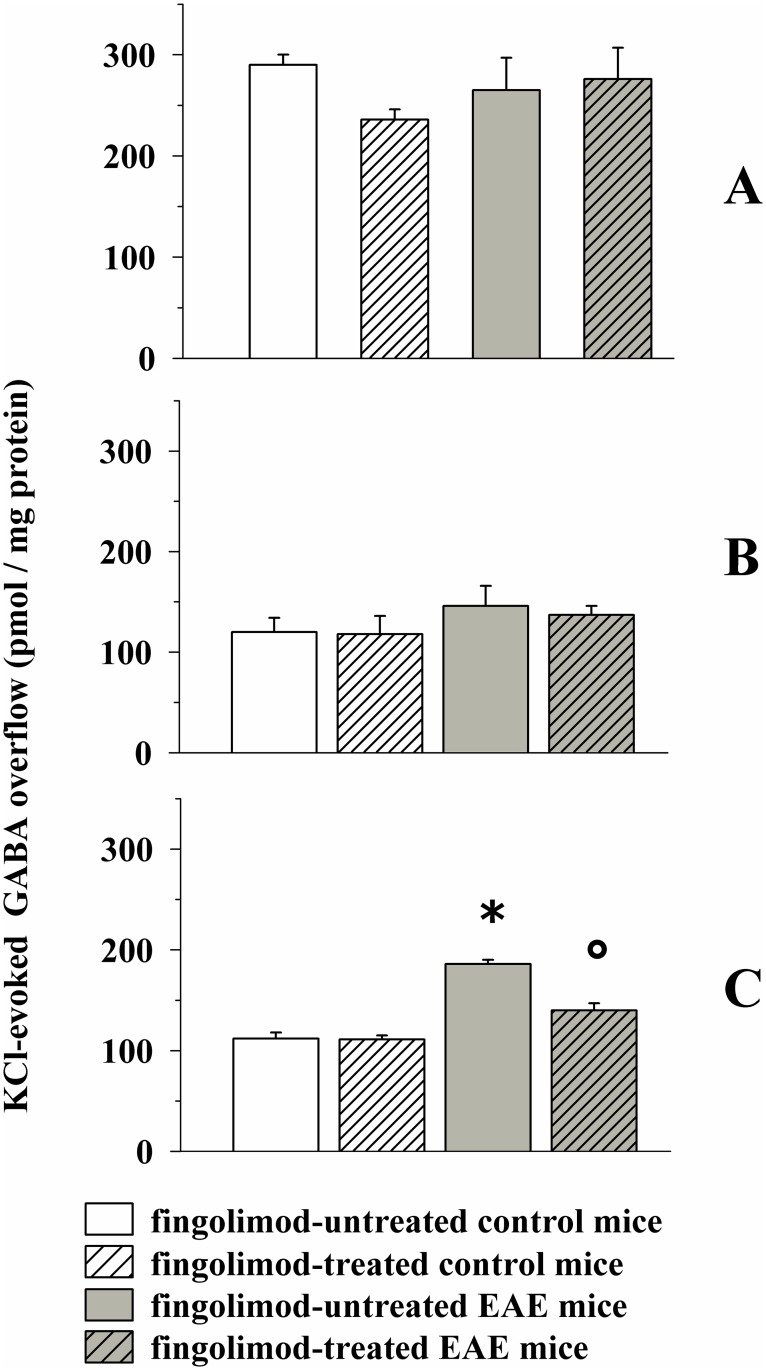
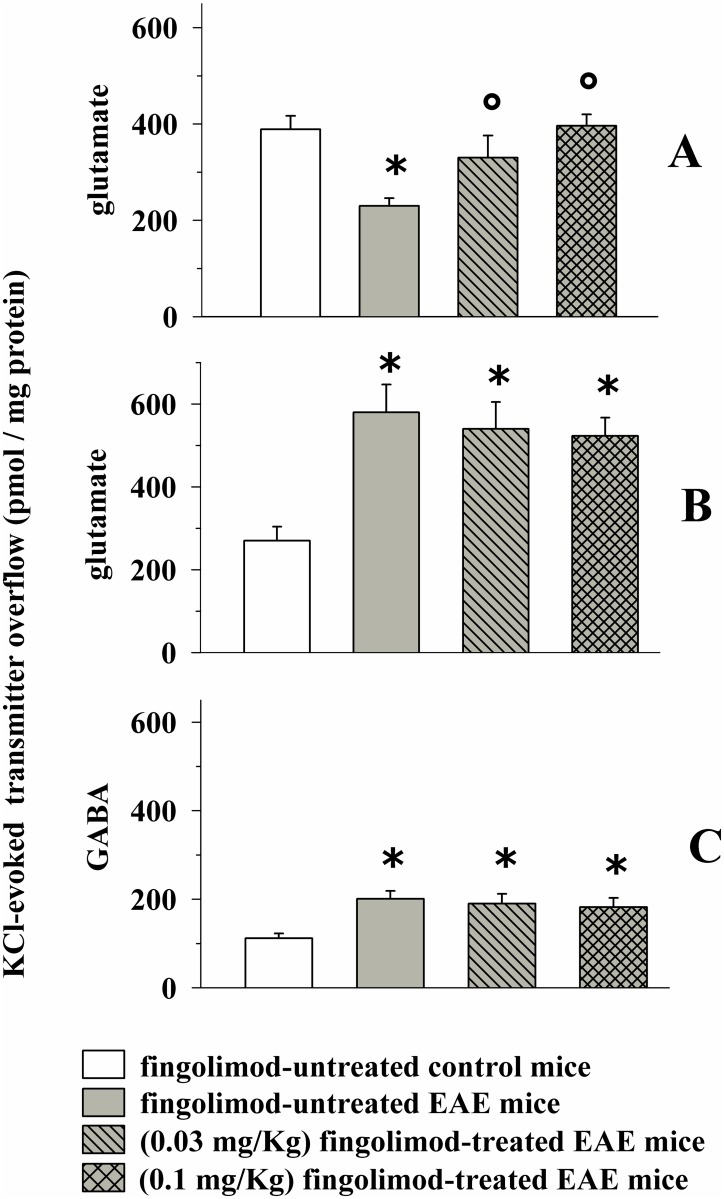
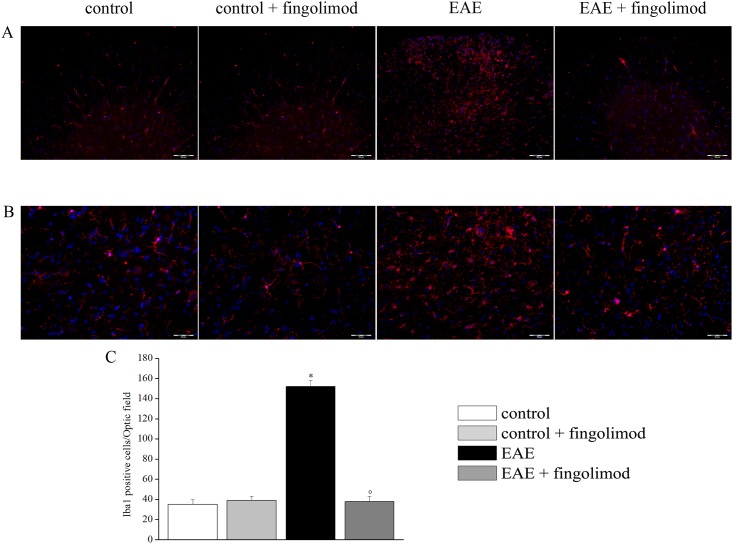
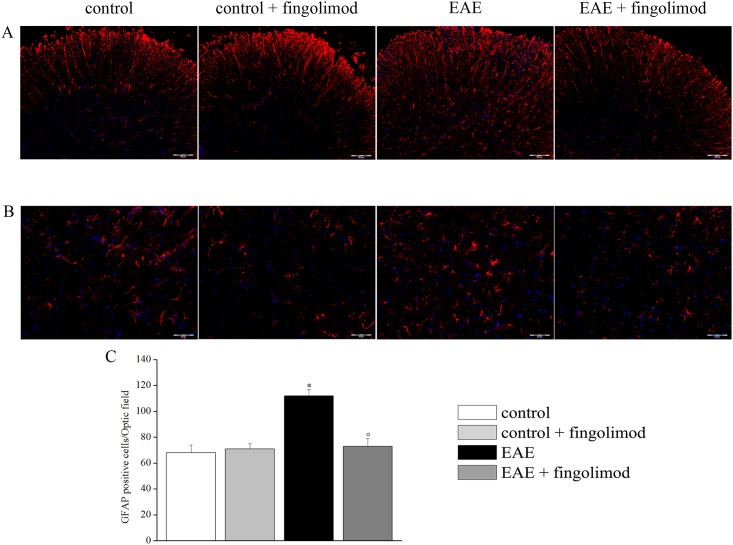
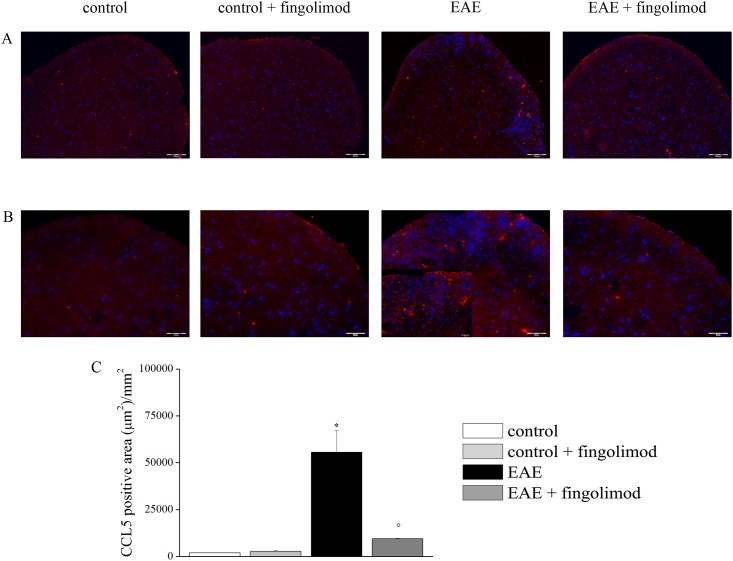
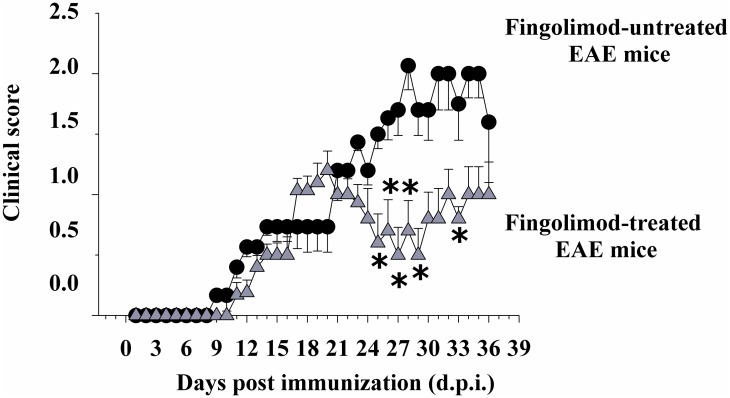
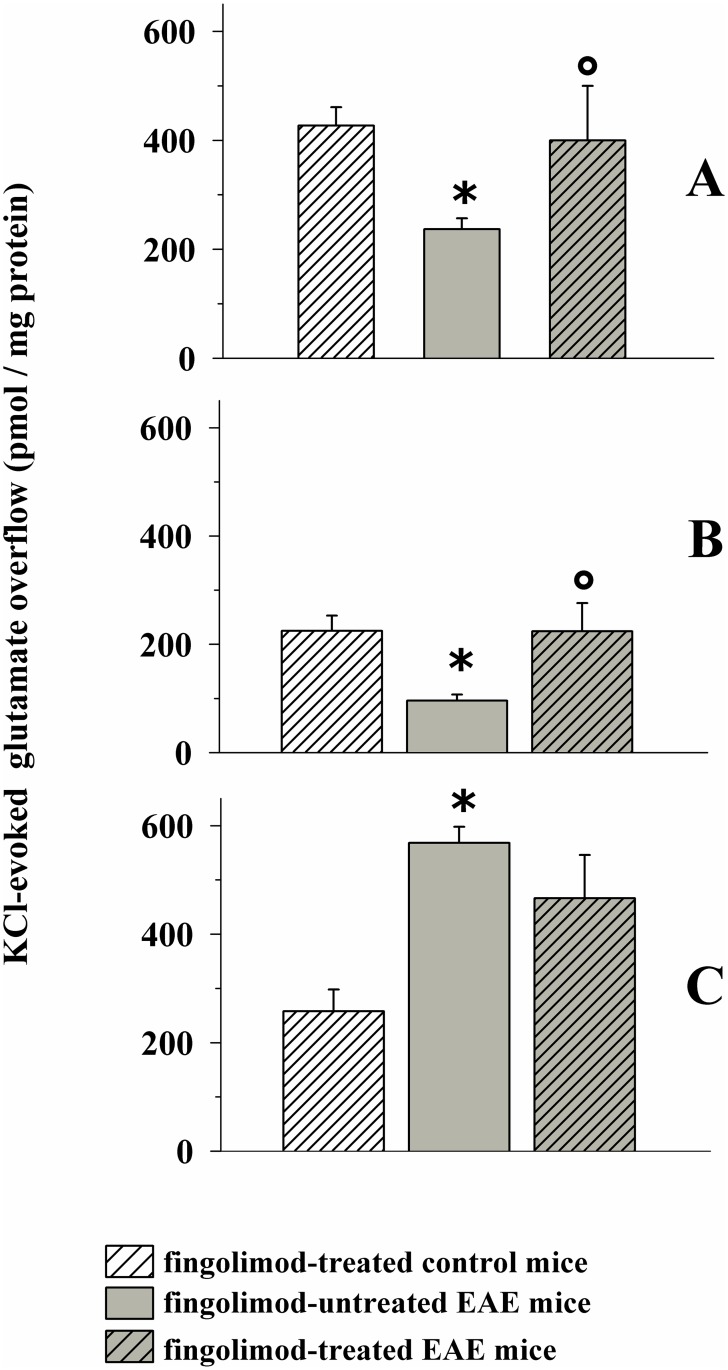
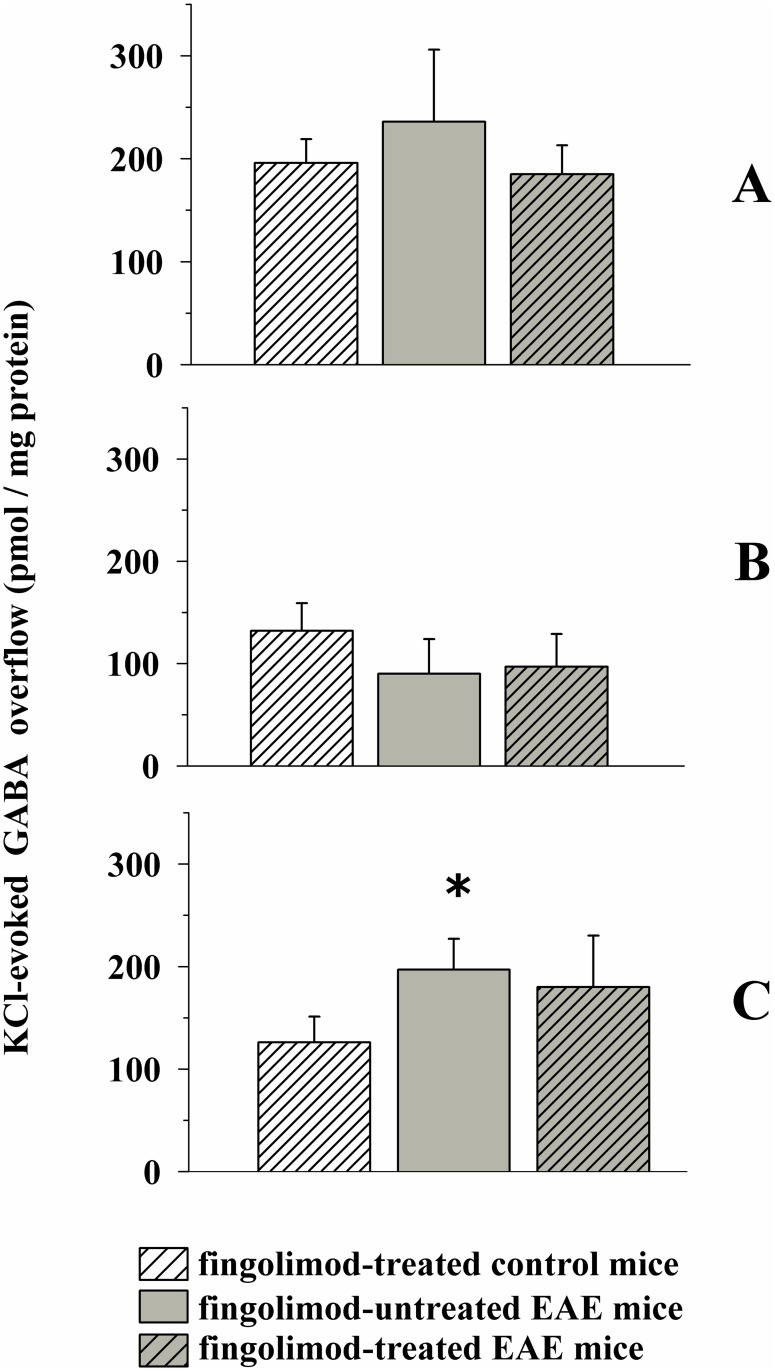
Fingolimod, the first oral, disease-modifying therapy for MS, has been recently proposed to modulate glutamate transmission in the central nervous system (CNS) of mice suffering from Experimental Autoimmune Encephalomyelitis (EAE) and in MS patients. Our study aims at investigating whether oral fingolimod recovers presynaptic defects that occur at different stages of disease in the CNS of EAE mice. In vivo prophylactic (0.3 mg/kg for 14 days, from the 7th day post immunization, d.p.i, the drug dissolved in the drinking water) fingolimod significantly reduced the clinical symptoms and the anxiety-related behaviour in EAE mice. Spinal cord inflammation, demyelination and glial cell activation are markers of EAE progression. These signs were ameliorated following oral fingolimod administration. Glutamate exocytosis was shown to be impaired in cortical and spinal cord terminals isolated from EAE mice at 21 ± 1 d.p.i., while GABA alteration emerged only at the spinal cord level. Prophylactic fingolimod recovered these presynaptic defects, restoring altered glutamate and GABA release efficiency. The beneficial effect occurred in a dose-dependent, region-specific manner, since lower (0.1-0.03 mg/kg) doses restored, although to a different extent, synaptic defects in cortical but not spinal cord terminals. A delayed reduction of glutamate, but not of GABA, exocytosis was observed in hippocampal terminals of EAE mice at 35 d.p.i. Therapeutic (0.3 mg/kg, from 21 d.p.i. for 14 days) fingolimod restored glutamate exocytosis in the cortex and in the hippocampus of EAE mice at 35 ± 1 d.p.i. but not in the spinal cord, where also GABAergic defects remained unmodified. These results improve our knowledge of the molecular events accounting for the beneficial effects elicited by fingolimod in demyelinating disorders.


Conflict of interest statement

The authors have declared that no competing interests exist.

Figures

Fig 1
Fig 1. Effect of in vivo prophylactic fingolimod on the clinical score of EAE mice.
Animal scores in untreated (black circle, n = 22 animals) and fingolimod (0.3 mg/kg) treated (grey triangle, n = 22 animals) EAE mice at different stages of disease. Clinical signs were detected daily in EAE mice and are expressed as average (mean ± SEM * p < 0.05 at least versus daily clinical score in untreated EAE mice.
Fig 2
Fig 2. Effects of in vivo prophylactic fingolimod on demyelination and inflammation in the spinal cord of EAE mice at the acute stage of disease.
On day 21 post EAE induction, spinal cord sections were analyzed. (A, B) Luxol Fast Blue stained myelin in blue and revealed demyelinated areas; (C, D) Hematoxylin/Eosin stained infiltrated cells and tissue components. Representative images at 10X (A, C) and 20X (B, D) magnification of white matter of anterior spinal cord of each group are shown. (E) CD3-positive cells in spinal cord. Sections were immune-stained with the anti-CD3 antibody (red) to recognize T-cells and with DAPI (blue) to identify cell nuclei. Representative images of 20X magnification of the spinal cord section. (F) The number of CD3-positive cells/mm2 in the spinal cord of mice of each treatment-group is reported. * p < 0.05 versus control untreated mice; ° p < 0.05 versus untreated EAE mice. Histochemical analysis and CD3 staining were performed on slices from control untreated mice (n = 5), from control 0.3 mg /kg fingolimod-treated mice (n = 4), from EAE untreated mice (n = 5), from EAE 0.3 mg /kg fingolimod-treated mice (n = 5).
Fig 3
Fig 3. Effect of in vivo prophylactic fingolimod on the anxiety-like behaviour in EAE mice.
Fingolimod untreated (white circle, n = 15 mice) control mice; fingolimod treated (white triangle, n = 15 mice) control mice; Fingolimod untreated (black circle, n = 16 mice) EAE mice; Fingolimod treated (grey triangle, n = 16 mice) EAE mice at 7 and 18 d.p.i. were monitored for anxiety-therapeutic behaviour that was quantified in the light dark box as total time spent into the lighted compartment [time in the light (sec), A] and as number of crossings from the lighted to the dark side of the box [crossings (n), B]. Anxiety was also quantified as time spent in periphery (thigmotaxis) in the open field (C). Data represent the media ± SEM. * p < 0.05 at least versus fingolimod-treated EAE mice at 7 d.p.i; ° p < 0.05 at least versus untreated EAE mice at 18 d.p.i.
Fig 4
Fig 4. Effect of in vivo prophylactic fingolimod (0.3 mg/kg) on the depolarization-evoked exocytosis of endogenous glutamate from nerve terminals isolated from selected regions of the CNS of control and EAE mice.
Female mice were randomly assigned to the following groups: control mice (empty bar, n = 8 mice); fingolimod-treated control mice (rising-right hatched empty bar, n = 8 mice); EAE mice (grey bar, n = 8 mice); fingolimod-treated EAE mice (rising-right hatched grey bar, n = 8 mice). Fingolimod was administered in the drinking water for 14 days starting from 7 d.p.i. At 21 ± 1 d.p.i mice were sacrificed and cortical (A), hippocampal (B) and spinal cord (C) synaptosomes were isolated to monitor the exocytosis of endogenous glutamate elicited by a mild (12 mM KCl enriched superfusion medium for cortical and hippocampal synaptosomes and 15 mM KCl enriched superfusion medium for spinal cord synaptosomes) depolarizing stimulus. Results are expressed as KCl-evoked overflow; data are expressed as pmoles / mg protein and represent the mean ± SEM. Each experiment was carried out with the synaptosomal preparations isolated from one animal for each group, and it was run in triplicate (three superfusion chambers for each animal). * p < 0.05 at least versus control untreated mice; ° p < 0.05 at least versus EAE untreated mice.
Fig 5
Fig 5. Effect of in vivo prophylactic fingolimod (0.3 mg/kg) on the depolarization-evoked exocytosis of endogenous GABA from nerve terminals isolated from selected regions of the CNS of control and EAE mice.
Female mice were randomly assigned to the following groups: control mice (empty bar, n = 8 mice); fingolimod-treated control mice (rising-right hatched empty bar, n = 8 mice); EAE mice (grey bar, n = 8 mice); fingolimod-treated EAE mice (rising-right hatched grey bar, n = 8 mice). Fingolimod was administered as described above. At 21 ± 1 d.p.i. mice were sacrificed and cortical (A), hippocampal (B) and spinal cord (C) synaptosomes were isolated to monitor the exocytosis of endogenous GABA elicited by a mild depolarizing stimulus as previously described. Results are expressed as KCl-evoked overflow; data are expressed as pmoles / mg protein and represent the mean ± SEM. * p < 0.05 at least versus control untreated mice; ° p < 0.05 at least versus EAE untreated mice.
Fig 6
Fig 6. Effect of in vivo different doses of prophylactic fingolimod on the depolarization-evoked exocytosis of endogenous glutamate and GABA from nerve terminals isolated from selected regions of the CNS of control and EAE mice.
Female mice were randomly assigned to the following groups: control mice (empty bar, n = 6 mice); EAE mice (grey bar, n = 8 mice); fingolimod (0.03 mg/kg, n = 8 mice)-treated EAE mice (rising-left hatched grey bar); fingolimod (0.1 mg/kg)-treated EAE mice (cross-hatched grey bar). Fingolimod was administered as described above. At 21 ± 1 d.p.i. mice were sacrificed and cortical (A) and spinal cord (B and C) synaptosomes were isolated to monitor the exocytosis of endogenous glutamate (A and B) and GABA (C) elicited by a mild depolarizing stimulus as previously described. Results are expressed as KCl-evoked overflow of the endogenous aminoacids; data are expressed as pmoles / mg protein and represent the mean ± SEM experiments run in triplicate. * p < 0.05 at least versus control untreated mice; ° p < 0.05 at least versus EAE untreated mice.
Fig 7
Fig 7. Effects of in vivo prophylactic fingolimod on microglial cells in the spinal cord of EAE mice at the acute stage of disease.
On day 21 post EAE induction, tissue sections were immuno-stained with the anti-Iba1 antibody (red) to recognize microglia cells and with DAPI (blue) to identify cell nuclei. (A) 10X: Low-magnification image of spinal cord sections. (B) 20X: High-magnification image of the spinal cord sections. (C) Quantitative evaluation of the number of Iba1-positive cells/Optic field in the spinal cord of mice of each treatment-group. * p < 0.05 versus all other groups; ° p < 0.05 versus untreated EAE mice.
Fig 8
Fig 8. Effects of in vivo prophylactic fingolimod on astrocytes in the spinal cord of EAE mice at the acute stage of disease.
On day 21 post EAE induction, tissue sections were immuno-stained with the anti-GFAP antibody (red) to recognize astrocytes and with DAPI (blue) to identify cell nuclei. (A) 10X: Low-magnification image of spinal cord sections. (B) 20X: High-magnification image of the spinal cord sections. (C) Quantitative evaluation of the number of GFAP-positive cells/Optic field in the spinal cord of mice of each treatment-group. * p < 0.05 versus all other groups; ° p < 0.05 versus untreated EAE mice.
Fig 9
Fig 9. Effects of in vivo prophylactic fingolimod on CCL5 in the spinal cord of EAE mice at the acute stage of disease.
On day 21 post EAE induction, tissue sections were immuno-stained with the anti-CCL5 antibody (red) and with DAPI (blue) to identify cell nuclei. (A) 10X: Low-magnification image of spinal cord sections; (B) 20X: High-magnification image of the spinal cord sections; (C) The CCL5 positive area (μm2)/mm2 in the spinal cord of mice of each treatment-group is reported. * p < 0.05 versus control untreated mice; ° p < 0.05 versus untreated EAE mice.
Fig 10
Fig 10. Effect of in vivo therapeutic fingolimod on the clinical score of EAE mice.
Animal scores in control (untreated, black circle, n = 16 animals) and fingolimod (0.3 mg/kg, starting from 21 d.p.i. until 35 d.p.i.)-treated (grey triangle, n = 15 animals) EAE mice at different stages of disease. Clinical signs were detected daily in EAE mice and are expressed as average (mean ± SEM). * p < 0.05 at least versus daily clinical score in untreated EAE mice.
Fig 11
Fig 11. Effect of in vivo therapeutic fingolimod (0.3 mg/kg) on the depolarization-evoked exocytosis of endogenous glutamate from nerve terminals isolated from selected regions of the CNS of control and EAE mice.
Female mice were randomly assigned to the following groups: fingolimod-treated control mice (rising-right hatched empty bar, n = 6 animals); EAE mice (grey bar, n = 10 animals); fingolimod-treated EAE mice (rising-right hatched grey bar, n = 10 animals). Fingolimod was administered in the drinking water for 14 days starting from 21 d.p.i.. At 35 ± 1 d.p.i. mice were sacrifice and cortical (A), hippocampal (B) and spinal cord (C) synaptosomes were isolated to monitor the exocytosis of endogenous glutamate elicited by a mild depolarizing stimulus as previously described. Results are expressed as KCl-evoked overflow; data are expressed as pmoles / mg protein and represent the mean ± SEM. * p < 0.05 at least versus fingolimod-treated control mice; ° p < 0.05 at least versus EAE mice.
Fig 12
Fig 12. Effect of in vivo therapeutic fingolimod (0.3 mg/kg) on the depolarization-evoked exocytosis of endogenous GABA from nerve terminals isolated from selected regions of the CNS of control and EAE mice.
Female mice were randomly assigned to the following groups: fingolimod-treated control mice (rising-right hatched empty bar, n = 6 animals); EAE mice (grey bar, n = 10 animals); fingolimod-treated EAE mice (rising-right hatched grey bar, n = 10 animals). Fingolimod was administered in the drinking water for 14 days starting from 21 d.p.i.. At 35 ± 1 d.p.i. mice were sacrifice and cortical (A), hippocampal (B) and spinal cord (C) synaptosomes were isolated to monitor the exocytosis of endogenous GABA elicited by a mild depolarizing stimulus as described above. Results are expressed as KCl-evoked overflow; data are expressed as pmoles / mg protein and represent the mean ± SEM. * p < 0.05 at least versus fingolimod-treated control mice.

References

    1. Groom AJ, Smith T, Turski L (2003) Multiple sclerosis and glutamate. Ann NY Acad Sci 993: 229–275. - PubMed
    1. Schwartz M, Shaked I, Fisher J, Mizrahi T, Shori H (2003) Protective autoimmunity against the enemy within: fighting glutamate toxicity. Trends Neurosci 26: 297–302. 10.1016/S0166-2236(03)00126-7 - DOI - PubMed
    1. Lanz M, Hahn HK, Hildebrandt H (2007) Brain atrophy and cognitive impairment in multiple sclerosis: a review. J Neurol 254 Suppl 2: II43–48. - PubMed
    1. Centonze D, Muzio L, Rossi S, Cavasinni F, De Chiara V, Bergami A et al. (2009) Inflammation triggers synaptic alteration and degeneration in experimental autoimmune encephalomyelitis. J Neurosci 29: 3442–3452. 10.1523/JNEUROSCI.5804-08.2009 - DOI - PMC - PubMed
    1. Nisticò R, Mori F, Feligioni M, Nicoletti F, Centonze D (2013) Synaptic plasticity in multiple sclerosis and in experimental autoimmune encephalomyelitis. Philos Trans R Soc Lond B Biol Sci 369: 20130162 10.1098/rstb.2013.0162 - DOI - PMC - PubMed

MeSH terms

LinkOut - more resources