. 2017 Jan 26;12(1):e0170903.
doi: 10.1371/journal.pone.0170903. eCollection 2017.

Lack of Casein Kinase 1 Delta Promotes Genomic Instability - The Accumulation of DNA Damage and Down-Regulation of Checkpoint Kinase 1

Affiliations

Lack of Casein Kinase 1 Delta Promotes Genomic Instability - The Accumulation of DNA Damage and Down-Regulation of Checkpoint Kinase 1

Yoshimi Endo Greer et al. PLoS One. .

Abstract

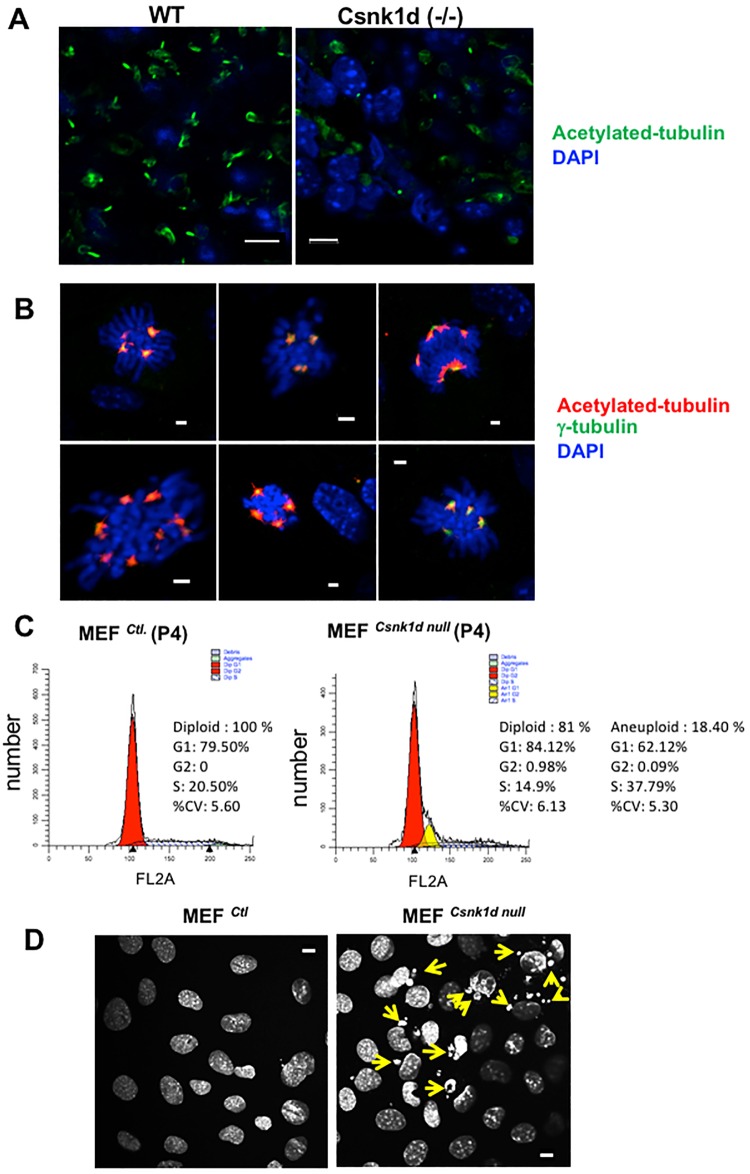
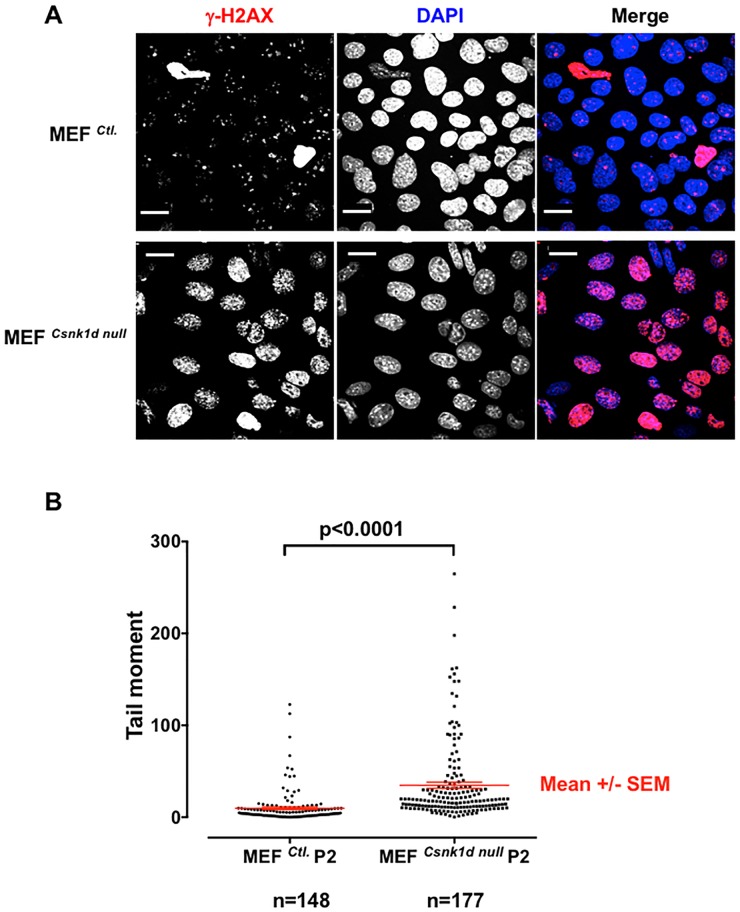
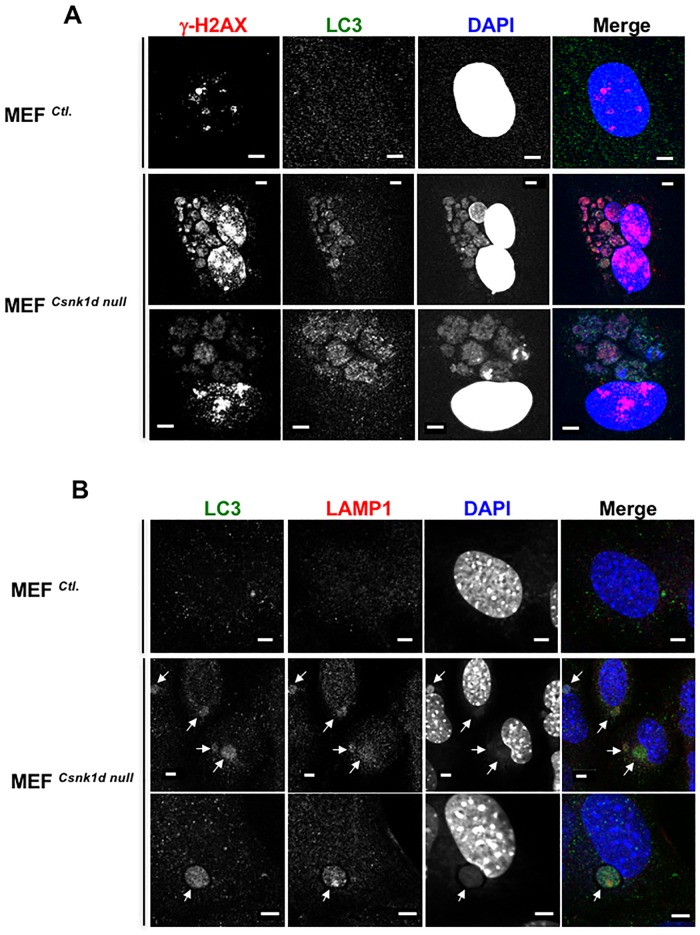
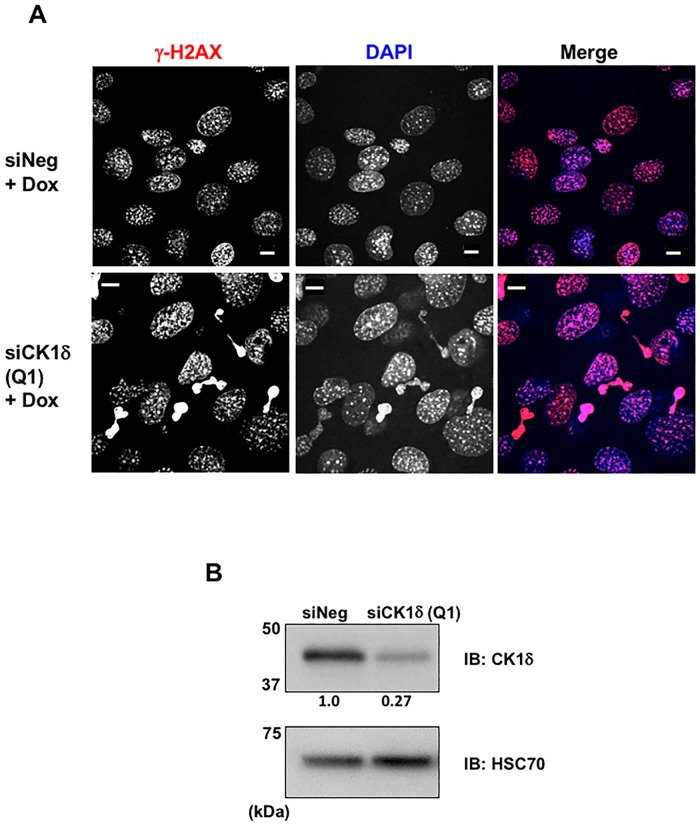
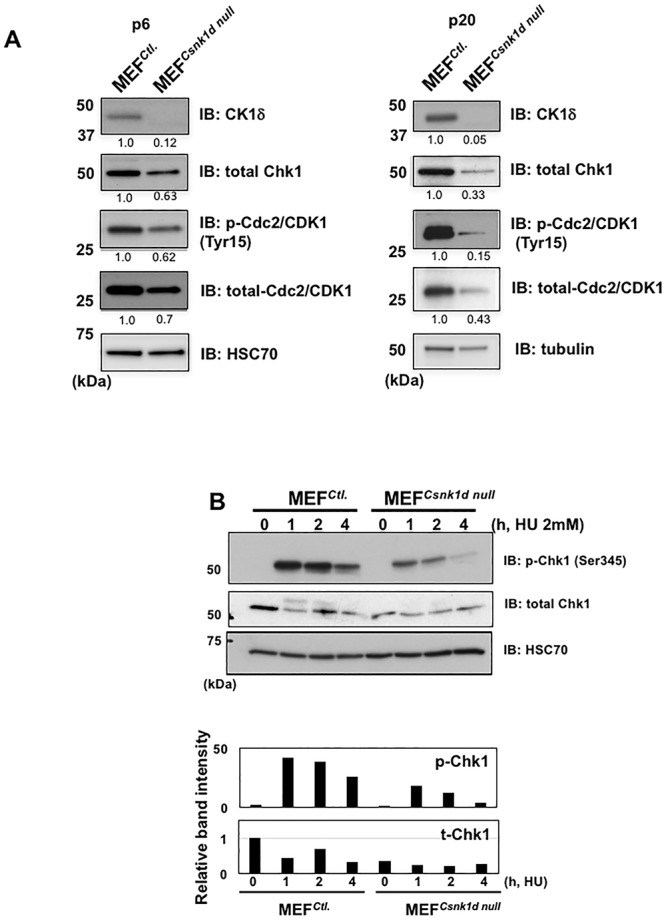
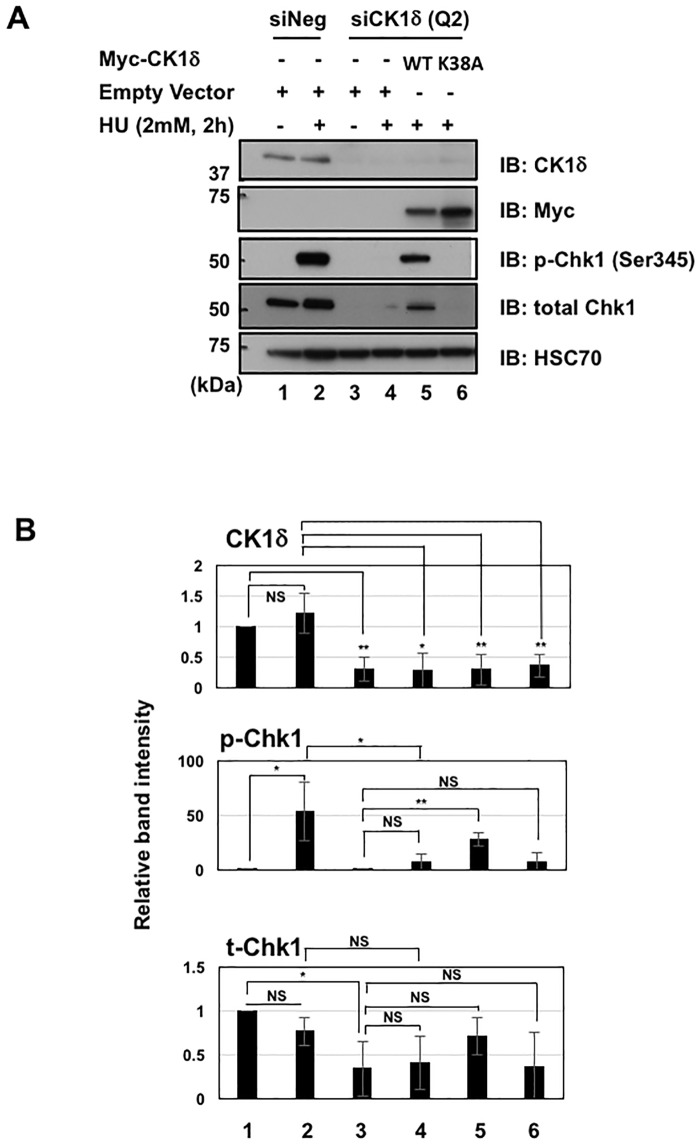
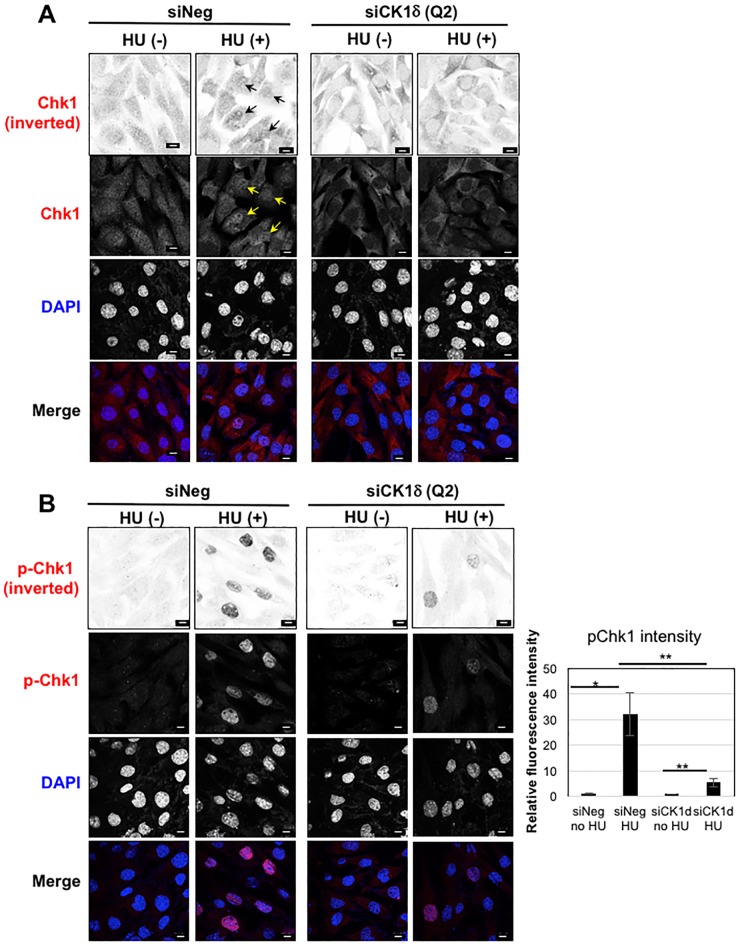
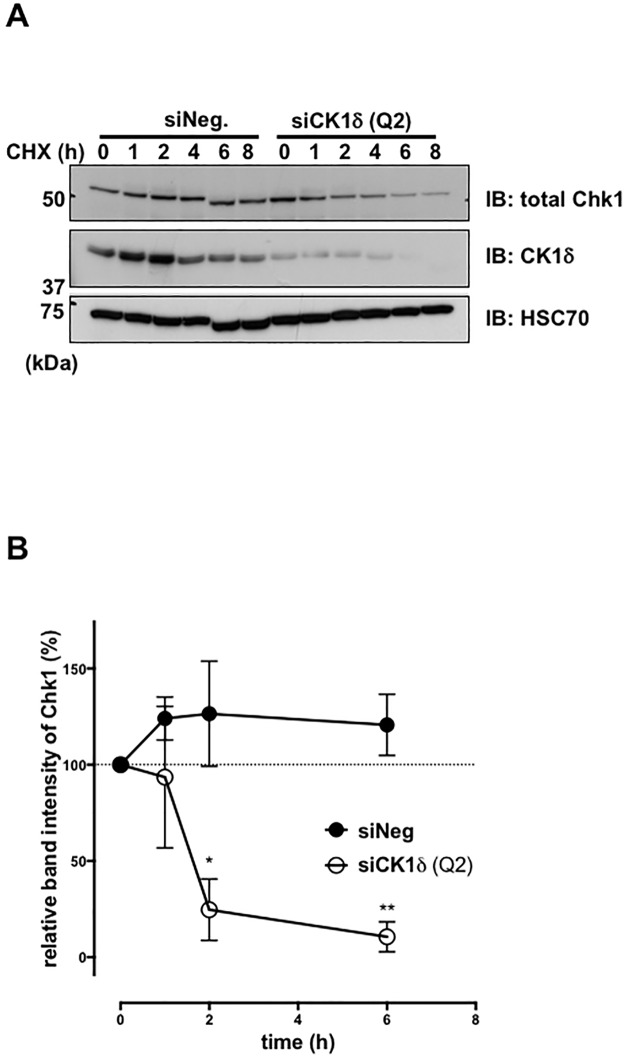
Casein kinase 1 delta (CK1δ) is a conserved serine/threonine protein kinase that regulates diverse cellular processes. Mice lacking CK1δ have a perinatal lethal phenotype and typically weigh 30% less than their wild type littermates. However, the causes of death and small size are unknown. We observed cells with abnormally large nuclei in tissue from Csnk1d null embryos, and multiple centrosomes in mouse embryo fibroblasts (MEFs) deficient in CK1δ (MEFCsnk1d null). Results from γ-H2AX staining and the comet assay demonstrated significant DNA damage in MEFCsnk1d null cells. These cells often contain micronuclei, an indicator of genomic instability. Similarly, abrogation of CK1δ expression in control MEFs stimulated micronuclei formation after doxorubicin treatment, suggesting that CK1δ loss increases vulnerability to genotoxic stress. Cellular levels of total and activated checkpoint kinase 1 (Chk1), which functions in the DNA damage response and mitotic checkpoints, and its downstream effector, Cdc2/CDK1 kinase, were often decreased in MEFCsnk1d null cells as well as in control MEFs transfected with CK1δ siRNA. Hydroxyurea-induced Chk1 activation, as measured by Ser345 phosphorylation, and nuclear localization also were impaired in MEF cells following siRNA knockdown of CK1δ. Similar results were observed in the MCF7 human breast cancer cell line. The decreases in phosphorylated Chk1 were rescued by concomitant expression of siRNA-resistant CK1δ. Experiments with cycloheximide demonstrated that the stability of Chk1 protein was diminished in cells subjected to CK1δ knockdown. Together, these findings suggest that CK1δ contributes to the efficient repair of DNA damage and the proper functioning of mitotic checkpoints by maintaining appropriate levels of Chk1.


Conflict of interest statement

The authors have declared that no competing interests exist.

Figures

Fig 1
Fig 1. MEFCsnk1d null cells exhibit abnormal nuclear phenotypes indicative of genomic instability.
(A) Retinal tissue from wild type and Csnk1d null E18.5 mouse embryos stained for DNA and acetylated tubulin. Representative micrographs, stained with DAPI (blue) to visualize nuclei and antibody to acetylated tubulin (green) to detect cilia. Bars, 5 μm. (B) MEFCsnk1d null cells (passage 4) with multiple centrosomes. Cells were stained with DAPI (blue), and antibodies to acetylated tubulin (red) and γ-tubulin (green), the latter was a centrosomal marker. Yellow indicates overlap of red and green stains. Bars, 2 μm. (C) Flow cytometric analysis of MEFCtl. and MEFCsnk1d null cells demonstrated aneuploidy in the latter. Percentages of diploid and aneuploid cells in the different phases of the cell cycle are indicated. Graphs show analysis of live cells; see S2 Fig for inclusion of sub G0/G1 population. (D) MEFCsnk1d null cells contain micronuclei. MEFCtl. and MEFCsnk1d null cells (both P4) were stained with DAPI. Arrows indicate micronuclei. Bars, 10 μm.
Fig 2
Fig 2. MEFCsnk1d null cells have more DNA damage than MEFCtl. cells.
(A) DNA damage response in MEFCtl. and MEFCsnk1d null cells. MEFCtl. and MEFCsnk1d null cells (P2) stained with antibody to γ-H2AX (red), a marker for double strand breaks, and DAPI (blue). Bars, 20 μm. (B) Comet assay demonstrated greater amount of DNA damage in MEFCsnk1d null cells. Size of tail moment corresponds to extend of DNA damage in the cell. “n” indicates the number of cells analyzed. Data are from one representative experiment among three independent experiments.
Fig 3
Fig 3. Micronuclei in MEFCsnk1d null cells are characterized by DDR and autophagosomal markers.
(A) MEFCtl. and MEFCsnk1d null cells (both, P5) were stained with DAPI (blue), and antibodies to γ-H2AX (red) and the autophagosomal marker, LC3 (green). Bars, 5 μm. (B) MEFCtl. and MEFCsnk1d null cells (both, P7) were stained with DAPI (blue), and antibodies to the autophagosomal markers, LC3 (green) and LAMP1 (red). Bars, 5 μm.
Fig 4
Fig 4. Doxorubicin stimulated the formation of γ-H2AX laden micronuclei in cells treated with CK1δ siRNA.
(A) MEFCtl. cells (P5) were transfected with negative control siRNA or CK1δ siRNA (Q1), and 67 h later treated with doxorubicin (5 μM) for 5 h. Cells were subsequently fixed and stained with γ-H2AX antibody (red) and DAPI (blue). Bars, 10 μm. (B) Western blot analysis of MEFCtl. cells treated with siRNA reagents as described in (A) Relative band intensity of CK1δ immunoblot (normalized with HSC70 loading control) is shown below the panel.
Fig 5
Fig 5. MEFCsnk1d null cells have lower levels of total and phosphorylated Chk1 and Cdc2/CDK1 than MEFCtl. cells.
(A) Western blot analysis of total Chk1, total and phosphorylated (Tyr15) Cdc2/CDK1, and CK1δ in MEFCtl. and MEFCsnk1d null cells from two sets of cells with different passage number (left, P6; right, P20). Band intensity relative to the HSC70 or tubulin loading control is indicated directly below each band. (B) Time course of Chk1 activation, as indicated by Ser345 phosphorylation, in the same passage of MEFCtl. and MEFCsnk1d null cells treated with hydroxyurea (HU). Histogram shows the band intensity of p-Chk1and total Chk1 relative to the HSC70 loading control. Band intensity of MEFCtl. cells not exposed to HU was defined as 1.0. (C) MEFCtl. (P9) cells were transfected with siRNA, and 46 h later cells were treated with HU for 1.5 h, followed by western blotting. Data in left panel are from one representative experiment. Histograms to the right show relative band intensities of p-Chk1, total Chk1 and CK1δ from two independent experiments. Band intensity of MEFCtl. cells transfected with siNeg and not exposed to HU was defined as 1.0.
Fig 6
Fig 6. Analysis of total and phosphorylated Chk1 in MEFCtl. cells after HU treatment, following CK1δ knockdown with or without subsequent expression of siRNA-resistant CK1δ constructs.
(A) MEFCtl. cells were transfected with control siRNA (siNeg) or siRNA targeting CK1δ (siCK1δ Q2). Twenty-four hours later, cells were transfected with the indicated DNA constructs (pcDNA 3.3 was the empty vector control). Seventy hours later, cells were treated with HU for 2 h and subjected to western blotting. Data are from one representative experiment among 3 independent experiments. (B) Statistical analysis of band intensity shown in (A). Relative band intensity of CK1δ, p-Chk1 and total Chk1 was analyzed in 3 independent experiments and shown as mean +/- SD. *p<0.05, **p<0.01, NS = not significant.
Fig 7
Fig 7. Nuclear distribution of Chk1 and p-Chk1 in MEFCtl. cells is inhibited by siRNA knockdown of CK1δ.
Cellular distribution of (A) Chk1 and (B) phosphorylated Chk1. MEFCtl. cells were transfected with negative control (siNeg) or CK1δ siRNA (siCK1δ), and 70 h later culture fluid was removed and fresh medium added with or without hydroxyurea (HU, 2mM final concentration) for 2 h incubation. Arrows indicate accumulation of Chk1 in the nucleus. Bars, 10 μm. Histogram shows statistical analysis of p-Chk1 intensity in the nucleus. Data is shown as mean +/- SD. p-Chk1 intensity was analyzed in 36 cells (siNeg—HU), 50 cells (siNeg + HU), 35 cells (siCK1δ - HU) and 30 cells (siCK1δ + HU). *p<0.05, **p<0.01. Knockdown of CK1δ in this experiment was confirmed by western blotting (data not shown).
Fig 8
Fig 8. Chk1 protein stability is decreased after siRNA knockdown of CK1δ.
(A) Western blot analysis of Chk1 and CK1δ in MEFCtl. cells treated with siNeg or siCK1δ and cycloheximide (CHX, 10 μg/ml) for the indicated times. HSC70 was a loading control. (B) Graph indicates the relative band intensity of Chk1 normalized to loading control in cells treated with the indicated siRNA reagents. Each point is the mean +/- SD of data from three experiments. *p<0.05, **p<0.01.

References

    1. Gross SD, Anderson RA. Casein kinase I: spatial organization and positioning of a multifunctional protein kinase family. Cell Signal. 1998;10(10):699–711. - PubMed
    1. Knippschild U, Gocht A, Wolff S, Huber N, Lohler J, Stoter M. The casein kinase 1 family: participation in multiple cellular processes in eukaryotes. Cell Signal. 2005;17(6):675–89. 10.1016/j.cellsig.2004.12.011 - DOI - PubMed
    1. Bischof J, Muller A, Fander M, Knippschild U, Fischer D. Neurite outgrowth of mature retinal ganglion cells and PC12 cells requires activity of CK1delta and CK1epsilon. PLoS One. 2011;6(6):e20857 10.1371/journal.pone.0020857 - DOI - PMC - PubMed
    1. Cheong JK, Virshup DM. Casein kinase 1: Complexity in the family. Int J Biochem Cell Biol. 2011;43(4):465–9. 10.1016/j.biocel.2010.12.004 - DOI - PubMed
    1. Greer YE, Rubin JS. Casein kinase 1 delta functions at the centrosome to mediate Wnt-3a-dependent neurite outgrowth. J Cell Biol. 2011;192(6):993–1004. 10.1083/jcb.201011111 - DOI - PMC - PubMed