Resource Use and Medicare Costs During Lay Navigation for Geriatric Patients With Cancer
- PMID: 28125760
- PMCID: PMC5540048
- DOI: 10.1001/jamaoncol.2016.6307
Resource Use and Medicare Costs During Lay Navigation for Geriatric Patients With Cancer
Abstract
Importance: Lay navigators in the Patient Care Connect Program support patients with cancer from diagnosis through survivorship to end of life. They empower patients to engage in their health care and navigate them through the increasingly complex health care system. Navigation programs can improve access to care, enhance coordination of care, and overcome barriers to timely, high-quality health care. However, few data exist regarding the financial implications of implementing a lay navigation program.
Objective: To examine the influence of lay navigation on health care spending and resource use among geriatric patients with cancer within The University of Alabama at Birmingham Health System Cancer Community Network.
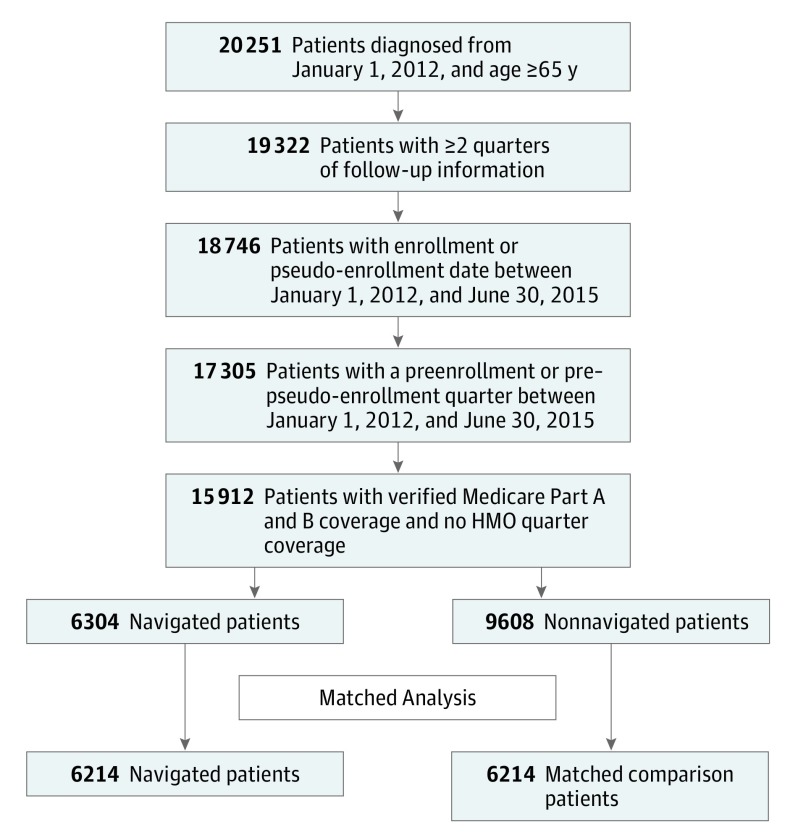
Design, setting, and participants: This observational study from January 1, 2012, through December 31, 2015, used propensity score-matched regression analysis to compare quarterly changes in the mean total Medicare costs and resource use between navigated patients and nonnavigated, matched comparison patients. The setting was The University of Alabama at Birmingham Health System Cancer Community Network, which includes 2 academic and 10 community cancer centers across Alabama, Georgia, Florida, Mississippi, and Tennessee. Participants were Medicare beneficiaries with cancer who received care at participating institutions from 2012 through 2015.
Exposures: The primary exposure was contact with a patient navigator. Navigated patients were matched to nonnavigated patients on age, race, sex, cancer acuity (high vs low), comorbidity score, and preenrollment characteristics (costs, emergency department visits, hospitalizations, intensive care unit admissions, and chemotherapy in the preenrollment quarter).
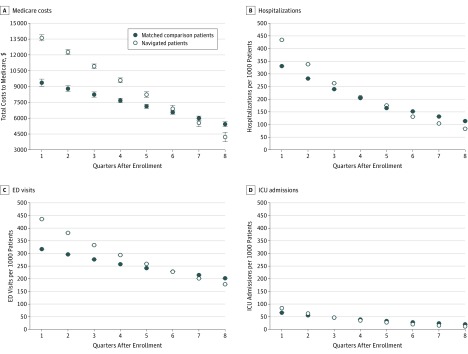
Main outcomes and measures: Total costs to Medicare, components of cost, and resource use (emergency department visits, hospitalizations, and intensive care unit admissions).
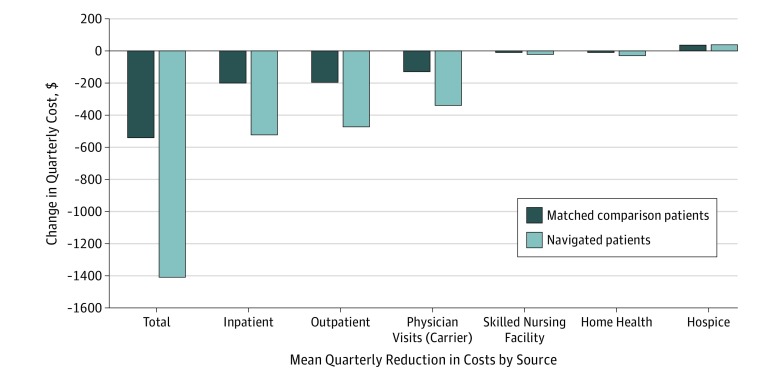
Results: In total, 12 428 patients (mean (SD) age at cancer diagnosis, 75 (7) years; 52.0% female) were propensity score matched, including 6214 patients in the navigated group and 6214 patients in the matched nonnavigated comparison group. Compared with the matched comparison group, the mean total costs declined by $781.29 more per quarter per navigated patient (β = -781.29, SE = 45.77, P < .001), for an estimated $19 million decline per year across the network. Inpatient and outpatient costs had the largest between-group quarterly declines, at $294 and $275, respectively, per patient. Emergency department visits, hospitalizations, and intensive care unit admissions decreased by 6.0%, 7.9%, and 10.6%, respectively, per quarter in navigated patients compared with matched comparison patients (P < .001).
Conclusions and relevance: Costs to Medicare and health care use from 2012 through 2015 declined significantly for navigated patients compared with matched comparison patients. Lay navigation programs should be expanded as health systems transition to value-based health care.
Conflict of interest statement
Figures
Comment in
-
Patient Navigation-An Effective Strategy to Reduce Health Care Costs and Improve Health Outcomes.JAMA Oncol. 2017 Jun 1;3(6):825-826. doi: 10.1001/jamaoncol.2016.6107. JAMA Oncol. 2017. PMID: 28125752 No abstract available.
References
-
- Squires D, Anderson C. U.S. health care from a global perspective: spending, use of services, prices, and health in 13 countries. Issue Brief (Commonw Fund). 2015;15:1-15. - PubMed
-
- Berwick DM, Nolan TW, Whittington J. The Triple Aim: care, health, and cost. Health Aff (Millwood). 2008;27(3):759-769. - PubMed
-
- American Society of Clinical Oncology The state of cancer care in America, 2014: a report by the American Society of Clinical Oncology. J Oncol Pract. 2014;10(2):119-142. - PubMed
-
- Mitka M. IOM report: aging US population, rising costs, and complexity of cases add up to crisis in cancer care. JAMA. 2013;310(15):1549-1550. - PubMed
-
- Smith M, Saunders R, Stuckhardt L, McGinnis JM, eds. Best Care at Lower Cost: The Path to Continuously Learning Health Care in America. Washington, DC: National Academy of Sciences; 2013. - PubMed
Publication types
MeSH terms
Grants and funding
LinkOut - more resources
Full Text Sources
Other Literature Sources
Medical