. 2017 Mar;27(3):460-474.
doi: 10.1089/thy.2016.0130. Epub 2017 Feb 17.

An Adult Mouse Thyroid Side Population Cell Line that Exhibits Enriched Epithelial-Mesenchymal Transition

Affiliations

An Adult Mouse Thyroid Side Population Cell Line that Exhibits Enriched Epithelial-Mesenchymal Transition

Tsubasa Murata et al. Thyroid. 2017 Mar.

Abstract

Background: Studies of thyroid stem/progenitor cells have been hampered due to the small organ size and lack of tissue, which limits the yield of these cells. A continuous source that allows the study and characterization of thyroid stem/progenitor cells is desired to push the field forward.

Method: A cell line was established from Hoechst-resistant side population cells derived from mouse thyroid that were previously shown to contain stem/progenitor-like cells. Characterization of these cells were carried out by using in vitro two- and three-dimensional cultures and in vivo reconstitution of mice after orthotopic or intravenous injection, in conjunction with quantitative reverse transcription polymerase chain reaction, Western blotting, immunohisto(cyto)chemistry/immunofluorescence, and RNA seq analysis.

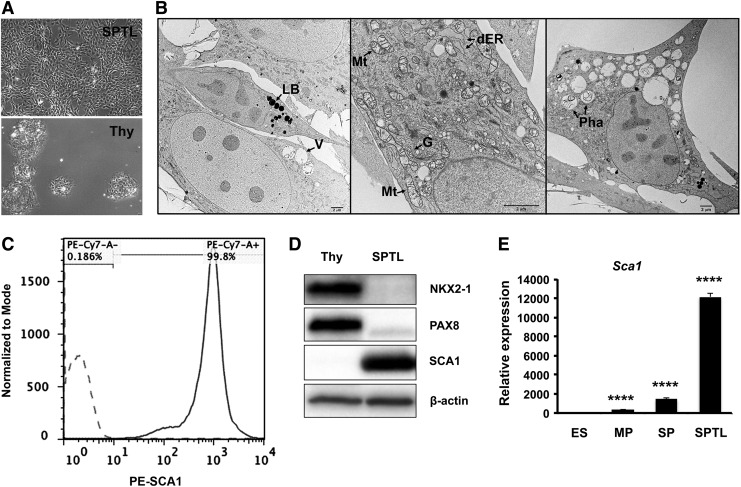
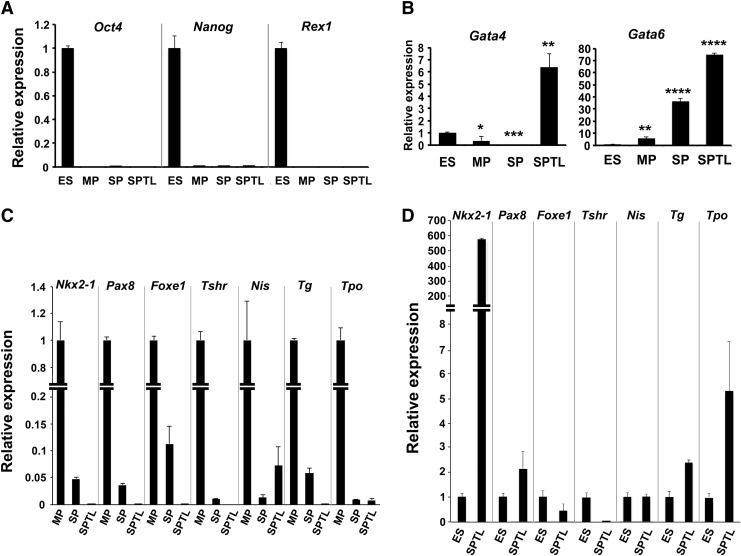
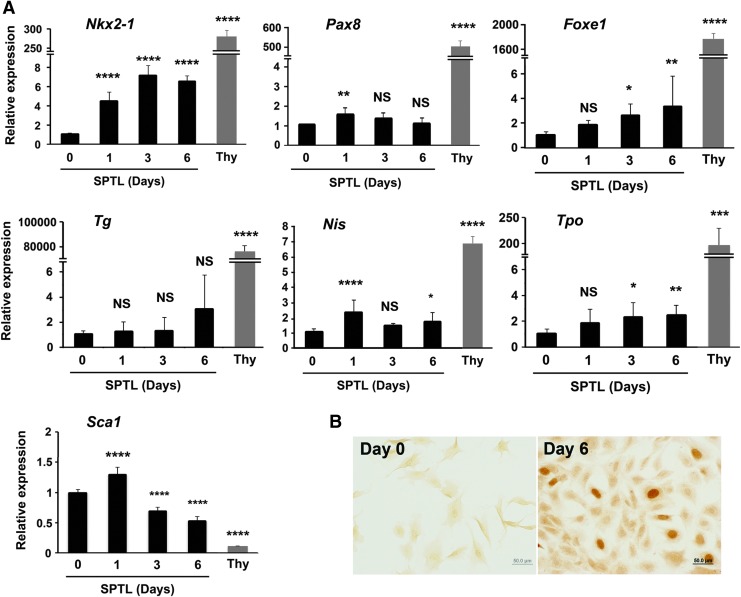
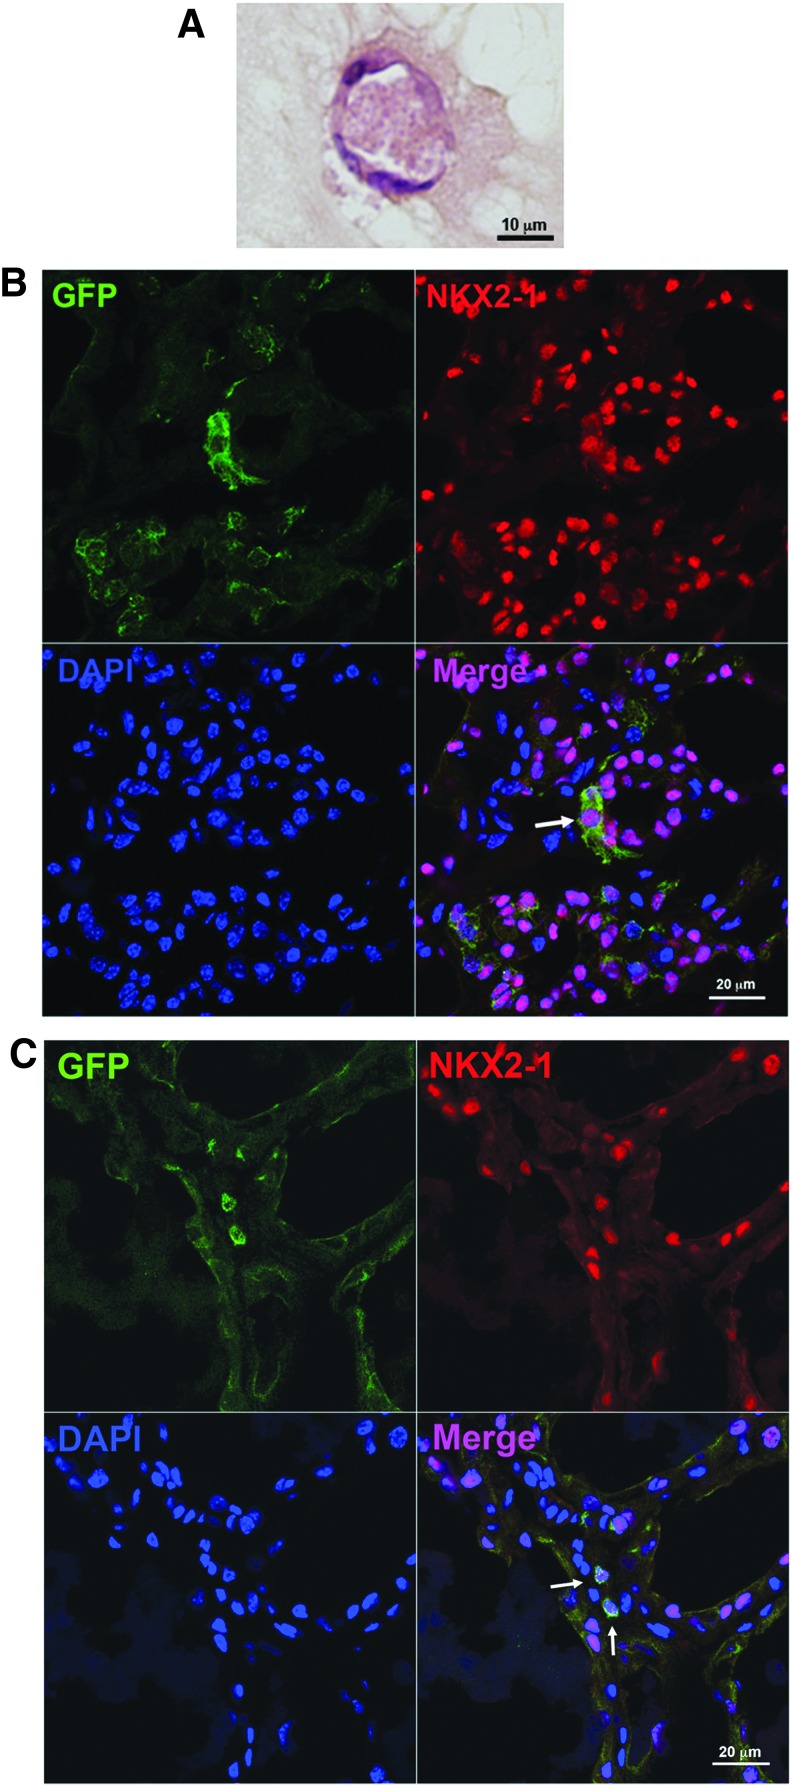
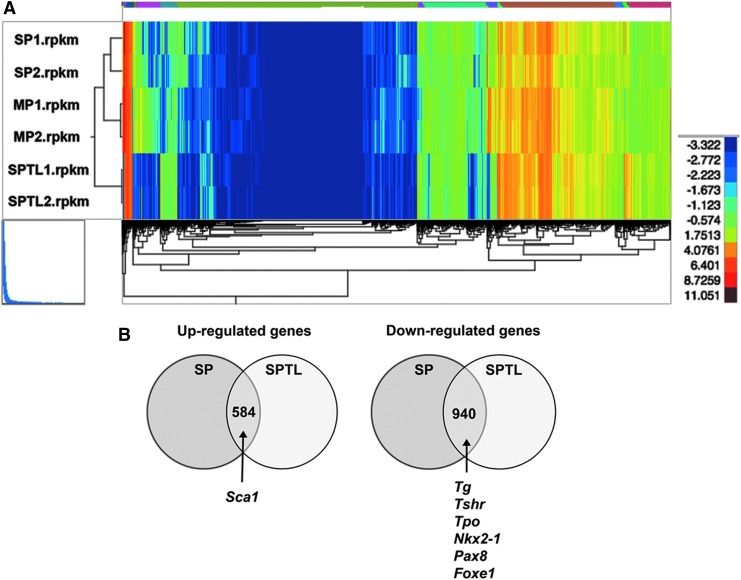
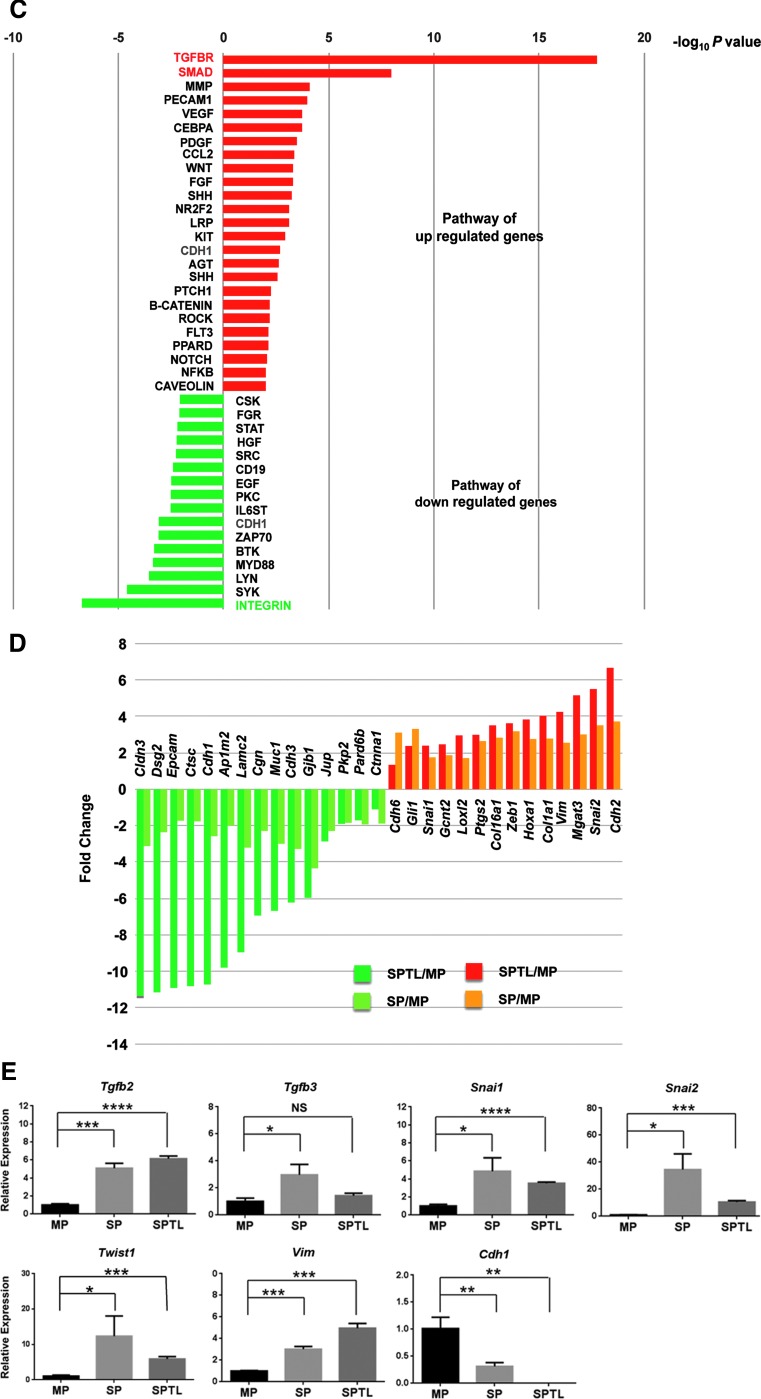
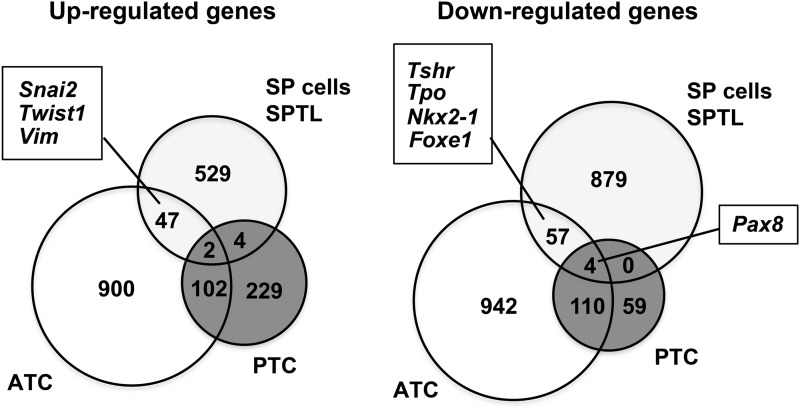
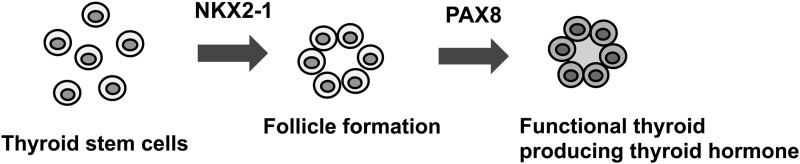
Results: These cells were named SPTL (side population cell-derived thyroid cell line). Under low serum culturing conditions, SPTL cells expressed the thyroid differentiation marker NKX2-1, a transcription factor critical for thyroid differentiation and function, while no expression of other thyroid differentiation marker genes were observed. SPTL cells formed follicle-like structures in Matrigel® cultures, which did not express thyroid differentiation marker genes. In mouse models of orthotopic and intravenous injection, the latter following partial thyroidectomy, a few SPTL cells were found in part of the follicles, most of which expressed NKX2-1. SPTL cells highly express genes involved in epithelial-mesenchymal transition, as demonstrated by RNA seq analysis, and exhibit a gene-expression pattern similar to anaplastic thyroid carcinoma.

Conclusion: These results demonstrate that SPTL cells have the capacity to differentiate into thyroid to a limited degree. SPTL cells may provide an excellent tool to study stem cells, including cancer stem cells of the thyroid.

Keywords: RNA seq analysis; epithelial-to-mesenchymal transition; thyroid cancer; thyroid side population; thyroid stem cells.


Conflict of interest statement

The authors have nothing to disclose.

Figures

<b>FIG. 1.</b>
FIG. 1.
Characteristics of side population cell-derived thyroid cell line (SPTL) cells. (A) Monolayer culture of SPTL cells (upper: SPTL) and primary thyroid cells (lower: Thy). (B) Representative electron microscopic images. Cells are small, round, elongated, or three- or four-pointed star-shaped (most right panel). LB, lipid body; V, vacuole; Mt, mitochondria; dER, dilated endoplasmic reticulum; G, Golgi apparatus; Pha, Phagosome. The matrix of most mitochondria is not enriched. (C) Fluorescence-activated cell sorting (FACS) analysis for SCA1. Dotted line and straight line show cells treated without and with PE-conjugated SCA1 antibody, respectively. (D) Western blot analysis of SPTL cells for the expression of SCA1, as well as thyroid differentiation markers, NKX2-1 and PAX8, compared with mouse thyroid primary cells (Thy). SPTL cells were those cultured under 10% serum. β-Actin was used as a loading control (15 μg/lane). (E) Quantitative reverse transcription polymerase chain reaction (qRT-PCR) analysis of Sca1 mRNA expression in SPTL, original side population (SP) and main population (MP), and embryonic stem (ES) cells, cultured under 10% serum. Relative expression is shown based on the expression level of ES cells as 1. Mean ± standard deviation (SD) from representative experiment in triplicate are shown. Note that qRT-PCR was carried out at least twice using samples prepared at different times. Similar results to those shown were obtained. ****p < 0.0001 for ES vs. MP, SP, and SPTL by unpaired t-test.
<b>FIG. 2.</b>
FIG. 2.
qRT-PCR analyses of various genes from ES, MP, SP, and SPTL cells. (A) Expression of stem cell marker gene mRNAs, Oct4, Nanog, and Rex1. Relative expression is shown based on the expression level of ES cells as 1. p < 0.0001 for ES versus MP, SP, or SPTL for all genes. (B) Expression of Gata4 and Gata 6 mRNAs. Relative expression is shown based on the expression level of ES cells as 1. *p < 0.05; **p < 0.01; ***p < 0.001; ****p < 0.0001 for ES vs. MP, SP, or SPTL. (C) Expression of various mRNAs encoded by thyroid differentiation marker genes as indicated. Relative expression is shown based on the expression level of MP cells as 1. p < 0.0001 for MP versus SP or SPTL for all genes. (D) Expression of mRNAs encoded by various thyroid differentiation marker genes in SPTL cells compared with ES cells. Relative expression is based on the expression level of ES cells as 1. p < 0.0001 for ES versus SPTL for all genes. All cells used in these experiments were cultured in the presence of 10% serum. For each mRNA, mean ± SD from representative experiment in triplicate are shown. Note that qRT-PCR was carried out at least twice using samples prepared at different times. Similar results to those shown were obtained. Statistical analysis by unpaired t-test.
<b>FIG. 3.</b>
FIG. 3.
Induction of thyroid differentiation markers in monolayer culture of SPTL cells. (A) SPTL cells in monolayer culture were collected at days 0, 1, 3, and 6 after serum concentration was changed to 2%. Day 0 is equivalent to 10% culture condition. The expression levels of thyroid primary culture cells (Thy) are shown as comparison. Relative expression is based on the expression level of SPTL day 0 cultured cells as 1. Mean ± SD from three experiments, determined in triplicate are shown. *p < 0.05; **p < 0.01; ***p < 0.001; ****p < 0.0001; NS, not significant for day 0 vs. days 1, 3, and 6 of SPTL cultures by one-way analysis of variance. ****p < 0.0001 for day 0 SPTL cells versus Thy (thyroid primary culture cells) by unpaired t-test. (B) Immunocytochemistry for NKX2-1 using SPTL cells collected at days 0 and 6 under 2% serum conditions. Experiments were carried out more than three times, and each time, similar results were obtained. Representative results are shown.
<b>FIG. 4.</b>
FIG. 4.
In vitro and in vivo analysis of SPTL cells. (A) Matrigel® culture of SPTL cells. After culturing for six days in 2% serum, SPTL cells were subjected to Matrigel® culture for 16 days, which were then used for hematoxylin and eosin (H&E) staining. (B) Co-immunofluorescence analysis of orthotopically injected SPTL cells for GFP, NKX2-1, and DAPI. The analysis was carried out 14 days after injection of cells. (C) Co-immunofluorescence analysis of intravenously injected SPTL cells for GFP, NKX2-1, and DAPI. The analysis was carried out 28 days after injection of cells. Representative GFP and NKX2-1 co-expressing cells are indicated by arrows in the Merge panel.
<b>FIG. 5.</b>
FIG. 5.
RNA seq analysis. (A) Dendrogram using total reads per kilobase million from SP1, SP2, MP1, MP2, and SPTL1, and SPTL2. (B) Venn diagram of commonly up- and downregulated genes between SP and SPTL cells compared with MP cells. Commonly upregulated genes include Sca1, while commonly downregulated genes include Tg, Tshr, Tpo, Nkx2-1, Pax8, and Foxe1 mRNAs. (C) Signal transduction pathways altered in SP and SPTL cells compared with MP cells were plotted based on –log10 p-values. Red bars are upregulated pathways, while green bars are downregulated pathways. The TGF-β and SMAD pathways (highlighted in red) are the two most upregulated pathways, while the integrin pathway (highlighted in green) is the most downregulated pathway. The cadherin pathway (CDH1, highlighted in blue) is both up- and downregulated. (D) Several genes in the cadherin pathways are plotted based on fold changes for SP/SPTL cells versus MP cells. (E) qRT-PCR analysis of several commonly up- and downregulated mRNAs using RNA isolated from MP, SP, and SPTL cells. The values obtained with the MP was set as 1. Mean ± SD in triplicate experiments are shown. Statistical significance between MP versus SP, or MP versus SPTL by unpaired t-test. *p < 0.05; **p < 0.005; ***p < 0.0005; ****p < 0.0001; NS, not significant.
<b>FIG. 6.</b>
FIG. 6.
Venn diagram showing the similarity of SP/SPTL cells to anaplastic thyroid carcinoma (ATC) in gene-expression patterns. Data on ATC gene-expression patterns are from Hebrant et al. (35). Commonly up- and downregulated genes between SP/SPTL cells, ATC, and/or papillary thyroid carcinoma are shown.
<b>FIG. 7.</b>
FIG. 7.
Two-step process of thyroid folliculogenesis. Thyroid follicle formation requires NKX2-1 expression, while the expression of PAX8 is required for the follicle to become functional, resulting in the expression of many thyroid differentiation marker genes and eventual thyroid hormone synthesis.

Similar articles

Cited by

References

    1. Zhang Y, Xu L, Wang S, Cai C, Yan L. 2014. Concise review: differentiation of human adult stem cells into hepatocyte-like cells in vitro. Int J Stem Cells 7:49–54 - PMC - PubMed
    1. Aggarwal S, Moggio A, Bussolati B. 2013. Concise review: stem/progenitor cells for renal tissue repair: current knowledge and perspectives. Stem Cells Transl Med 2:1011–1019 - PMC - PubMed
    1. Liao SY, Tse HF. 2013. Multipotent (adult) and pluripotent stem cells for heart regeneration: what are the pros and cons? Stem Cell Res Ther 4:151. - PMC - PubMed
    1. Bouwens L, Houbracken I, Mfopou JK. 2013. The use of stem cells for pancreatic regeneration in diabetes mellitus. Nat Rev Endocrinol 9:598–606 - PubMed
    1. Dumont JE, Lamy F, Roger P, Maenhaut C. 1992. Physiological and pathological regulation of thyroid cell proliferation and differentiation by thyrotropin and other factors. Physiol Rev 72:667–697 - PubMed

Publication types

MeSH terms

Substances

LinkOut - more resources