

Assessing in silico the recruitment and functional spectrum of bacterial enzymes from secondary metabolism
- PMID: 28125959
- PMCID: PMC5270213
- DOI: 10.1186/s12862-017-0886-2
Assessing in silico the recruitment and functional spectrum of bacterial enzymes from secondary metabolism
Abstract
Background: Microbes, plants, and fungi synthesize an enormous number of metabolites exhibiting rich chemical diversity. For a high-level classification, metabolism is subdivided into primary (PM) and secondary (SM) metabolism. SM products are often not essential for survival of the organism and it is generally assumed that SM enzymes stem from PM homologs.
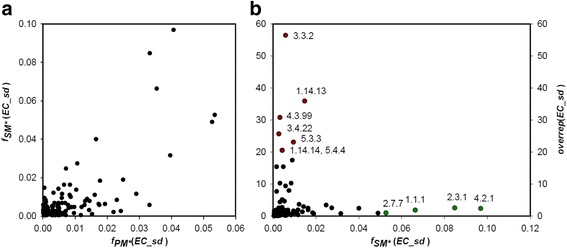
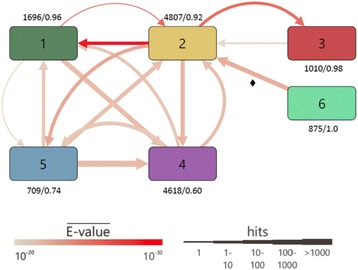
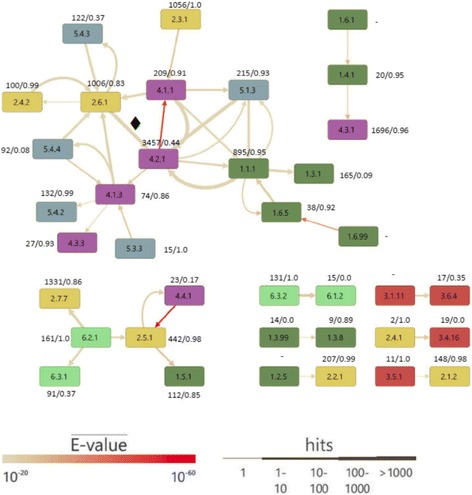
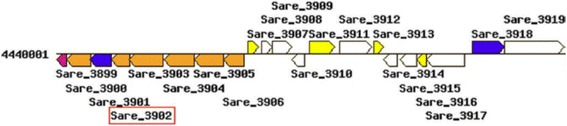
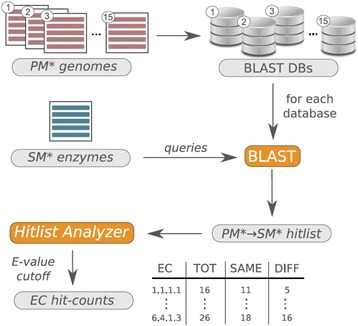
Results: We wanted to assess evolutionary relationships and function of bona fide bacterial PM and SM enzymes. Thus, we analyzed the content of 1010 biosynthetic gene clusters (BGCs) from the MIBiG dataset; the encoded bacterial enzymes served as representatives of SM. The content of 15 bacterial genomes known not to harbor BGCs served as a representation of PM. Enzymes were categorized on their EC number and for these enzyme functions, frequencies were determined. The comparison of PM/SM frequencies indicates a certain preference for hydrolases (EC class 3) and ligases (EC class 6) in PM and of oxidoreductases (EC class 1) and lyases (EC class 4) in SM. Based on BLAST searches, we determined pairs of PM/SM homologs and their functional diversity. Oxidoreductases, transferases (EC class 2), lyases and isomerases (EC class 5) form a tightly interlinked network indicating that many protein folds can accommodate different functions in PM and SM. In contrast, the functional diversity of hydrolases and especially ligases is significantly limited in PM and SM. For the most direct comparison of PM/SM homologs, we restricted for each BGC the search to the content of the genome it comes from. For each homologous hit, the contribution of the genomic neighborhood to metabolic pathways was summarized in BGC-specific html-pages that are interlinked with KEGG; this dataset can be downloaded from https://www.bioinf.ur.de .
Conclusions: Only few reaction chemistries are overrepresented in bacterial SM and at least 55% of the enzymatic functions present in BGCs possess PM homologs. Many SM enzymes arose in PM and Nature utilized the evolvability of enzymes similarly to establish novel functions both in PM and SM. Future work aimed at the elucidation of evolutionary routes that have interconverted a PM enzyme into an SM homolog can profit from our BGC-specific annotations.
Keywords: Enzyme design; Enzyme evolution; Primary metabolism; Secondary metabolism.
Figures
Similar articles
-
Activation of silent biosynthetic pathways and discovery of novel secondary metabolites in actinomycetes by co-culture with mycolic acid-containing bacteria.J Ind Microbiol Biotechnol. 2019 Mar;46(3-4):363-374. doi: 10.1007/s10295-018-2100-y. Epub 2018 Nov 28. J Ind Microbiol Biotechnol. 2019. PMID: 30488365 Review.
-
BGC Atlas: a web resource for exploring the global chemical diversity encoded in bacterial genomes.Nucleic Acids Res. 2025 Jan 6;53(D1):D618-D624. doi: 10.1093/nar/gkae953. Nucleic Acids Res. 2025. PMID: 39470730 Free PMC article.
-
Exploring the enzymatic repertoires of Bacteria and Archaea and their associations with metabolic maps.Braz J Microbiol. 2024 Dec;55(4):3147-3157. doi: 10.1007/s42770-024-01462-3. Epub 2024 Jul 25. Braz J Microbiol. 2024. PMID: 39052173 Free PMC article.
-
Enzyme nomenclature and classification: the state of the art.FEBS J. 2023 May;290(9):2214-2231. doi: 10.1111/febs.16274. Epub 2022 Jan 3. FEBS J. 2023. PMID: 34773359 Review.
-
Transcription Factor Repurposing Offers Insights into Evolution of Biosynthetic Gene Cluster Regulation.mBio. 2021 Aug 31;12(4):e0139921. doi: 10.1128/mBio.01399-21. Epub 2021 Jul 20. mBio. 2021. PMID: 34281384 Free PMC article.
Cited by
-
Endogenous Enzymes Enable Antimicrobial Activity.ACS Chem Biol. 2021 May 21;16(5):800-805. doi: 10.1021/acschembio.0c00894. Epub 2021 Apr 20. ACS Chem Biol. 2021. PMID: 33877811 Free PMC article.
-
Assessing and utilizing esterase specificity in antimicrobial prodrug development.Methods Enzymol. 2022;664:199-220. doi: 10.1016/bs.mie.2021.11.008. Epub 2021 Dec 23. Methods Enzymol. 2022. PMID: 35331374 Free PMC article.
-
A roadmap for metagenomic enzyme discovery.Nat Prod Rep. 2021 Nov 17;38(11):1994-2023. doi: 10.1039/d1np00006c. Nat Prod Rep. 2021. PMID: 34821235 Free PMC article. Review.
References
-
- Kossel A. Über die chemische Zusammensetzung der Zelle. Du Bois-Reymond’s Archiv/Arch Anat Physiol Physiol Abt. 1891;8:181–89.
-
- Demain AL, Fang A. The natural functions of secondary metabolites. Adv Biochem Eng Biotechnol. 2000;69:1–39. - PubMed
MeSH terms
Substances
LinkOut - more resources
Full Text Sources
Other Literature Sources
Research Materials
