

An inverse association between serum soluble receptor of advanced glycation end products and hyperandrogenism and potential implication in polycystic ovary syndrome patients
- PMID: 28125989
- PMCID: PMC5270251
- DOI: 10.1186/s12958-017-0227-8
An inverse association between serum soluble receptor of advanced glycation end products and hyperandrogenism and potential implication in polycystic ovary syndrome patients
Abstract
Background: Studies found that AGE-RAGE system is closely related to insulin resistance and hyperandrogenemia, which are two core pathophysiological processes in polycystic ovary syndrome (PCOS). This study is to investigate the relationship among advanced glycation end-products/soluble receptor of advanced glycation end-products (AGEs/sRAGE) and anthropometric evaluation, homeostatic model assessment-insulin resistance (HOMA-IR), free androgen index (FAI) in reproductive-aged PCOS patients.
Methods: One hundred and forty-eight Chinese women with PCOS were enrolled in this study. Subgroups were divided according to body mass index (BMI), waist circumference (WC), quartile intervals of HOMA-IR and androgen levels. The relationships between AGEs/sRAGE and above clinical markers were assessed by Pearson's correlation analyses.
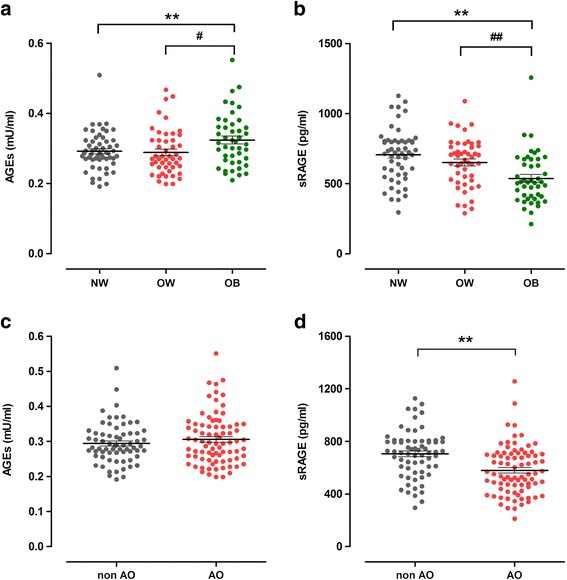
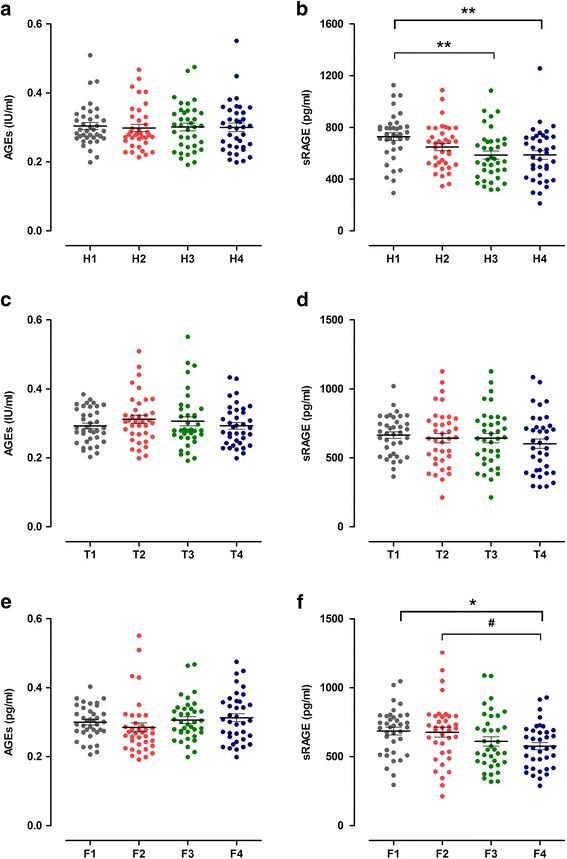
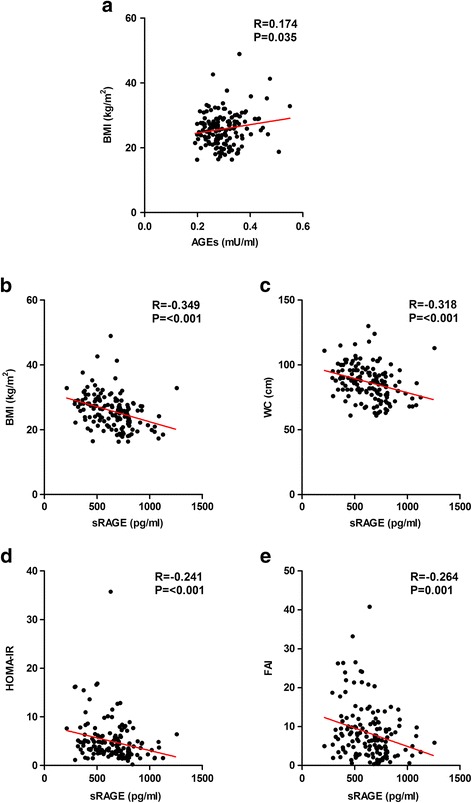
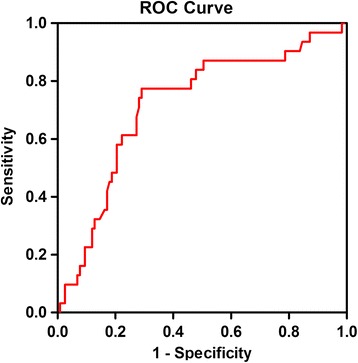
Results: Serum AGEs showed a gradually increased tendency with BMI and WC. It reached statistical significant between the normal weight group (BMI < 24 kg/m2) and the obesity group (BMI ≥ 28 kg/m2) . The sRAGE levels gradually decreased with increasing BMI, WC, HOMA-IR and FAI respectively. Furthermore, the differences between each group were statistical significant. The correlation analysis showed a positive correlation between BMI and serum AGEs levels. On the contrary, the sRAGE levels showed significantly inverse correlations with BMI, WC, HOMA-IR and FAI. The optimal point of sRAGE for the presence of insulin resistance was 704.097 pg/ml by ROC curve analysis.
Conclusions: Along with the body fat accumulation, the serum levels of AGEs were increased, whereas, the serum levels of sRAGE were reduced in obese PCOS patients. The serum levels of sRAGE, which is a decoy receptor, dramatically decreased in the patients with more severe insulin resistant states and higher FAI, which might be a potential biomarker and a promising therapeutic target in the treatment of PCOS, especially in obese subjects.
Keywords: AGEs; Hyperandrogenism; Insulin resistance; Obesity; PCOS; sRAGE.
Figures
Similar articles
-
[Clinical features, hormonal profile, and metabolic abnormalities of obese women with obese polycystic ovary syndrome].Zhonghua Yi Xue Za Zhi. 2005 Dec 7;85(46):3266-71. Zhonghua Yi Xue Za Zhi. 2005. PMID: 16409817 Chinese.
-
Effect of long-term orlistat treatment on serum levels of advanced glycation end-products in women with polycystic ovary syndrome.Clin Endocrinol (Oxf). 2007 Jan;66(1):103-9. doi: 10.1111/j.1365-2265.2006.02693.x. Clin Endocrinol (Oxf). 2007. PMID: 17201808 Clinical Trial.
-
Are plasma levels of visfatin and retinol-binding protein 4 (RBP4) associated with body mass, metabolic and hormonal disturbances in women with polycystic ovary syndrome?Eur J Obstet Gynecol Reprod Biol. 2012 May;162(1):55-61. doi: 10.1016/j.ejogrb.2012.01.026. Epub 2012 Mar 6. Eur J Obstet Gynecol Reprod Biol. 2012. PMID: 22397743
-
Advanced Glycation End Products: Link between Diet and Ovulatory Dysfunction in PCOS?Nutrients. 2015 Dec 4;7(12):10129-44. doi: 10.3390/nu7125524. Nutrients. 2015. PMID: 26690206 Free PMC article. Review.
-
The efficacy and safety of GLP-1 agonists in PCOS women living with obesity in promoting weight loss and hormonal regulation: A meta-analysis of randomized controlled trials.J Diabetes Complications. 2024 Oct;38(10):108834. doi: 10.1016/j.jdiacomp.2024.108834. Epub 2024 Aug 20. J Diabetes Complications. 2024. PMID: 39178623
Cited by
-
Advanced Glycation End Products (AGEs) May Be a Striking Link Between Modern Diet and Health.Biomolecules. 2019 Dec 17;9(12):888. doi: 10.3390/biom9120888. Biomolecules. 2019. PMID: 31861217 Free PMC article. Review.
-
Are Dietary and Serum Advanced Glycation End Products (AGEs) Potential Contributors to Inflammation in Women with Polycystic Ovary Syndrome?J Clin Med. 2025 Aug 16;14(16):5803. doi: 10.3390/jcm14165803. J Clin Med. 2025. PMID: 40869631 Free PMC article.
-
Comparison of Androgen Levels, Endocrine and Metabolic Indices, and Clinical Findings in Women with Polycystic Ovary Syndrome in Uygur and Han Ethnic Groups from Xinjiang Province in China.Med Sci Monit. 2018 Sep 25;24:6774-6780. doi: 10.12659/MSM.909715. Med Sci Monit. 2018. PMID: 30252834 Free PMC article.
-
Advanced glycation end-products and its soluble receptor are not independent predictors of incident dysglycaemia or metabolic syndrome in women with polycystic ovary syndrome: a prospective observational study.Reprod Biol Endocrinol. 2023 May 10;21(1):41. doi: 10.1186/s12958-023-01093-7. Reprod Biol Endocrinol. 2023. PMID: 37165411 Free PMC article.
-
Diane-35 and metformin therapy in rats with endometrial lesions induced by dihydrotestosterone exposure.Ann Transl Med. 2023 Mar 31;11(6):247. doi: 10.21037/atm-21-2441. Epub 2023 Feb 2. Ann Transl Med. 2023. PMID: 37082665 Free PMC article.
References
-
- Dunaif A. Insulin resistance and the polycystic ovary syndrome: mechanism and implications for pathogenesis. Endocr Rev. 1997;18:774–800. - PubMed
MeSH terms
Substances
LinkOut - more resources
Full Text Sources
Other Literature Sources
Medical
