

Serology reveals heterogeneity of Plasmodium falciparum transmission in northeastern South Africa: implications for malaria elimination
- PMID: 28126001
- PMCID: PMC5270351
- DOI: 10.1186/s12936-017-1701-7
Serology reveals heterogeneity of Plasmodium falciparum transmission in northeastern South Africa: implications for malaria elimination
Abstract
Background: It is widely acknowledged that modifications to existing control interventions are required if South Africa is to achieve malaria elimination. Targeting indoor residual spraying (IRS) to areas where cases have been detected is one strategy currently under investigation in northeastern South Africa. This seroprevalence baseline study, nested within a targeted IRS trial, was undertaken to provide insights into malaria transmission dynamics in South Africa and evaluate whether sero-epidemiological practices have the potential to be routinely incorporated into elimination programmes.
Methods: Filter-paper blood spots, demographic and household survey data were collected from 2710 randomly selected households in 56 study wards located in the municipalities of Ba-Phalaborwa and Bushbuckridge. Blood spots were assayed for Plasmodium falciparum apical membrane antigen-1 and merozoite surface protein-119 blood-stage antigens using an enzyme linked immunosorbent assay. Seroprevalence data were analysed using a reverse catalytic model to determine malaria seroconversion rates (SCR). Geospatial cluster analysis was used to investigate transmission heterogeneity while random effects logistic regression identified risk factors associated with malaria exposure.
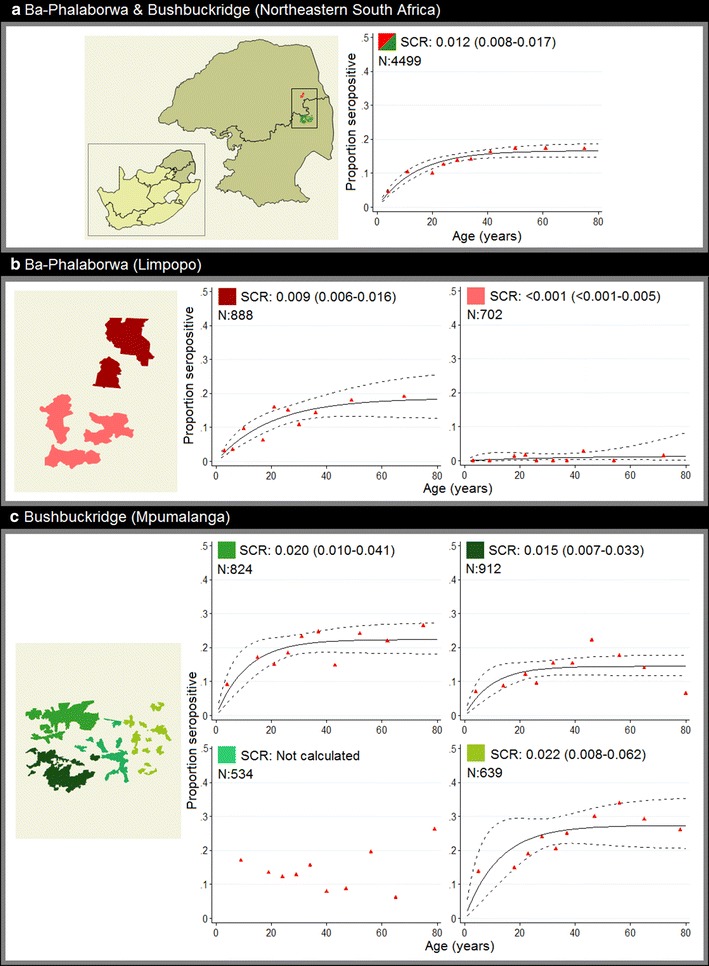
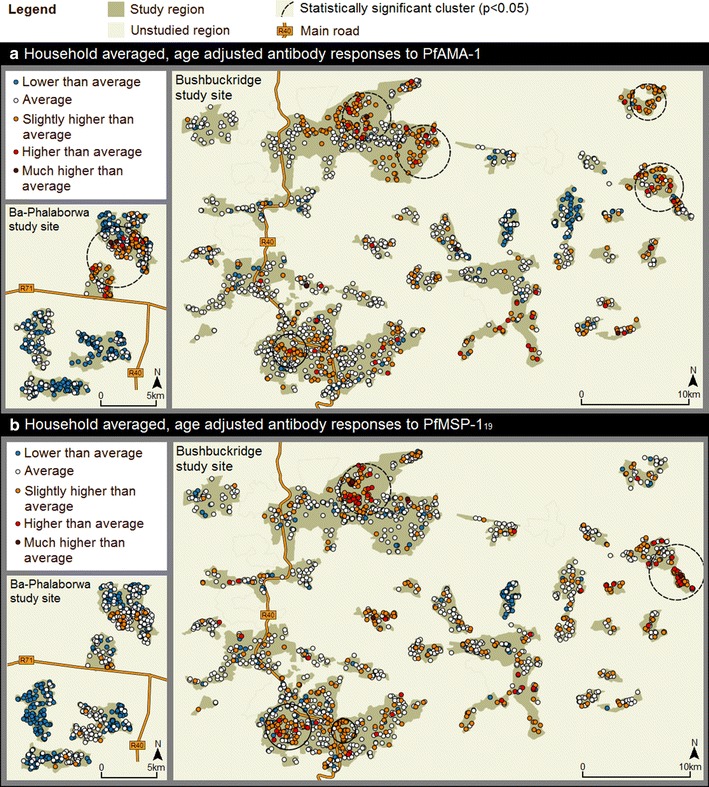
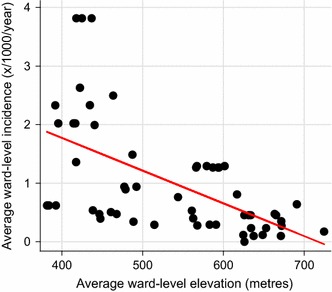
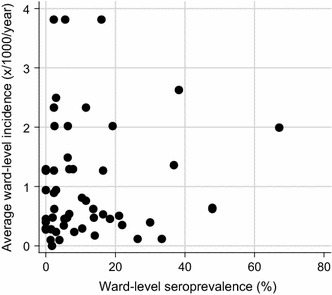
Results: The overall SCR across the entire study site was 0.012 (95% CI 0.008-0.017) per year. Contrasting SCRs, corresponding to distinct geographical regions across the study site, ranging from <0.001 (95% CI <0.001-0.005) to 0.022 (95% CI 0.008-0.062) per annum revealed prominent transmission heterogeneity. Geospatial cluster analysis of household seroprevalence and age-adjusted antibody responses detected statistically significant (p < 0.05) spatial clusters of P. falciparum exposure. Formal secondary education was associated with lower malaria exposure in the sampled population (AOR 0.72, 95% CI 0.56-0.95, p = 0.018).
Conclusions: Although overall transmission intensity and exposure to malaria was low across both study sites, malaria transmission intensity was highly heterogeneous and associated with low socio-economic status in the region. Findings suggest focal targeting of interventions has the potential to be an appropriate strategy to deploy in South Africa. Furthermore, routinely incorporating sero-epidemiological practices into elimination programmes may prove useful in monitoring malaria transmission intensity in South Africa, and other countries striving for malaria elimination.
Keywords: Elimination; Heterogeneity; Hotspot; Malaria; PfAMA-1; PfMSP-119; Serology; South Africa; Transmission.
Figures


References
-
- WHO. Malaria elimination: a field manual for low and moderate endemic countries. Geneva: World Health Organization; 2007. http://apps.who.int/iris/bitstream/10665/43796/1/9789241596084_eng.pdf. Accessed 20 July 2016.
-
- South Africa National Department of Health. Malaria elimination strategy for South Africa 2012–2018, Pretoria: NDoH; 2012 http://www.ccoat.uct.ac.za/sites/default/files/image_tool/images/229/SA%.... Accessed 17 July 2016.
-
- Rosas-Aguirre A, Speybroeck N, Llanos-Cuentas A, Rosanas-Urgell A, Carrasco-Escobar G, Rodriguez H, et al. Hotspots of malaria transmission in the Peruvian amazon: rapid assessment through a parasitological and serological survey. PLoS ONE. 2015;10:e0137458. doi: 10.1371/journal.pone.0137458. - DOI - PMC - PubMed
Publication types
MeSH terms
Grants and funding
LinkOut - more resources
Full Text Sources
Other Literature Sources
Molecular Biology Databases
Research Materials
