Review
. 2017 Jan 26;12(1):28.
doi: 10.1186/s13014-016-0747-y.

A review of substitute CT generation for MRI-only radiation therapy

Affiliations
Review

A review of substitute CT generation for MRI-only radiation therapy

Jens M Edmund et al. Radiat Oncol. .

Abstract

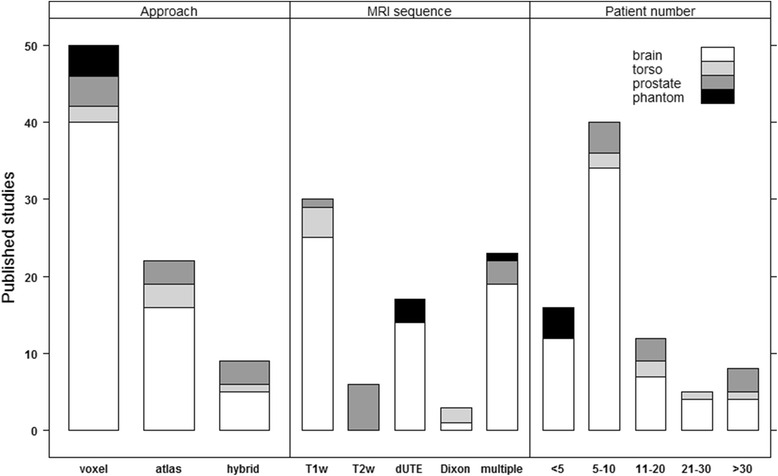
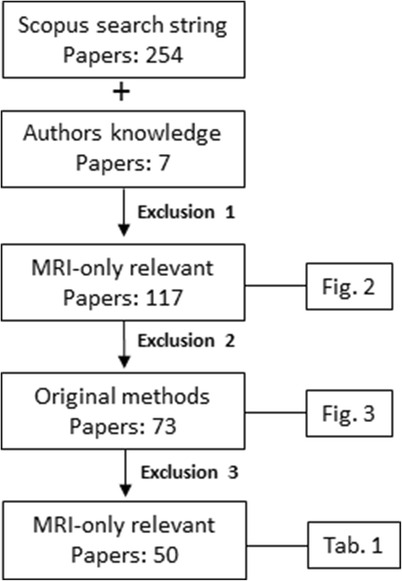
Radiotherapy based on magnetic resonance imaging as the sole modality (MRI-only RT) is an area of growing scientific interest due to the increasing use of MRI for both target and normal tissue delineation and the development of MR based delivery systems. One major issue in MRI-only RT is the assignment of electron densities (ED) to MRI scans for dose calculation and a similar need for attenuation correction can be found for hybrid PET/MR systems. The ED assigned MRI scan is here named a substitute CT (sCT). In this review, we report on a collection of typical performance values for a number of main approaches encountered in the literature for sCT generation as compared to CT. A literature search in the Scopus database resulted in 254 papers which were included in this investigation. A final number of 50 contributions which fulfilled all inclusion criteria were categorized according to applied method, MRI sequence/contrast involved, number of subjects included and anatomical site investigated. The latter included brain, torso, prostate and phantoms. The contributions geometric and/or dosimetric performance metrics were also noted. The majority of studies are carried out on the brain for 5-10 patients with PET/MR applications in mind using a voxel based method. T1 weighted images are most commonly applied. The overall dosimetric agreement is in the order of 0.3-2.5%. A strict gamma criterion of 1% and 1mm has a range of passing rates from 68 to 94% while less strict criteria show pass rates > 98%. The mean absolute error (MAE) is between 80 and 200 HU for the brain and around 40 HU for the prostate. The Dice score for bone is between 0.5 and 0.95. The specificity and sensitivity is reported in the upper 80s% for both quantities and correctly classified voxels average around 84%. The review shows that a variety of promising approaches exist that seem clinical acceptable even with standard clinical MRI sequences. A consistent reference frame for method benchmarking is probably necessary to move the field further towards a widespread clinical implementation.


Figures

Fig. 1
Fig. 1
Variability of multiple registrations between MRI and the corresponding CT for prostate (top) and nasopharynx (bottom). a: One marker (of three) indicated by a white circle on the axial MRI. b: Two markers shown by the white dots on the sagittal CT. The multiple thin white lines are the MRI delineated clinical target volume (CTV) transferred to the CT based on the marker registration following department protocol from 7 different observers. The protocol is based on a rigid automatic (mutual information) registration for a limited FOV around the prostate followed by a manual adjustment to match the markers in the three planes. The outermost white line was the planned target volume (PTV) applied. The data are taken from reference [59]. c: The gross target volume (inner) and CTV (outer) as delineated on the axial MRI. d: The multiple thin white lines are the MRI based CTV transferred to the CT by 6 different observers (sagital CT slice shown). The registration is based on a rigid automatic (mutual information) registration followed by a manual fine adjustment. The outermost white line was again the applied PTV. The data are taken from reference [60]
Fig. 2
Fig. 2
The number of articles versus time after applying the search string and exclusion criterion 1 provided in the text. The publications are grouped into proposed applications of the described method and sorted according to publication year. A boost in the amount of publications can be inspected around 2010 (PET/MRI) and 2013-14 (MRI guided EBRT)
Fig. 3
Fig. 3
Categorization of contributions after applying exclusion criterion 2. The papers were sorted according to their main method (left), used MRI sequences/contrasts (middle) and number of subjects, i.e. phantom, patients or volunteers (right). In the above categories, the following simplifications were made: head = brain, whole body = torso, cervix = prostate (only 1 study), UTE = dUTE, and water/fat separating MRI sequences = Dixon. Volunteers and phantoms were categorized as patients. Some papers included description of multiple methods which were included in the histograms as separate studies, hence the term “published studies” for the ordinate
Fig. 4
Fig. 4
The adopted strategy for inclusion of papers with reported metrics in this review
Fig. 5
Fig. 5
Examples of sCT generation for the pelvic (top) and brain (bottom). a: An axial CT slice of the pelvic from a prostate patient. b: The corresponding sCT slice created with an atlas patch based approach [49]. c: An axial CT slice of a brain patient. d: The corresponding sCT slice created with a voxel Gaussian mixture regression based approach [75]
Fig. 6
Fig. 6
Performance metrics dependence on the region of interest and CT threshold number for the bone. All metrics are calculated on substitute CTs from 3D T1w MR images of 6 brain patients [47] using an atlas patch based method [48]. a: The boxplot shows the MAE within the body outline (left) and the whole field of view (FOV, right). The medians were 87 and 49 HU for the body and FOV MAE, respectively, and were significantly different (p < 0.002). b: The Dice similarity coefficient (DSC) metric for bone as a function of threshold CT number. c: Receiver operating characteristic (ROC) curve of the sCT bone as a function of CT threshold number (thres). True positive (TP) = sCT > thres & CT > thres, false positive (FP) = sCT > thres & CT < thres, true negative (TN) = sCT < thres & CT < thres and false negative (FN) = sCT < thres & CT > thres. Sensitivity = TP/(TP + FN) and specificity = TN/(TN + FP). The threshold was varied from 100 (right) to 3000 (left) HU in steps of 100 HU. Only voxels > 100 HU on the CT, i.e. the bone region, was included in the evaluation to keep the TN number (non-bone tissue on the sCT and CT) to a reasonable number

References

    1. Beavis AW, Gibbs P, Dealey RA, Whitton VJ. Radiotherapy treatment planning of brain tumours using MRI alone. Br J Radiol. 1998;71:544–548. doi: 10.1259/bjr.71.845.9691900. - DOI - PubMed
    1. Chen LL, Price RA, Wang L, Li JS, Qin LH, McNeeley S, Ma CMC, Freedman GM, Pollack A. MRI-based treatment planning for radiotherapy: Dosimetric verification for prostate IMRT. Int J Radiat Oncol Biol Phys. 2004;60:636–647. doi: 10.1016/S0360-3016(04)00960-5. - DOI - PubMed
    1. Rasch C, Steenbakkers R, van Herk M. Target definition in prostate, head, and neck. Semin Radiat Oncol. 2005;15:136–145. doi: 10.1016/j.semradonc.2005.01.005. - DOI - PubMed
    1. Prabhakar R, Haresh KP, Ganesh T, Joshi RC, Julka PK, Rath GK. Comparison of computed tomography and magnetic resonance based target volume in brain tumors. J Cancer Res Ther. 2007;3:121. doi: 10.4103/0973-1482.34694. - DOI - PubMed
    1. Fiorentino A, Caivano R, Pedicini P, Fusco V. Clinical target volume definition for glioblastoma radiotherapy planning: magnetic resonance imaging and computed tomography. Clin Transl Oncol. 2013;15:754–758. doi: 10.1007/s12094-012-0992-y. - DOI - PubMed

MeSH terms