. 2017 Jan 26;18(1):18.
doi: 10.1186/s13059-017-1156-8.

Genome-wide analysis of differential transcriptional and epigenetic variability across human immune cell types

Collaborators, Affiliations

Genome-wide analysis of differential transcriptional and epigenetic variability across human immune cell types

Simone Ecker et al. Genome Biol. .

Abstract

Background: A healthy immune system requires immune cells that adapt rapidly to environmental challenges. This phenotypic plasticity can be mediated by transcriptional and epigenetic variability.

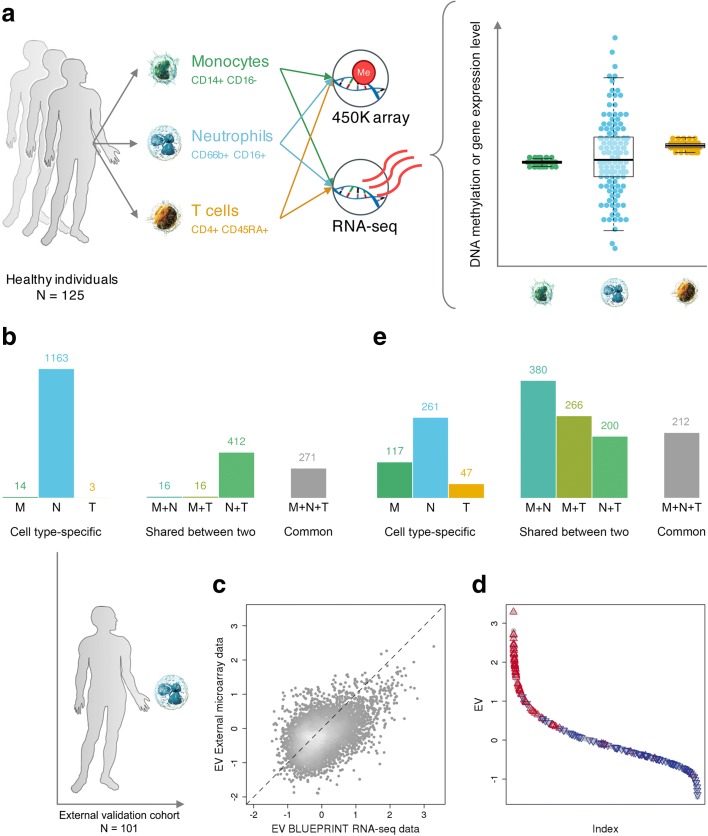
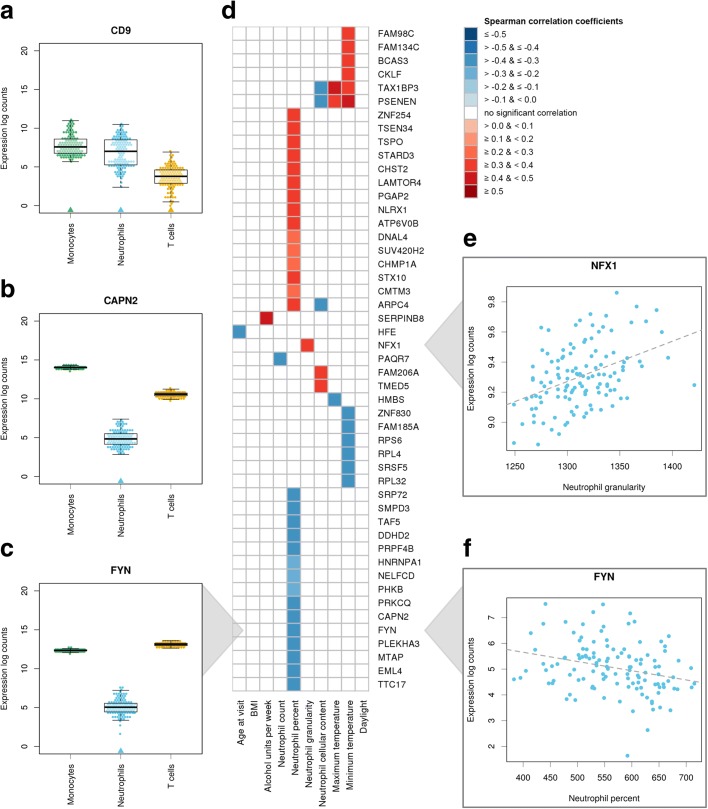
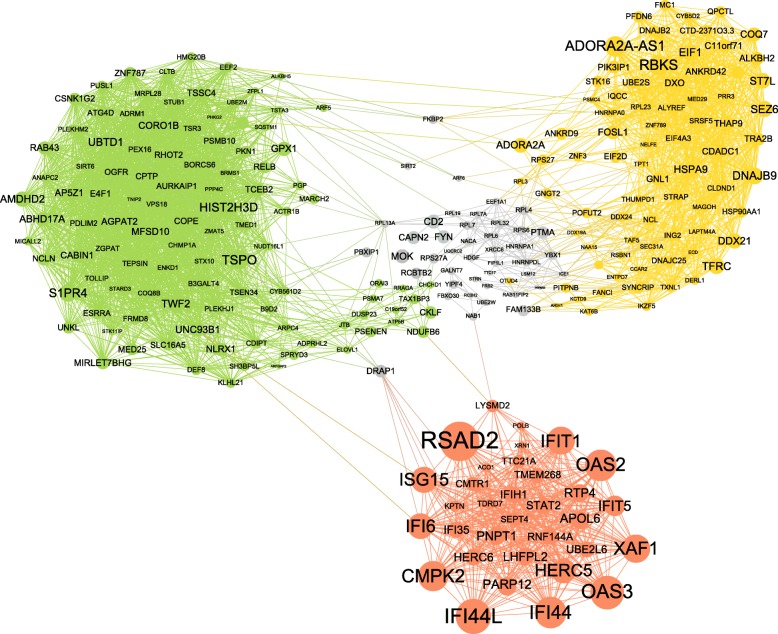
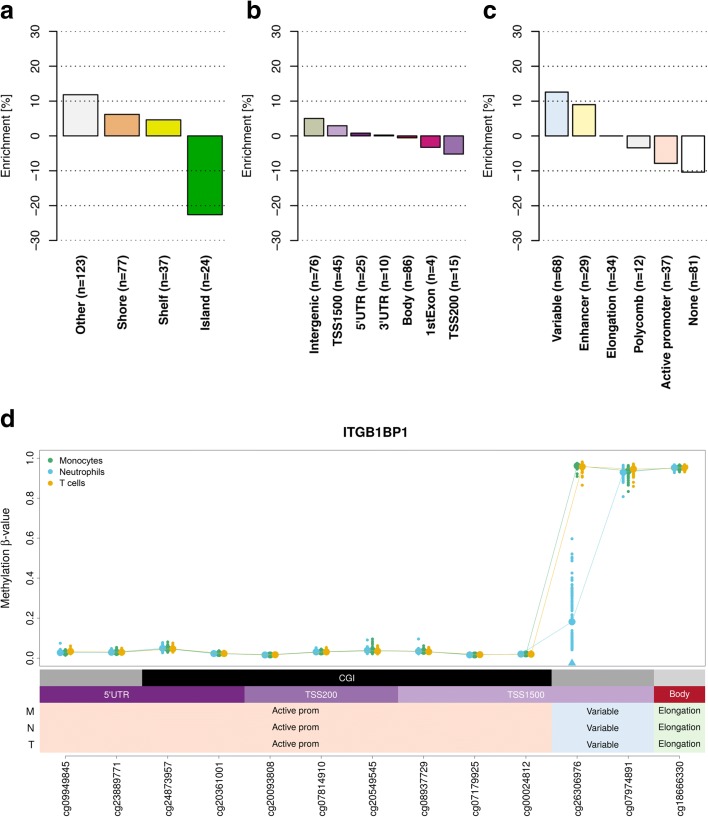
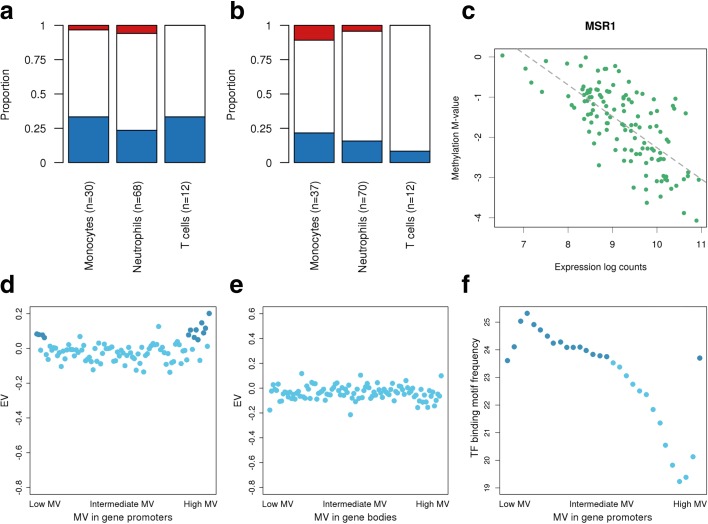
Results: We apply a novel analytical approach to measure and compare transcriptional and epigenetic variability genome-wide across CD14+CD16- monocytes, CD66b+CD16+ neutrophils, and CD4+CD45RA+ naïve T cells from the same 125 healthy individuals. We discover substantially increased variability in neutrophils compared to monocytes and T cells. In neutrophils, genes with hypervariable expression are found to be implicated in key immune pathways and are associated with cellular properties and environmental exposure. We also observe increased sex-specific gene expression differences in neutrophils. Neutrophil-specific DNA methylation hypervariable sites are enriched at dynamic chromatin regions and active enhancers.

Conclusions: Our data highlight the importance of transcriptional and epigenetic variability for the key role of neutrophils as the first responders to inflammatory stimuli. We provide a resource to enable further functional studies into the plasticity of immune cells, which can be accessed from: http://blueprint-dev.bioinfo.cnio.es/WP10/hypervariability .

Keywords: DNA methylation; Differential variability; Gene expression; Heterogeneity; Immune cells; Monocytes; Neutrophils; Phenotypic plasticity; T cells.


Figures

Fig. 1
Fig. 1
Differential variability of gene expression and DNA methylation across three immune cell types. a Study design and analytical approach. Hypervariable genes and CpGs were identified using a combined statistical approach at stringent significance thresholds, i.e., Benjamini–Hochberg-corrected P < 0.05 and gene expression or DNA methylation variability measurement (EV or MV) difference ≥10% relative to the observed range. b The number of statistically significant hypervariable genes (HVGs) that are cell type-specific, shared between two of the studied immune cell types, or common to all three. c Scatter plot of the EV values of 6138 genes assessed in our data set versus the replication set. We found good concordance between the two independent cohorts, despite the application of different analytical platforms (Pearson’s r = 0.48, P < 2.2 × 10−16). d Ranking of all 11,980 protein-coding genes analyzed in our study according to EV values (i.e., from high to low EV values). We highlight the 100 genes that showed the highest and lowest EV values in the independent replication data set in red and blue, respectively. e The number of hypervariable CpG positions (HVPs). Abbreviations: M monocytes, N neutrophils, T naïve T cells
Fig. 2
Fig. 2
Characterization of cell type-specific hypervariable genes. ac Increased expression variability of the genes CD9, CAPN2, and FYN across three immune cell types. For each cell type, data points represent the expression values of the indicated gene in one individual. Cell types marked by an arrowhead were found to show significantly increased variability compared to the other two cell types. While CD9 was found to be hypervariable in all three cell types, CAPN2 and FYN show increased variability only in neutrophils, if contrasted to monocytes and T cells. d Heatmap of Spearman’s correlation coefficients showing neutrophil-specific HVGs that associated with various donor-specific quantitative traits. A total of 49 genes with increased inter-individual variability showed a significant association with at least one of the measured traits (Benjamini–Hochberg-corrected P < 0.05, Spearman’s rank correlation). e NFX1 gene expression levels versus neutrophil granularity. f FYN gene expression levels versus neutrophil percentage. BMI body mass index
Fig. 3
Fig. 3
Gene network and pathway analysis of neutrophil-specific HVGs not mediated by cis genetic effects. Co-expression network of neutrophil-specific HVGs that did not correlate with genetic variants in cis, as reported in the BLUEPRINT Human Variation Panel. We identified three gene modules, shown in green, yellow, and red. These modules were highly enriched for important biological functions in immune cells (Additional file 5). Nodes represent genes and edges represent correlations in these genes’ expression values. Node sizes are determined by expression variability of the corresponding gene, with bigger nodes indicating higher EV values. Nodes colored in gray belong to several smaller gene clusters connecting the three main clusters of the network
Fig. 4
Fig. 4
Functional annotation of neutrophil-specific hypervariable CpG positions. a Enrichment of neutrophil-specific HVPs (n = 261) at genomic features. We found neutrophil-specific HVPs to be depleted at CpG islands (P = 6.37 × 10−19, hypergeometric test). b Enrichment of neutrophil-specific HVPs at gene elements. Neutrophil-specific HVPs were enriched at intergenic regions (P = 0.03). c Enrichment of neutrophil-specific HVPs at distinct reference chromatin states in neutrophils. The HVPs were enriched at enhancer (P = 1.32 × 10−12) and “variable” (P = 3.81 × 10−8) chromatin states. A variable chromatin state denotes a state that was observed in less than 80% of the biological replicates (n ≥ 5) within a given cell type and indicates dynamic changes of local chromatin structure. d Regional plot of an exemplar neutrophil-specific HVP mapping to the promoter of the ITGB1BP1 gene, encoding the integrin beta 1 binding protein 1. The statistically significant HVP is indicated with an arrowhead. For each cell type, data points represent the DNA methylation β values (y-axis) at the indicated CpGs (x-axis) in one individual. For each CpG site, we calculated the mean DNA methylation value (indicated with a larger data point). Every CpG site is annotated with regards to genomic feature, gene element, and chromatin state. Abbreviations: M monocytes, N neutrophils, T naïve T cells, TSS transcription start site, CGI CpG island, UTR untranslated region, prom promoter
Fig. 5
Fig. 5
Relationship between DNA methylation and gene expression. a The proportion of cell type-specific HVPs that map to gene promoters and are positively (red), negatively (blue), or not (white) associated with gene expression levels at Benjamini–Hochberg-corrected P < 0.05 (Spearman’s rank correlation). We found that around one-third of these HVPs (30.1%; range 23.5–33.3%) are negatively correlated with gene expression. b Same as panel a but for HVPs that map to gene bodies. c The negative correlation of MSR1 promoter DNA methylation with gene expression in monocytes (r = −0.70, P < 2.2 × 10−16; Spearman’s rank correlation). d Correlation between DNA methylation variability (MV) and gene expression variability at gene promoters in neutrophils. First, gene-wise MV values were calculated. Then, the values were ordered from low to high MV value, grouped together in bins of 100 genes, and plotted against the EV values, maintaining the ordering by MV values. This binning strategy was applied to reduce the complexity of the data. HVPs at gene promoters were defined as CpG sites annotated to TSS1500, TSS200, 5′ UTR, and first exon, according to the Illumina 450 K array annotation manifest. Darker data points indicate the subset of bins that is further discussed in the “Results” section. e Same as panel d but for HVPs that map to gene bodies. HVPs at gene bodies were defined as CpGs annotated to body and 3′ UTR, according to the 450 K array annotation manifest. f The number of consensus transcription factor (TF) binding motifs at promoter regions versus MV values in neutrophils. Promoter regions were defined as ±500 bp around the transcription start site. Darker data points indicate the subset of bins that is further discussed in the “Results” section

References

    1. Yosef N, Regev A. Writ large: Genomic Dissection of the Effect of Cellular Environment on Immune Response. Science. 2016;354:64–8. doi: 10.1126/science.aaf5453. - DOI - PMC - PubMed
    1. Elowitz MB, Levine AJ, Siggia ED, Swain PS. Stochastic gene expression in a single cell. Science. 2002;297:1183–6. doi: 10.1126/science.1070919. - DOI - PubMed
    1. Lehner B, Kaneko K. Fluctuation and response in biology. Cell Mol Life Sci. 2011;68:1005–10. doi: 10.1007/s00018-010-0589-y. - DOI - PMC - PubMed
    1. Raser JM, O’Shea EK. Noise in gene expression: origins, consequences, and control. Science. 2005;309:2010–3. doi: 10.1126/science.1105891. - DOI - PMC - PubMed
    1. Snijder B, Pelkmans L. Origins of regulated cell-to-cell variability. Nat Rev Mol Cell Biol. 2011;12:119–25. doi: 10.1038/nrm3044. - DOI - PubMed

Publication types