

Enhanced Risk Aversion, But Not Loss Aversion, in Unmedicated Pathological Anxiety
- PMID: 28126210
- PMCID: PMC5466268
- DOI: 10.1016/j.biopsych.2016.12.010
Enhanced Risk Aversion, But Not Loss Aversion, in Unmedicated Pathological Anxiety
Abstract
Background: Anxiety disorders are associated with disruptions in both emotional processing and decision making. As a result, anxious individuals often make decisions that favor harm avoidance. However, this bias could be driven by enhanced aversion to uncertainty about the decision outcome (e.g., risk) or aversion to negative outcomes (e.g., loss). Distinguishing between these possibilities may provide a better cognitive understanding of anxiety disorders and hence inform treatment strategies.
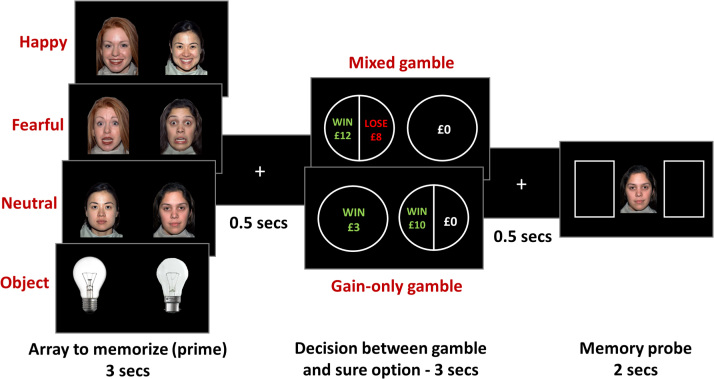
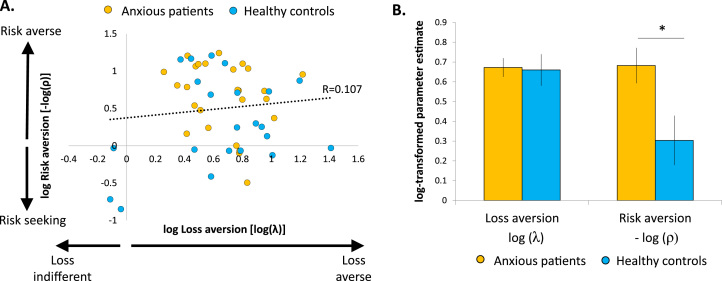
Methods: To address this question, unmedicated individuals with pathological anxiety (n = 25) and matched healthy control subjects (n = 23) completed a gambling task featuring a decision between a gamble and a safe (certain) option on every trial. Choices on one type of gamble-involving weighing a potential win against a potential loss (mixed)-could be driven by both loss and risk aversion, whereas choices on the other type-featuring only wins (gain only)-were exclusively driven by risk aversion. By fitting a computational prospect theory model to participants' choices, we were able to reliably estimate risk and loss aversion and their respective contribution to gambling decisions.
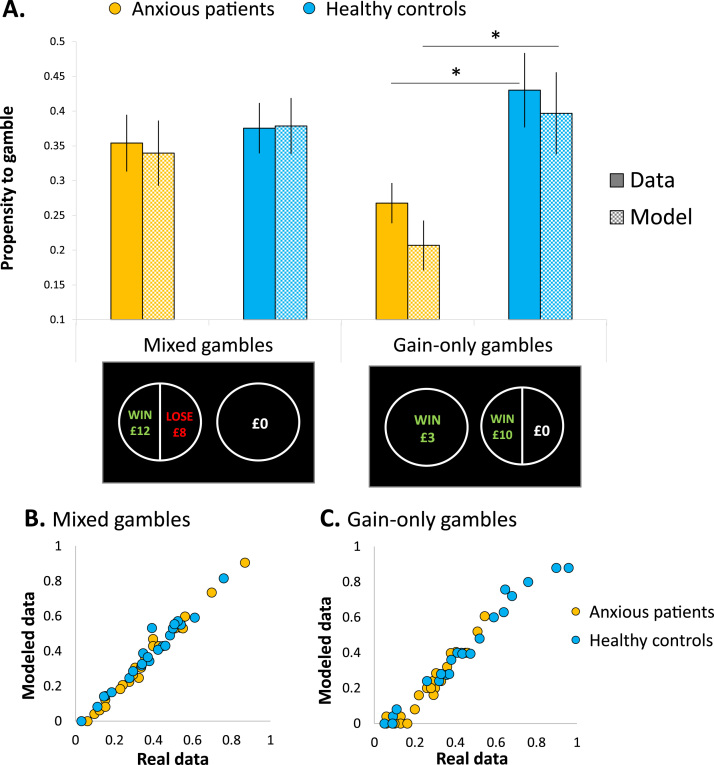
Results: Relative to healthy control subjects, pathologically anxious participants exhibited enhanced risk aversion but equivalent levels of loss aversion.
Conclusions: Individuals with pathological anxiety demonstrate clear avoidance biases in their decision making. These findings suggest that this may be driven by a reduced propensity to take risks rather than a stronger aversion to losses. This important clarification suggests that psychological interventions for anxiety should focus on reducing risk sensitivity rather than reducing sensitivity to negative outcomes per se.
Keywords: Anxiety; Decision making; Emotion; Loss aversion; Memory; Risk aversion.
Copyright © 2017 Society of Biological Psychiatry. Published by Elsevier Inc. All rights reserved.
Figures
Comment in
-
The Behavioral Economics of Anxiety.Biol Psychiatry. 2017 Jun 15;81(12):974-976. doi: 10.1016/j.biopsych.2017.04.007. Biol Psychiatry. 2017. PMID: 28554389 No abstract available.
References
-
- Beddington J., Cooper C.L., Goswami U., Huppert F.A., Jenkins R., Jones H.S. The mental wealth of nations. Nature. 2008;455:1057–1059. - PubMed
-
- Butler G., Mathews A. Cognitive processes in anxiety. Adv Behav Res Ther. 1983;5:51–62.
-
- Giorgetta C., Grecucci A., Zuanon S., Perini L., Balestrieri M., Bonini N. Reduced risk-taking behavior as a trait feature of anxiety. Emotion. 2012;12:1373–1383. - PubMed
Publication types
MeSH terms
Grants and funding
LinkOut - more resources
Full Text Sources
Other Literature Sources
Medical
Research Materials
Miscellaneous
