. 2017 Apr;16(4):694-705.
doi: 10.1074/mcp.O116.065136. Epub 2017 Jan 26.

Loss-less Nano-fractionator for High Sensitivity, High Coverage Proteomics

Affiliations

Loss-less Nano-fractionator for High Sensitivity, High Coverage Proteomics

Nils A Kulak et al. Mol Cell Proteomics. 2017 Apr.

Abstract

Recent advances in mass spectrometry (MS)-based proteomics now allow very deep coverage of cellular proteomes. To achieve near-comprehensive identification and quantification, the combination of a first HPLC-based peptide fractionation orthogonal to the on-line LC-MS/MS step has proven to be particularly powerful. This first dimension is typically performed with milliliter/min flow and relatively large column inner diameters, which allow efficient pre-fractionation but typically require peptide amounts in the milligram range. Here, we describe a novel approach termed "spider fractionator" in which the post-column flow of a nanobore chromatography system enters an eight-port flow-selector rotor valve. The valve switches the flow into different flow channels at constant time intervals, such as every 90 s. Each flow channel collects the fractions into autosampler vials of the LC-MS/MS system. Employing a freely configurable collection mechanism, samples are concatenated in a loss-less manner into 2-96 fractions, with efficient peak separation. The combination of eight fractions with 100 min gradients yields very deep coverage at reasonable measurement time, and other parameters can be chosen for even more rapid or for extremely deep measurements. We demonstrate excellent sensitivity by decreasing sample amounts from 100 μg into the sub-microgram range, without losses attributable to the spider fractionator and while quantifying close to 10,000 proteins. Finally, we apply the system to the rapid automated and in-depth characterization of 12 different human cell lines to a median depth of 11,472 different proteins, which revealed differences recapitulating their developmental origin and differentiation status. The fractionation technology described here is flexible, easy to use, and facilitates comprehensive proteome characterization with minimal sample requirements.


Conflict of interest statement

The other authors have no conflicts of interest

Figures

Fig. 1.
Fig. 1.
Spider fractionation principle and practical implementation. A, switch mechanism of the rotor valve, illustrating how the flow from the first dimension separation is divided to eight output lines. B, schematic of the implementation of the spider fractionator. The first dimension separation is realized as a 250 μm inner diameter column, connected upstream through a zero dead volume connector to a nano-HPLC pump (an ultra high pressure unit is depicted but not required). The zoom-in is a cut-away symbolizing different peptide bands being separated in the column by different colors. Downstream, the column is connected to the rotor valve from A. The output lines feed into tubes that are filled in turn, according to the concatenation scheme. The spider-like appearance of the output lines give the name to the device. The arrows indicate that the output lines can be moved to a new set of tubes for a new separation process. After separation, the tubes are inserted into the autosampler of an UHPLC for LC-MS/MS analysis of the fractions. C, photo of the prototype spider fractionator used in this work.
Fig. 2.
Fig. 2.
Comparison of pooled and non-pooled peptide mixtures and separation efficiency. A, total ion current of separately collected, 90-s elution cuts from the 1st dimension column. B, total ion current of automatically pooled fractions corresponding to the ones in A. C, histogram of peptides containing at least 75% of their total mass over all fractions in the indicated number of fractions.
Fig. 3.
Fig. 3.
Effect of different numbers of pooled fractionations on proteome coverage. A, cumulative number of sequence unique peptides as a function of fraction number for a 4, 8, 16, and 24 fractionation scheme. The upper curves (circles) are obtained with match between runs enabled in MaxQuant and the lower curves (diamonds) without match between runs. The last fraction of the experiment is labeled in each case. B, same as A but for protein numbers. C, number of peptides identified per min in 100 min gradient runs as a function of total number of peptides identified. Values enclosed in the upper ellipse are those employing match between runs and in the lower ellipse without match between runs. High values on the x and on the y axis are desirable (large number of identifications per min as well as high number of identified peptides). D, same as C but for protein numbers.
Fig. 4.
Fig. 4.
Dependence of proteome coverage on sample amount. A, fractionation of a total of 0. 5, 1, 2, 5, 10, 20, 50, and 100 μg of HeLa peptides resulted in the indicated number of identified peptides. For the sample amount 1*, we started with 6,600 HeLa cells, which is equal to 1 μg of starting material, for an in-StageTip digestion with subsequent peptide cleanup and fractionation. Blue represents peptides identified by MS/MS and red those identified by match between runs in MaxQuant. The gray bar indicates that the false discovery rate for match between runs was not validated at this very low sample amount. In the case of 20, 50, and 100 μg of starting material, the volume corresponding to 2 μg of peptide material was injected to avoid overloading the analytical column. B, same as A for the number of identified proteins. C, sequence coverage as a function of starting peptide material displayed as Tukey plots. The bold black lines represent the median of all proteins. The blue box marks the upper and lower quartile of the sequence coverage and the whiskers the 1.5-fold interquartile range. D, median intensity determined as label-free intensity values by MaxQuant for all proteins that were quantified in the dilution series are plotted as a function of initial peptide sample amount. Each value is the median of all protein quantifications.
Fig. 5.
Fig. 5.
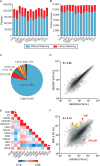
Rapid and sensitive sequencing of 13 human cell line proteomes. A, number of sequences of unique peptides identified for the different cell lines indicated on the x axis (see supplemental Table 2 for cell line abbreviations). Blue indicates the proportion identified by MS/MS and red the additional peptides identified by match between runs in MaxQuant. B, same as A for identified protein numbers. C, pie chart of the proportion of proteins identified in the indicated number of cell lines. A total of 89% of the proteins identified are also identified in at least 10 of the 13 cell lines. D, scatter plot of the label-free intensity (LFQ) assigned by MaxQuant to the same protein in two different instances of the same HEK293 cell line (termed HEK293 on the x axis and HEK293* on the y axis, respectively). E, heat map of the rank order correlation of the 13 different proteomes. The SMC and EC cell lines are outliers with respect to their correlations to the others and are indicated by arrows. F, scatter plot of the proteins quantified in both the LNCaP (epithelial origin) and the SMC cell line (mesenchymal origin). The known epithelial marker epithelial cell adhesion molecule is much more highly expressed in LNCaP, whereas the known mesenchymal marker vimentin is extremely highly expressed in SMC. Vimentin together with LARP6 (colored in green) stabilizes type I collagen mRNA for CO1A1 and CO1A2 (colored in orange). Several other collagens (COL12A1, -3A1, -5A1, -6A1, -6A2, -6A3, and -7A1 colored in yellow) follow the same pattern.

References

    1. Beck M., Claassen M., and Aebersold R. (2011) Comprehensive proteomics. Curr. Opin. Biotechnol. 22, 3–8 - PubMed
    1. Hebert A. S., Richards A. L., Bailey D. J., Ulbrich A., Coughlin E. E., Westphall M. S., and Coon J. J. (2014) The one hour yeast proteome. Mol. Cell. Proteomics 13, 339–347 - PMC - PubMed
    1. Kulak N. A., Pichler G., Paron I., Nagaraj N., and Mann M. (2014) Minimal encapsulated proteomic-sample processing applied to copy-number estimation in eukaryotic cells. Nat. Methods 11, 319–324 - PubMed
    1. Muñoz J., and Heck A. J. (2014) From the human genome to the human proteome. Angewandte Chemie 53, 10864–10866 - PubMed
    1. Aebersold R., and Mann M. (2016) Mass-spectrometric exploration of proteome structure and function. Nature 537, 347–355 - PubMed

Publication types

LinkOut - more resources