. 2017 Jan 27:8:14147.
doi: 10.1038/ncomms14147.

A-FABP mediates adaptive thermogenesis by promoting intracellular activation of thyroid hormones in brown adipocytes

Affiliations

A-FABP mediates adaptive thermogenesis by promoting intracellular activation of thyroid hormones in brown adipocytes

Lingling Shu et al. Nat Commun. .

Abstract

The adipokine adipocyte fatty acid-binding protein (A-FABP) has been implicated in obesity-related cardio-metabolic complications. Here we show that A-FABP increases thermogenesis by promoting the conversion of T4 to T3 in brown adipocytes. We find that A-FABP levels are increased in both white (WAT) and brown (BAT) adipose tissues and the bloodstream in response to thermogenic stimuli. A-FABP knockout mice have reduced thermogenesis and whole-body energy expenditure after cold stress or after feeding a high-fat diet, which can be reversed by infusion of recombinant A-FABP. Mechanistically, A-FABP induces the expression of type-II iodothyronine deiodinase in BAT via inhibition of the nuclear receptor liver X receptor α, thereby leading to the conversion of thyroid hormone from its inactive form T4 to active T3. The thermogenic responses to T4 are abrogated in A-FABP KO mice, but enhanced by A-FABP. Thus, A-FABP acts as a physiological stimulator of BAT-mediated adaptive thermogenesis.


Conflict of interest statement

The authors declare no competing financial interests.

Figures

Figure 1
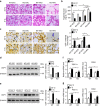
Figure 1. A-FABP deficiency impairs adaptive thermogenesis in mice.
(a) Representative photos of male 4-week-old A-FABP KO mice and their WT littermates fed with either standard chow (STC) or high-fat diet (HFD) for 24 weeks (n=12). (b,c) Oxygen consumption (VO2) of the mice fed with (b) STC or (c) HFD for 4 weeks (n=8). (d) Respiratory exchange rate (RER) and (e) locomotory activity (XAMB) of above mice fed with HFD for 4 weeks (n=8). (f) Rectal temperature and (g) fat mass loss of A-FABP KO or WT mice fed with HFD for 24 weeks followed by cold exposure (6 °C) for 8 h (n=8). Data are represented as mean±s.e.m. *P<0.05, **P<0.01, ***P<0.001 (Student's t-test).
Figure 2
Figure 2. A-FABP deficiency impedes HFD- and cold-induced activation of BAT in mice.
Male 4-week-old A-FABP KO and their WT littermates were fed with either STC or HFD for 24 weeks and subjected to room temperature (23 °C) or cold exposure (6 °C) for 24 h. (a) Haematoxylin and eosin (H&E) staining, (b) triglyceride levels, (c) immunohistochemistry (IHC) staining and densitometry analysis (right panel) for UCP-1 in brown adipose tissue (BAT) of mice. Scale bar, 20 μm, with magnification of 400 × . Representative images from three independent experiments are shown (n=8). (d,e) BAT isolated from above mice (d) fed with STC or HFD for 24 weeks or (e) exposed to 23 °C or 6 °C for 24 h were subjected to immunoblotting using an antibody against UCP-1, β-tubulin as indicated. Right panels are the band intensity of UCP-1 relative to β-tubulin and expressed as arbitrary units (n=8). (f,g) The mRNA abundance of the thermogenic genes in BAT of above mice (f) fed with STC or HFD for 24 weeks or (g) exposed to 23 °C or 6 °C for 24 h (n=8). Uncropped western blot images are shown in Supplementary Fig. 13. Data are represented as mean±s.e.m. *P<0.05, **P<0.01 (one-way analysis of variance with Bonferroni correction for multiple comparisons).
Figure 3
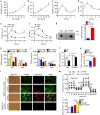
Figure 3. Circulating A-FABP facilitates the uptake of free fatty acid into adipocytes.
(a) Circulating A-FABP and (b) FFA profile of male 4-week-old C57BL/6N mice fed with HFD for 24 weeks (n=8). (c) Circulating A-FABP and (d) FFA level of male 8-week-old C57BL/6N mice during cold exposure (6 °C) for 4 h (n=8). (e) Circulating A-FABP and (f) FFA level of male 8-week-old C57BL/6N mice intraperitoneally injected with norepinephrine (NE; 1 mg kg−1) or PBS (vehicle) for 4 h under fasting condition (n=6). (g) Co-immunoprecipitation (Co-IP) of A-FABP and 3H-palmitate in serum of male 8-week-old C57BL/6N mice after administration of 3H-palmitate (2 μCi) for 4 h. Right panel is the 3H-palmitate radioactivity of the co-immunoprecipitated A-FABP protein (n=6). (h,i) 3H-palmitate uptake in BAT and WAT of 8-week-old A-FABP KO mice and their WT littermates infused with PBS or (h) recombinant A-FABP (rA-FABP; 1 μg h−1) or (i) mutant R126Q (1 μg h−1) (n=6). (j) BODIPY-FA uptake in WT or A-FABP-deficient brown adipocytes treated with PBS or rA-FABP (2 μg ml−1) for 10 min (min) (n=6). (k) 3H-palmitate uptake in A-FABP-deficient adipocytes incubated with PBS, bovine serum albumin (BSA; 3 μg ml−1) or rA-FABP (2 μg ml−1) (n=6). (l) In vitro fluorescent imaging analysis of brown adipocytes treated with BODIPY-FA (2 μM) with or without pre-incubation with fluorescent-labelled rA-FABP (2 μg ml−1). Images were taken at 5, 10 and 30 min after treatment. Control image was taken at 30 min in which A-FABP-deficient brown adipocytes were incubated with BODIPY-FA without pre-incubation with rA-FABP. Scale bar, 20 μm, with magnification of 400 × . Representative images from three independent experiments are shown (n=6). (m) Oxygen consumption rate (OCR) and its mean value (lower panel) of A-FABP-deficient brown adipocytes treated with palmitate (PA: 200 nM) with or without pre-incubation with rA-FABP (2 μg ml−1) (n=6). CPMA, count per minutes for beta particles; RFU, relative fluorescence units; OCR, oxygen consumption rate; FCCP, carbonyl cyanide-4-(trifluoromethoxy) phenylhydrazone; R/A, rotenone/antimycin A. Uncropped image for co-immunoprecipitation is shown in Supplementary Fig. 13. Data are represented as mean±s.e.m. *P<0.05, **P<0.01, ***P<0.001 (Student's t-test (ag), one-way analysis of variance with Bonferroni correction for multiple comparisons (hk,m)).
Figure 4
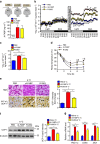
Figure 4. A-FABP enhances energy expenditure and BAT recruitment in A-FABP KO mice.
Male 4-week-old A-FABP KO mice fed with HFD for 4 weeks were infused with PBS (vehicle), recombinant A-FABP (rA-FABP, 1 μg h−1) or A-FABP mutant R126Q (1 μg h−1) for 14 days with or without subjected to cold exposure (6 °C). (a) Circulating rA-FABP level and (b) oxygen consumption (VO2) of A-FABP KO mice before or after infusion of recombinant proteins (n=6). (c) Mean VO2 of above A-FABP KO mice measured after infusion of recombinant proteins for 3 days (n=6). (d) Rectal temperature of above A-FABP KO mice infused with rA-FABP or R126Q during cold exposure (6 °C) for 8 h. (e) Haematoxylin and eosin staining and IHC staining of UCP-1 in BAT of mice after cold exposure for 8 h, scale bar, 20 μm; with magnification of 400 × . The right panel is the densitometry analysis for UCP-1. Representative images from three independent experiments are shown (n=6). (f) BAT isolated from above mice was subjected to immunoblotting using an antibody against UCP-1, β-tubulin as indicated. The right panel is the band intensity of UCP-1 relative to β-tubulin (n=6). (g) The mRNA abundance of the thermogenic genes PGC-1α, Cidea and Dio2 in BAT isolated from above mice (n=6). CPMA, count per minutes for beta particles. N.D., not detected. Uncropped western blot images are shown in Supplementary Fig. 13. Data are represented as mean±s.e.m. *P<0.05, **P<0.01, ***P<0.001, $rA-FABP versus R126Q, $<0.05; #R126Q versus PBS, #P<0.05 (One-way analysis of variance with Bonferroni correction for multiple comparisons).
Figure 5
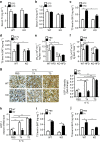
Figure 5. A-FABP deficiency impairs conversion of T4 to T3 in BAT of mice.
(a) Circulating T4 and (b) T3 levels of male 4-week-old A-FABP KO mice and WT littermates fed with STC or HFD for 24 weeks as indicated in Fig. 2 (n=8). (c,d) T3 levels in BAT of male 4-week-old A-FABP KO mice and WT littermates (c) fed with STC or HFD 24 weeks or (d) subjected to cold exposure (6 °C) for 24 h as indicated in Fig. 2 (n=8). Male 4-week-old A-FABP KO and WT mice fed with HFD for 4 weeks were supplemented with PBS, T4 (400 μg kg−1, 5 days) or T3 (500 μg kg−1, 1 day) followed by cold exposure (6 °C) for 24 h. (e,f) Energy expenditure of mice supplemented with (e) T4 or (f) T3 followed by cold exposure (6 °C) for 24 h (n=6). (g) Representative IHC staining and densitometry analysis (right panel) for UCP-1 in the BAT of mice. Scale bar, 20 μM, with magnification of 400 × . Representative images from three independent experiments are shown (n=6). (h) The mRNA abundance of UCP-1 in BAT of above mice (n=6). (i,j) T3 levels in BAT isolated from above WT and A-FABP KO mice fed with HFD for 4 weeks supplemented with (i) T3 or (j) T4 followed by cold exposure (6 °C) for 24 h (n=6). Data are represented as mean±s.e.m. *P<0.05, **P<0.01 (one-way analysis of variance with Bonferroni correction for multiple comparisons).
Figure 6
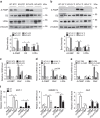
Figure 6. A-FABP mediates expression of Dio2 via inhibition of LXRα.
(a,b) BAT isolated from WT and A-FABP KO mice (a) fed with STC or HFD for 24 weeks or (b) subjected to room temperature (23 °C) or cold exposure (6 °C) for 24 h as indicated in Fig. 2 were subjected to immunoblotting using an antibody against A-FABP, type II iodothyronine deiodinase (D2), liver X receptor α (LXRα) and β-tubulin. The bar charts below are the band intensity of each protein relative to β-tubulin and expressed as arbitrary units, N.D., not detected (n=6). (c,d) The mRNA abundance of A-FABP, Dio2 and LXRα in BAT of above WT and A-FABP KO mice (c) fed with STC or HFD for 24 weeks or (d) subjected to cold exposure (6 °C) for 24 h (n=6). (e) The mRNA abundance of A-FABP, LXRα and Dio2 in WT or A-FABP-deficient primary brown adipocytes incubated with PBS or recombinant A-FABP (rA-FABP, 2 μg ml−1) for 24 h (n=6). (f) The mRNA abundance of LXRα downstream target genes (SCD-1, SREBP-1c) and Dio2 in WT and A-FABP-deficient primary brown adipocytes treated with or without LXRα agonist TO901317 (TO;1 μM) and/or rA-FABP (2 μg ml−1) for 24 h (n=6). Uncropped western blot images are shown in Supplementary Fig. 13. Data are represented as mean±s.e.m. *P<0.05, **P<0.01 (One-way analysis of variance with Bonferroni correction for multiple comparisons).
Figure 7
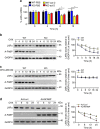
Figure 7. A-FABP accelerates proteasomal degradation of LXRα.
(a) Primary adipocytes derived from male 6-week-old A-FABP KO mice or WT littermates were treated with actinomycin D (actD, 1 μg ml−1) or vehicle (PBS). The mRNA level of LXRα was determined by real-time PCR at time points as indicated (n=4). (b,c) Primary brown adipocytes derived from male 6-week-old A-FABP KO mice or WT littermates were treated with (b) cycloheximide (CHX, 50 μg ml−1) or (c) CHX (50 μg ml−1) together with MG132 (10 μM) for different periods were subjected to immunoblotting using an antibody against LXRα, A-FABP and GADPH as indicated (n=4). (d) Primary brown adipocytes derived male 6-week-old A-FABP KO mice or WT littermates were infected with adenovirus overexpressing A-FABP (Ad-AFABP) or luciferase (Ad-Luci) for 48 h, followed by treatment with CHX (50 μg ml−1) for 0,6,12 and 24 h, and then subjected to immunoblotting using an antibody against LXRα, A-FABP and GADPH as indicated (n=4). The right panel is the band intensity of LXRα normalized with GAPDH, and expressed as percentage relative to baseline (0 h). Uncropped western blot images are shown in Supplementary Fig. 14. Data are represented as mean±s.e.m. *P<0.05, **P<0.01 (Students' t-test).
Figure 8
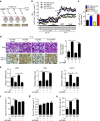
Figure 8. A-FABP enhances conversion of T4 to T3 and energy expenditure in mice.
(a) Schematic diagram of the experimental procedure. Male 4-week-old A-FABP KO mice and WT littermates fed with HFD for 4 weeks were replenished with rA-FABP (1 μg h−1) or PBS for 14 days. Mice were then subcutaneously injected with T4 (400 μg kg−1; 5 days) at the last 5 days of recombinant protein administration followed by cold exposure (6 °C) for 24 h (n=6). (b) Whole-body energy expenditure and (c) mean value of cold-induced energy expenditure of mice mentioned above (n=6). (d) Representative H&E staining, IHC staining and densitometry analysis for the expression of UCP-1 (right panel) in BAT, scale bar, 20 μM, with magnification of 400 × . Representative images from three independent experiments are shown (n=6). (e) The mRNA abundance of LXRα, Dio2 and UCP-1 in BAT of above mice (n=6). Circulating levels of (f) T4 and (g) T3 and (h) T3 level in BAT of mice mentioned above (n=6). Data are represented as mean±s.e.m. *P<0.05, **P<0.01 (one-way analysis of variance with Bonferroni correction for multiple comparisons.)
Figure 9
Figure 9. Mechanisms by which A-FABP regulates adaptive thermogenesis.
In response to cold challenge or HFD, A-FABP is elevated in BAT, WAT and in the circulation. Elevated A-FABP in BAT induces the expression of Dio2 via suppression of LXRα. Increased Dio2 promotes adaptive thermogenesis by enhancing conversion of T4 to T3 in BAT. In addition, elevated circulating A-FABP facilitates the delivery of WAT-derived FFAs to BAT. Increased FFAs supply to BAT further induces the expression and activation of UCP-1 for thermogenesis.

Similar articles

Cited by

References

    1. Dietrich M. O. & Horvath T. L. Limitations in anti-obesity drug development: the critical role of hunger-promoting neurons. Nat. Rev. Drug Discov. 11, 675–691 (2012). - PubMed
    1. Nedergaard J. et al.. UCP1: the only protein able to mediate adaptive non-shivering thermogenesis and metabolic inefficiency. Biochim. Biophys. Acta 1504, 82–106 (2001). - PubMed
    1. Lowell B. B. & Spiegelman B. M. Towards a molecular understanding of adaptive thermogenesis. Nature 404, 652–660 (2000). - PubMed
    1. Wijers S. L., Saris W. H. & van Marken Lichtenbelt W. D. Recent advances in adaptive thermogenesis: potential implications for the treatment of obesity. Obes. Rev. 10, 218–226 (2009). - PubMed
    1. Cannon B. & Nedergaard J. Nonshivering thermogenesis and its adequate measurement in metabolic studies. J. Exp. Biol. 214, 242–253 (2011). - PubMed

Publication types

MeSH terms