. 2017 Jan 27:8:14186.
doi: 10.1038/ncomms14186.

A critical role of DDRGK1 in endoplasmic reticulum homoeostasis via regulation of IRE1α stability

Affiliations

A critical role of DDRGK1 in endoplasmic reticulum homoeostasis via regulation of IRE1α stability

Jiang Liu et al. Nat Commun. .

Abstract

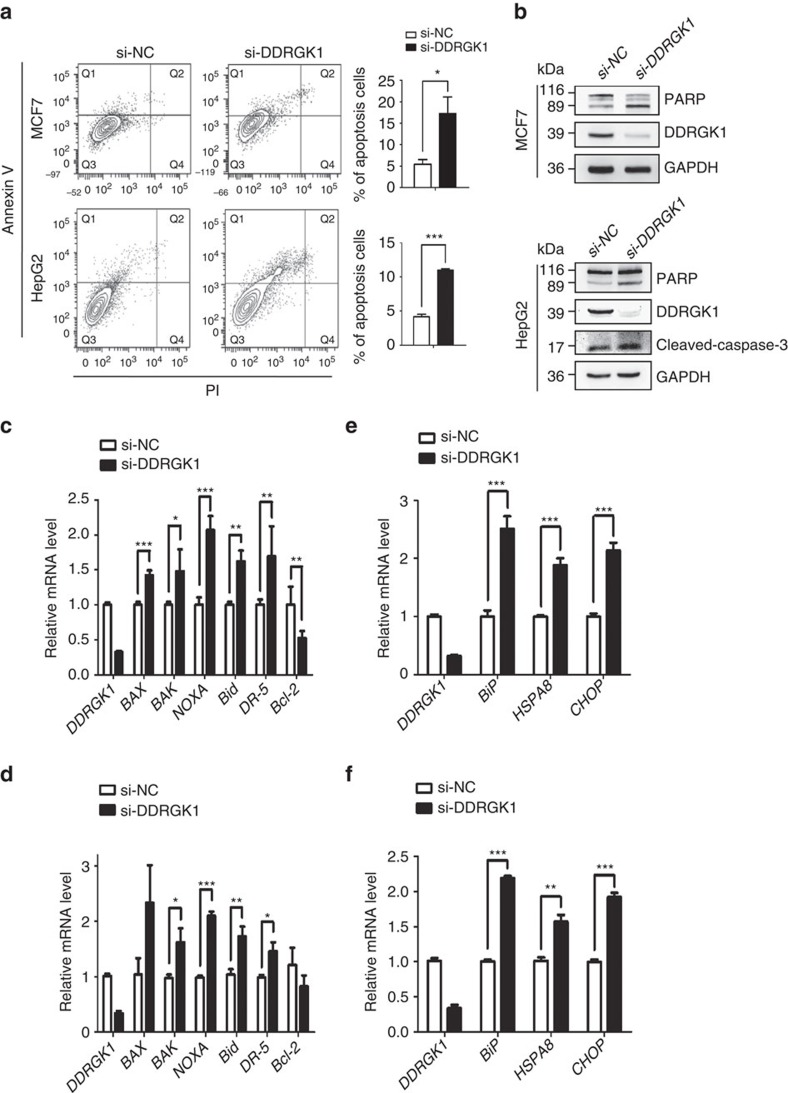
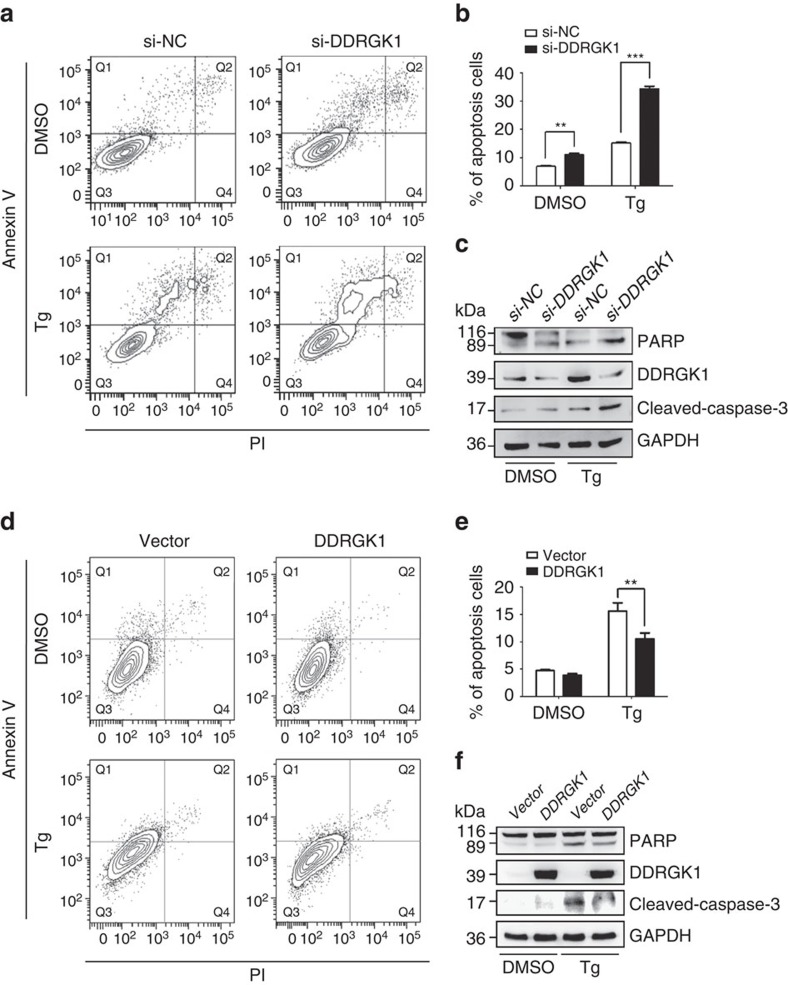
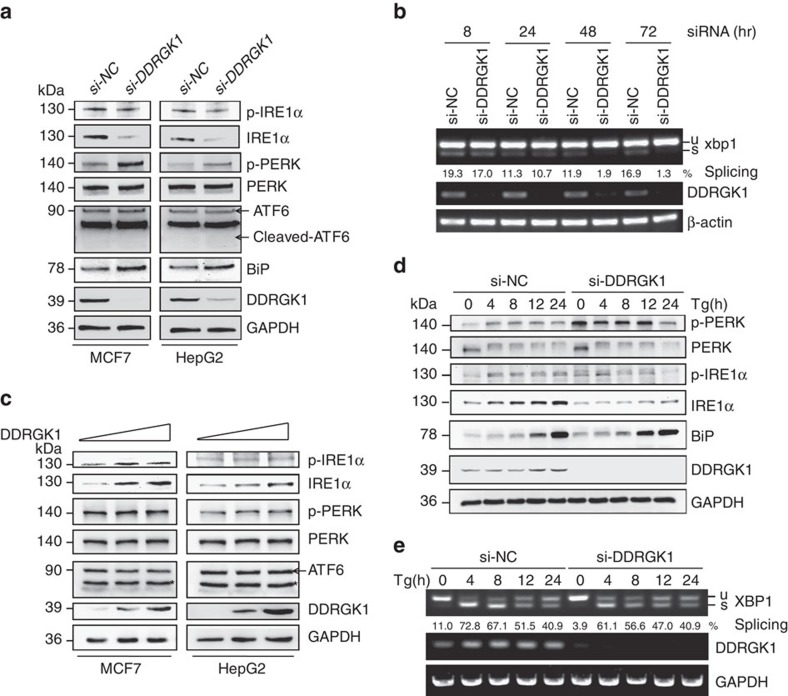
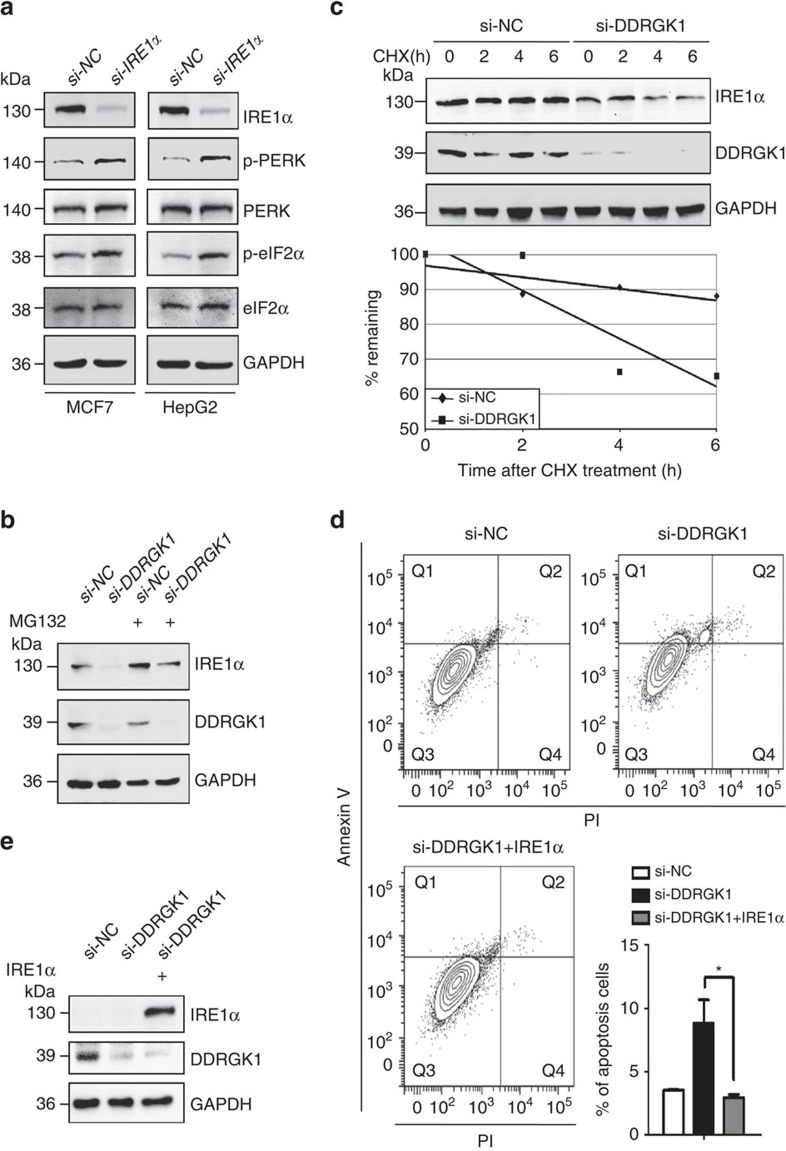
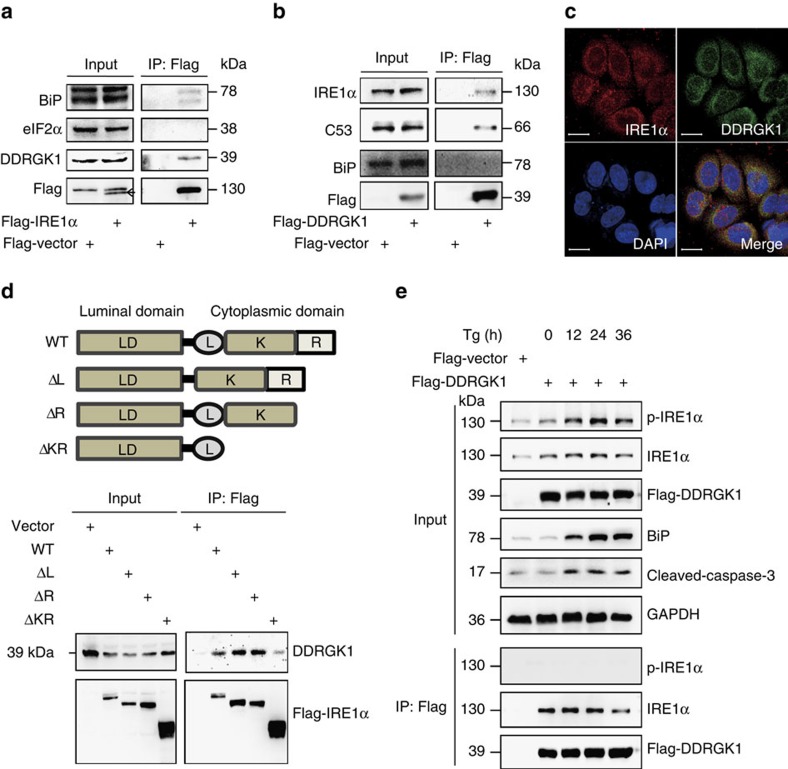
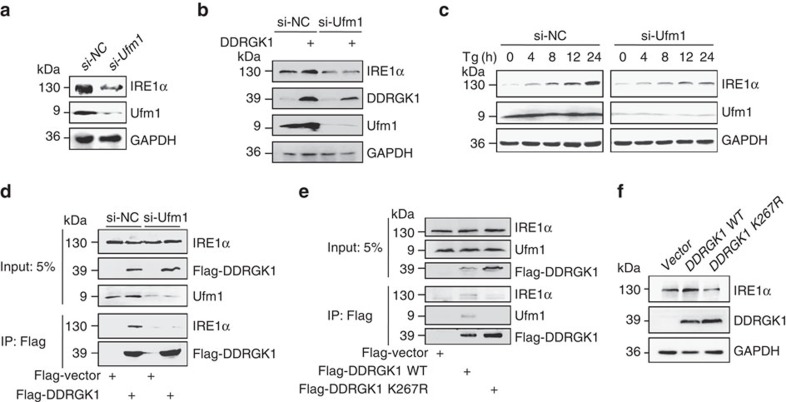
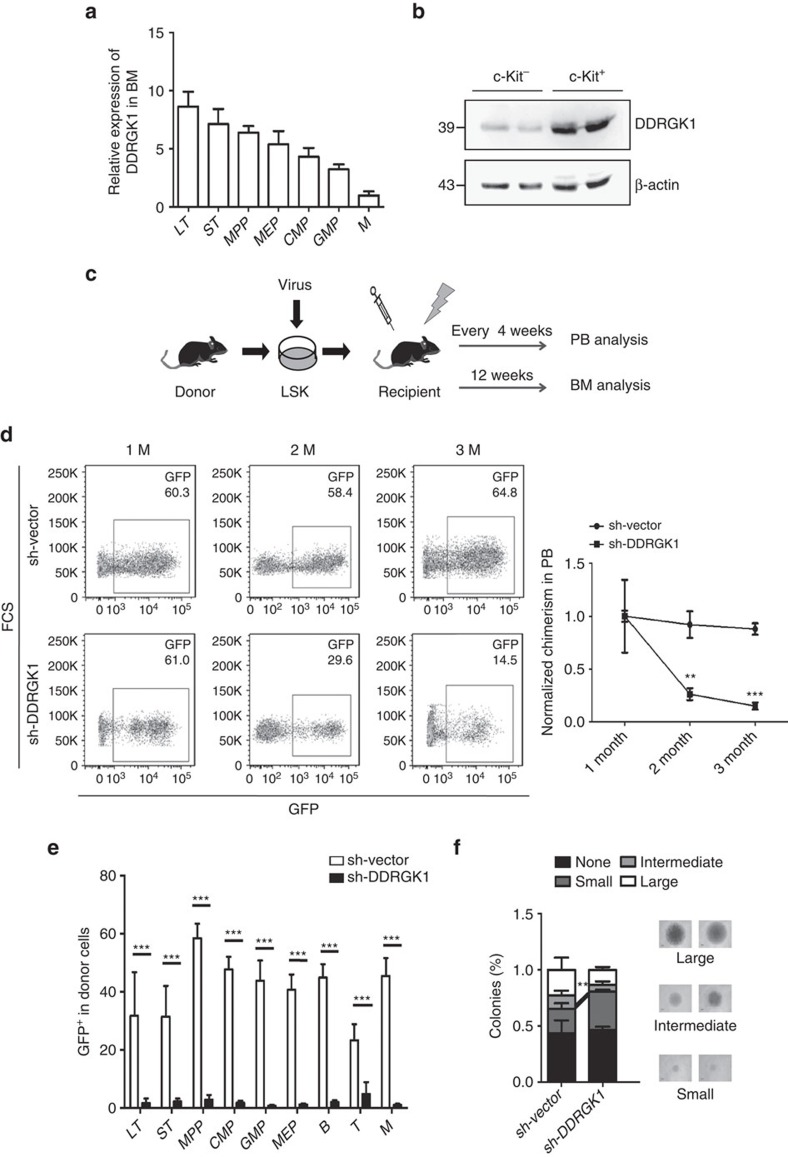
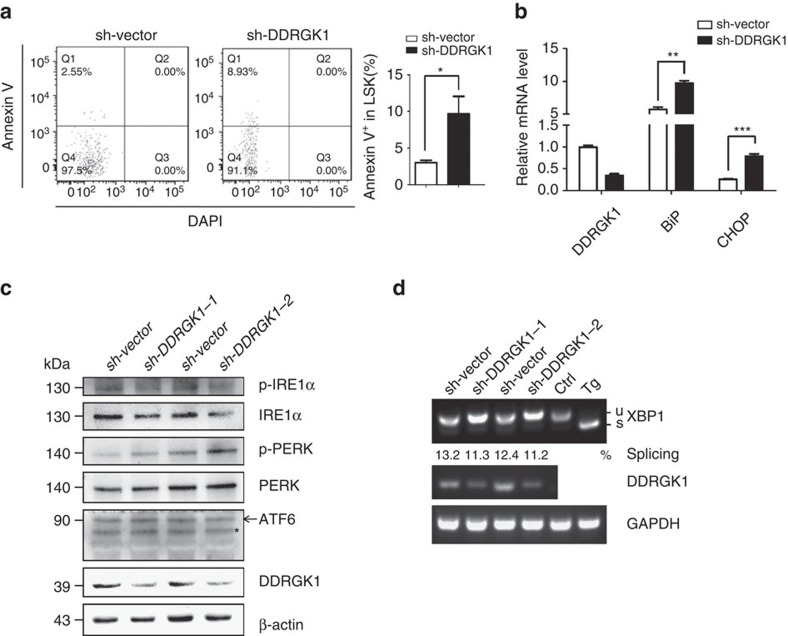
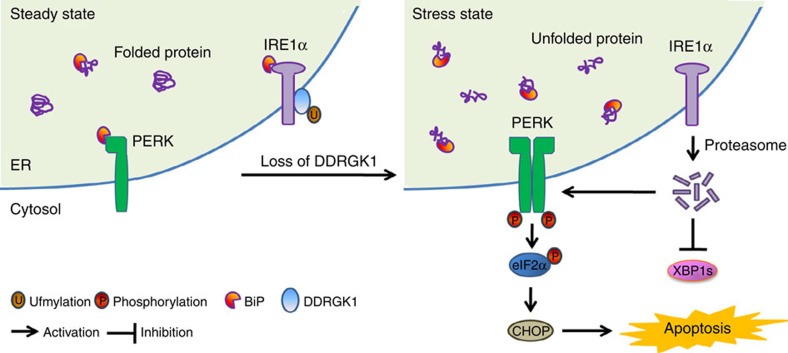
Disturbance of endoplasmic reticulum (ER) homoeostasis induces ER stress and leads to activation of the unfolded protein response (UPR), which is an adaptive reaction that promotes cell survival or triggers apoptosis, when homoeostasis is not restored. DDRGK1 is an ER membrane protein and a critical component of the ubiquitin-fold modifier 1 (Ufm1) system. However, the functions and mechanisms of DDRGK1 in ER homoeostasis are largely unknown. Here, we show that depletion of DDRGK1 induces ER stress and enhances ER stress-induced apoptosis in both cancer cells and hematopoietic stem cells (HSCs). Depletion of DDRGK1 represses IRE1α-XBP1 signalling and activates the PERK-eIF2α-CHOP apoptotic pathway by targeting the ER-stress sensor IRE1α. We further demonstrate that DDRGK1 regulates IRE1α protein stability via its interaction with the kinase domain of IRE1α, which is dependent on its ufmylation modification. Altogether, our results provide evidence that DDRGK1 is essential for ER homoeostasis regulation.


Conflict of interest statement

The authors declare no competing financial interests.

Figures

Figure 1
Figure 1. Depletion of DDRGK1 leads to apoptosis and elevated ER stress.
(a) MCF7 and HepG2 cells were transfected with either control siRNA or siRNA targeting DDRGK1 for 72 h. The cells were subsequently stained with Annexin V and PI and subjected to flow cytometric analysis followed by the quantification of apoptotic cells (Annexin V+). (b) Western blot analysis of PARP and cleaved caspase-3 in control and DDRGK1-knockdown MCF7 and HepG2 cells described in a. (c,d) Q-PCR analysis of the relative mRNA expression levels of BAX, BAK, NOXA, Bid, DR-5 and Bcl-2 in control and DDRGK1-knockdown MCF7 and HepG2 cells. (e,f) Q-PCR analysis of the relative mRNA expression levels of BiP, HSPA8 and CHOP in control and DDRGK1-knockdown MCF7 and HepG2 cells. All data are presented as mean±s.d. from three experiments. *P<0.05, **P<0.01 and ***P<0.001 by Student's t-test.
Figure 2
Figure 2. DDRGK1 plays a protective role in ER stress-induced apoptosis.
(a). HepG2 cells were transfected with control siRNA or with siRNA against DDRGK1 for 72 h, and then the cells were treated with DMSO (vehicle control) or Tg (2.5 μM) for 24 h before harvesting. The cells were stained with Annexin V and PI, followed by flow cytometric analysis. (b). Quantification of the apoptotic cells (Annexin V+) in a. (c) Western blot analysis of PARP and cleaved caspase-3 in the HepG2 cells described in a. (d) HepG2 cells were transfected with control vector or DDRGK1 for 36 h, and the cells were treated with DMSO or Tg (2.5 μM) for 24 h before harvesting. The cells were stained with Annexin V and PI, followed by flow cytometric analysis. (e) Quantification of the apoptotic cells (Annexin V+) in d. (f) Western blot analysis of PARP and cleaved caspase-3 in the HepG2 cells described in d. All data are presented as mean±s.d. from three experiments. **P<0.01 and ***P<0.001 by Student's t-test.
Figure 3
Figure 3. DDRGK1 modulates the UPR.
(a) MCF7 and HepG2 cells were transfected with either control siRNA or siRNA targeting DDRGK1 for 72 h. The protein levels of p-IRE1α, IRE1α, p-PERK, PERK, ATF6 and BiP were determined by western blot. (b) MCF7 cells were transfected with control siRNA or siRNA against DDRGK1, and the cells were harvested at the indicated times for RT-PCR analysis of XBP-1 splicing. (c) MCF7 and HepG2 cells were transfected with control or DDRGK1 vectors at various doses for 36 h. The protein levels of p-IRE1α, IRE1α, p-PERK, PERK and ATF6 were determined by western blot. (d) MCF7 cells were transfected with siRNA control or siRNA targeting DDRGK1 for 72 h. The cells were collected for western blot after treatment with 2.5 μM Tg at the indicated times. (e) RT-PCR analysis of XBP-1 splicing in d. *Represents non-specific band.
Figure 4
Figure 4. DDRGK1 regulates the UPR by targeting IRE1α.
(a). MCF7 and HepG2 cells were transfected with either control siRNA or siRNA targeting IRE1α for 72 h. The protein levels of p-PERK, PERK, p-eIF2α and eIF2α were determined by western blot. (b). Western blot analysis of IRE1α in control and DDRGK1-knockdown MCF7 cells treated with or without MG132 (20 μM, 8 h). (c). Western blot analysis of IRE1α decay in control and DDRGK1-knockdown MCF7 cells after treatment with 100 μg ml−1 cycloheximide for the indicated times. The graph represents the quantification of the IRE1α protein levels. (d) MCF7 cells were transfected with either control siRNA or siRNA targeting DDRGK1 for 72 h. Before harvesting, the DDRGK1-knockdown cells were transfected with either control or IRE1α vectors for 36 h. The cells were subsequently stained with Annexin V and PI and subjected to flow cytometric analysis, followed by quantification of apoptotic cells (Annexin V+). All data are presented as mean±s.d. from three experiments. *P<0.05 by Student's t-test. (e) Western blot analysis of IRE1α in MCF7 cells in d.
Figure 5
Figure 5. DDRGK1 interacts with IRE1α.
(a). Western blot analysis of immunoprecipitates of Flag M2 affinity gel in HEK293T cells transfected with Flag-Vector or Flag-IRE1α vectors for 36 h. (b). Western blot analysis of immunoprecipitates of Flag M2 affinity gel in HEK293T cells transfected with Flag-Vector or Flag-DDRGK1 for 36 h. (c). MCF7 cells were double immunostained with anti-DDRGK1 antibody (green) and anti-IRE1α antibody (red). The cell nuclei were counterstained with DAPI (blue). The co-localization between the two endogenous proteins DDRGK1 and IRE1α is shown in the merge panel. Scale bar, 20 μm. (d) Schematics of IRE1α wild-type and truncated constructs and western blot analysis of the Flag M2 affinity gel immunoprecipitates in HEK293T cells transfected with Flag-Vector or Flag-IRE1α wild-type and truncates. (e) Western blot analysis of Flag M2 affinity gel immunoprecipitates in mock-or Tg-treated (2.5 μM) HEK293T cells expressing Flag-Vector or Flag-DDRGK1.
Figure 6
Figure 6. Ufmylation is required for the interaction between DDRGK1 and IRE1α.
(a) MCF7 cells were transfected with either control siRNA or siRNA targeting Ufm1 for 72 h. The protein levels of IRE1α were determined by western blot. (b) Western blot analysis of IRE1α in control and Ufm1-knockdown MCF7 cells expressing vector or DDRGK1. (c) The protein level of IRE1α was determined by western blot in control and Ufm1-knockdown MCF7 cells after treatment with 2.5 μM Tg for the indicated times. (d) Western blot analysis of Flag M2 affinity gel immunoprecipitates in HEK293T control and Ufm1-knockdown cells expressing Flag-Vector or Flag-DDRGK1. (e) Western blot analysis of Flag M2 affinity gel immunoprecipitates in HEK293T cells transfected with Flag-Vector, Flag-DDRGK1 WT or K267R mutant. (f) Western blot analysis of IRE1α in MCF7 cells transfected with Flag-Vector, Flag-DDRGK1 WT or K267R mutant.
Figure 7
Figure 7. Knockdown of DDRGK1 impairs the reconstitution ability of murine HSCs.
(a) Q-PCR analysis of the relative mRNA expression levels of DDRGK1 in the indicated subpopulations of BM from young wild-type mice (2 months old, n=3). The relative expression of DDRGK1 was normalized to GAPDH. Data are presented as mean±s.d. (b) Western blot analysis of DDRGK1 in enriched Lineage+ c-Kit and Lineage- c-Kit+ cells from young wild-type mice (2 months old). (c) Experimental schematic for the reconstitution assay. (d) Representative FACS pattern showing the percentage of GFP-positive cells in donor-derived control (sh-Vector) or DDRGK1-knockdown (sh-DDRGK1) PB cells (Left panel). The values represent the normalized percentages of donor-derived GFP+ cells in the total engraftment (Right panel, n=3). Data are presented as mean±s.d. **P<0.01 and ***P<0.001 by Student's t-test. (e) The values represent the percentages of donor-derived GFP+ cells in LT-HSC (CD34-Flt3- LSK), ST-HSC (CD34+Flt3- LSK), MPP (CD34+Flt3+ LSK), CMP (CD34+CD16/32-Sca1-c-Kit+Lin), GMP (CD34+CD16/32+Sca1-c-Kit+Lin), MEP (CD34- CD16/32-Sca1-c-Kit+Lin), B, T and myeloid lineage cell populations in the BM from primary recipient mice 12 weeks after transplantation (n=3). Data are presented as mean±s.d. ***P<0.001 by Student's t-test. (f) Single donor-derived GFP+ LT-HSCs from recipient mice were sorted into 96-well plates and cultured for 14 days in vitro. The percentage of colonies was calculated by dividing the number of colonies by the original number of single cells that were seeded. Data are presented as mean±s.d. **P<0.01 by Student's t-test.
Figure 8
Figure 8. Knockdown of DDRGK1 induces ER stress in HSCs.
(a) Representative FACS pattern showing the percentage of Annexin V-positive cells within the donor-derived control and DDRGK1-knockdown LSK cells after transplantation (Left panel). Bar graph shows the percentage of Annexin V-positive cells within LSK cells (Right panel, n=3). Data are presented as mean±s.d. *P<0.05 by Student's t-test. (b) Q-PCR analysis of the relative mRNA expression levels of DDRGK1, BiP and CHOP in donor-derived control and DDRGK1-knockdown LSK cells after transplantation (n=3). Data are presented as mean±s.d. **P<0.01 and ***P<0.001 by Student's t-test. (c) Western blot analysis of p-IRE1α, IRE1α, p-PERK, PERK and ATF6 in donor-derived GFP+Lineage-c-Kit+ cells enriched from control or DDRGK1-knockdown recipient mice. *Represents non-specific band. (d) RT-PCR analysis of XBP-1 splicing in donor-derived control and DDRGK1-knockdown LSK cells after transplantation. MEF cells with Tg treatment served as an XBP-1 splicing control.
Figure 9
Figure 9. Regulatory functions of DDRGK1 in the maintenance of ER homoeostasis.
IRE1α is stabilized through a physical interaction with DDRGK1 under homeostatic conditions. The loss of DDRGK1 decreases the protein abundance of IRE1α and activates the PERK-eIF2α-CHOP apoptotic pathway.

Similar articles

Cited by

References

    1. Brown M. K. & Naidoo N. The endoplasmic reticulum stress response in aging and age-related diseases. Front. Physiol. 3, 263 (2012). - PMC - PubMed
    1. Hetz C. The unfolded protein response: controlling cell fate decisions under ER stress and beyond. Nat. Rev. Mol Cell Biol. 13, 89–102 (2012). - PubMed
    1. Xu C., Bailly-Maitre B. & Reed J. C. Endoplasmic reticulum stress: cell life and death decisions. J. Clin. Investig. 115, 2656–2664 (2005). - PMC - PubMed
    1. Rutkowski D. T. & Kaufman R. J. A trip to the ER: coping with stress. Trends Cell Biol. 14, 20–28 (2004). - PubMed
    1. Tabas I. & Ron D. Integrating the mechanisms of apoptosis induced by endoplasmic reticulum stress. Nat. Cell Biol. 13, 184–190 (2011). - PMC - PubMed

Publication types

MeSH terms