. 2017 Jan 27:7:41494.
doi: 10.1038/srep41494.

Modeling pre-metastatic lymphvascular niche in the mouse ear sponge assay

Affiliations

Modeling pre-metastatic lymphvascular niche in the mouse ear sponge assay

Melissa García-Caballero et al. Sci Rep. .

Abstract

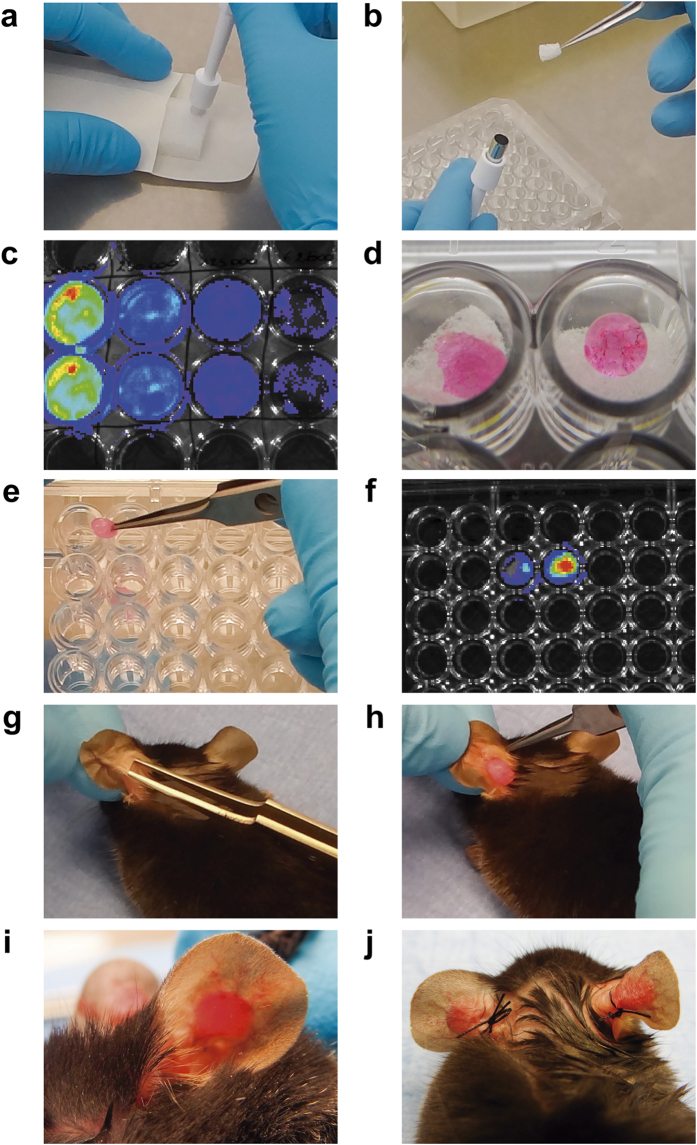
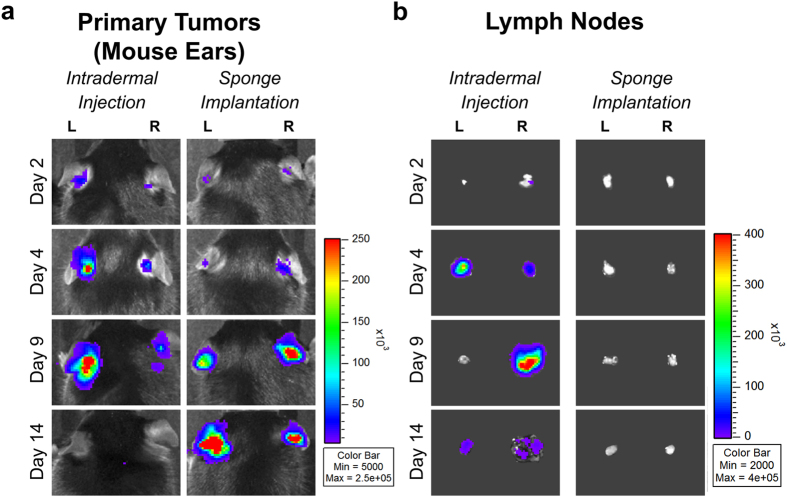
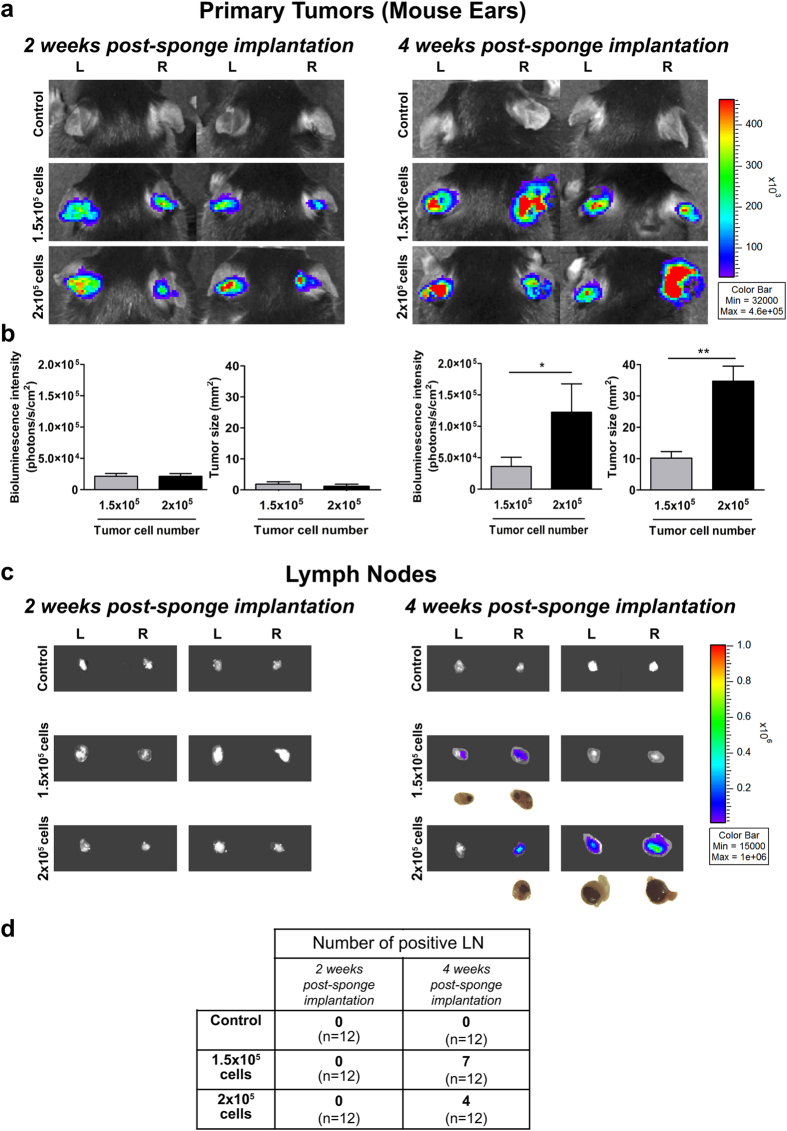
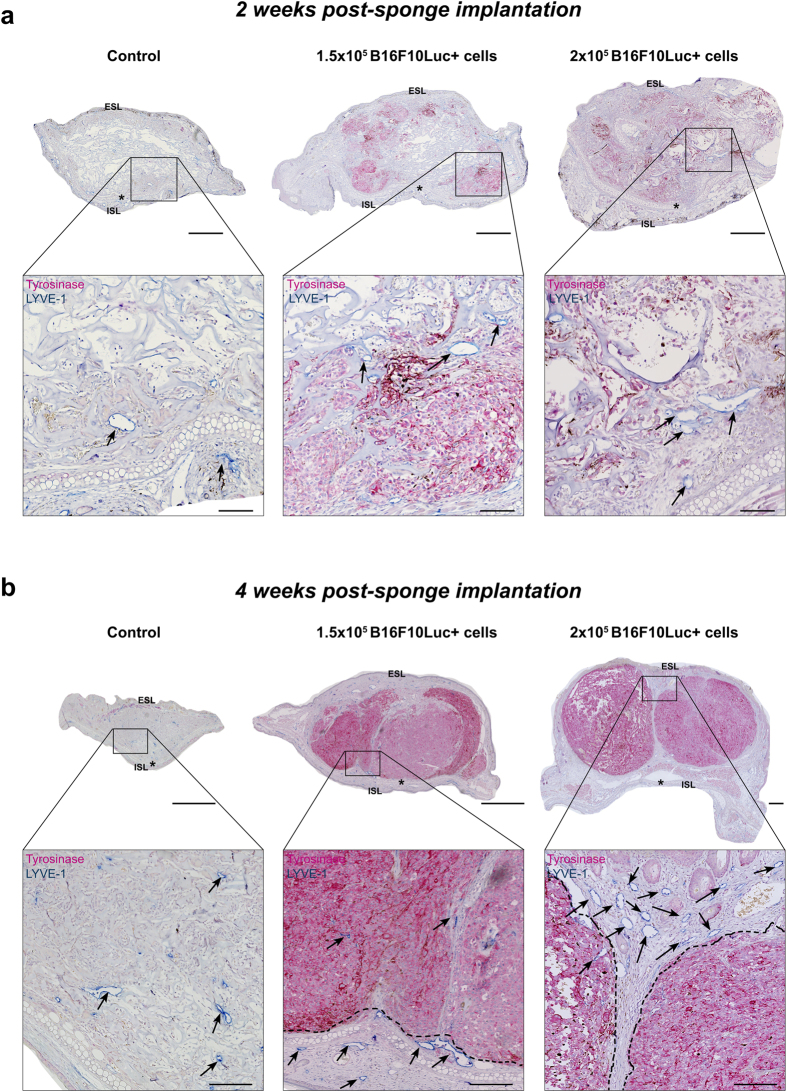
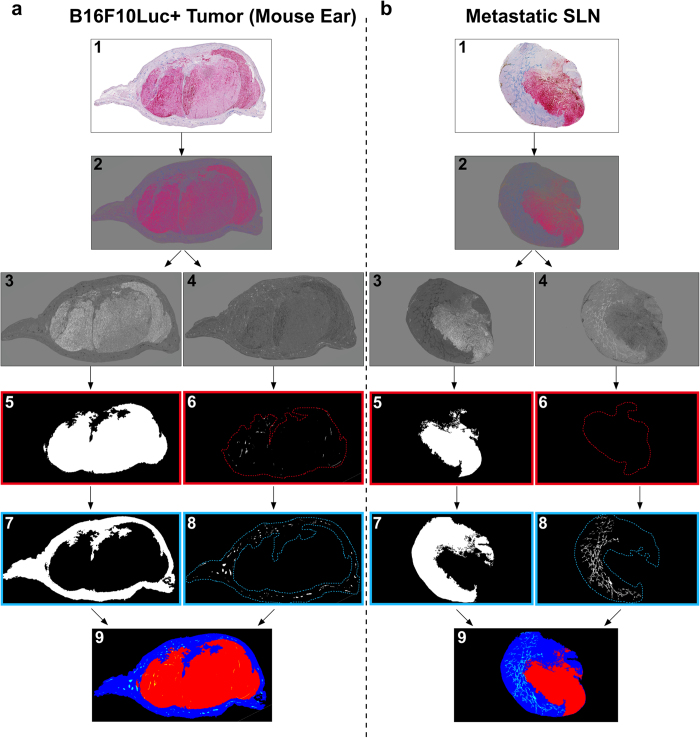
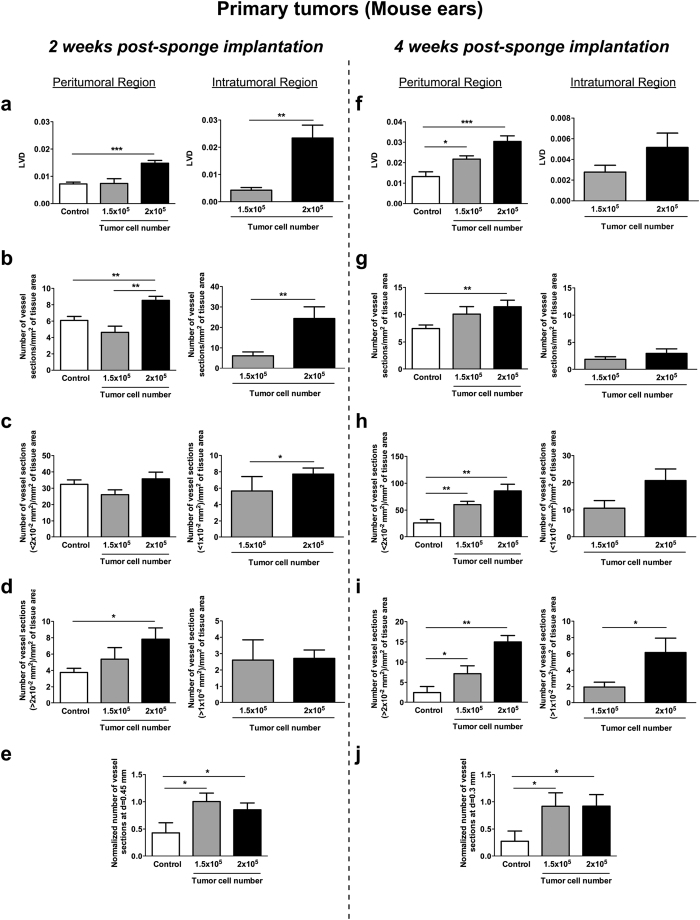
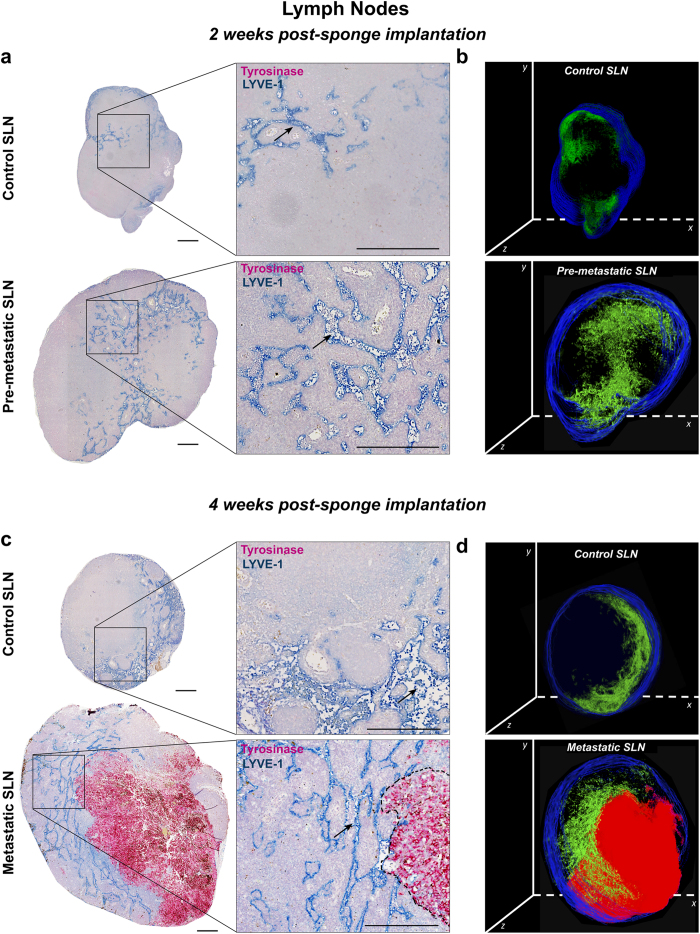
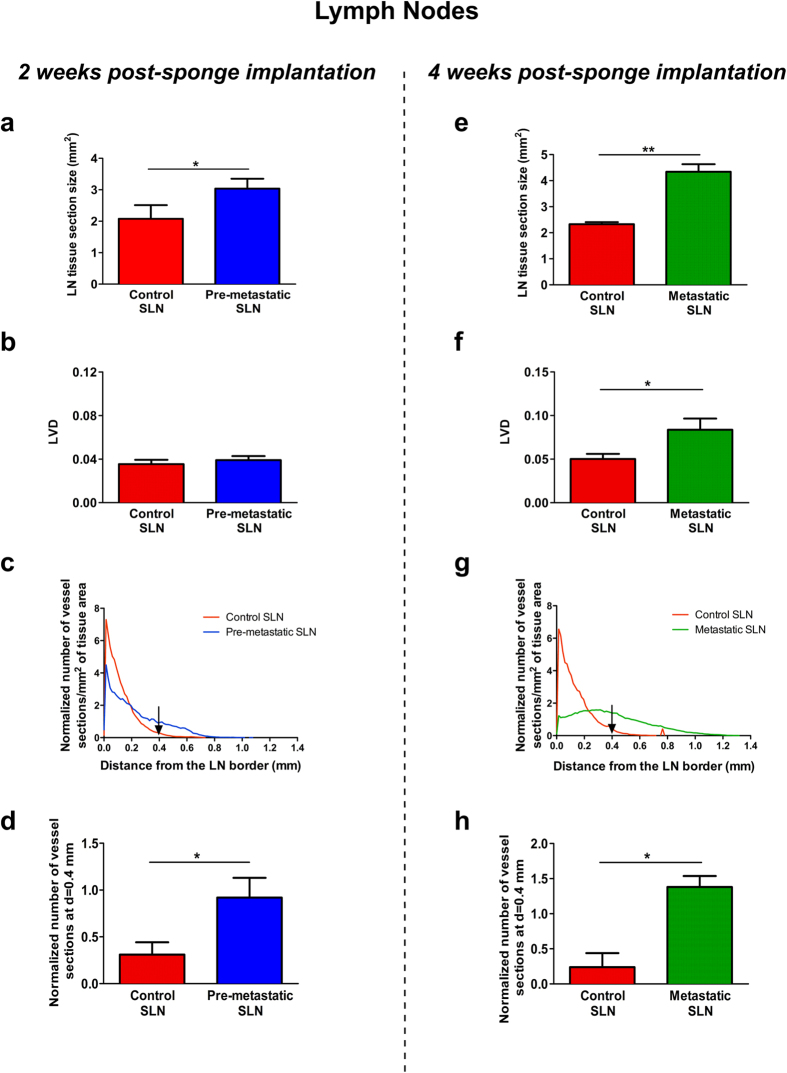
Lymphangiogenesis, the formation of new lymphatic vessels, occurs in primary tumors and in draining lymph nodes leading to pre-metastatic niche formation. Reliable in vivo models are becoming instrumental for investigating alterations occurring in lymph nodes before tumor cell arrival. In this study, we demonstrate that B16F10 melanoma cell encapsulation in a biomaterial, and implantation in the mouse ear, prevents their rapid lymphatic spread observed when cells are directly injected in the ear. Vascular remodeling in lymph nodes was detected two weeks after sponge implantation, while their colonization by tumor cells occurred two weeks later. In this model, a huge lymphangiogenic response was induced in primary tumors and in pre-metastatic and metastatic lymph nodes. In control lymph nodes, lymphatic vessels were confined to the cortex. In contrast, an enlargement and expansion of lymphatic vessels towards paracortical and medullar areas occurred in pre-metastatic lymph nodes. We designed an original computerized-assisted quantification method to examine the lymphatic vessel structure and the spatial distribution. This new reliable and accurate model is suitable for in vivo studies of lymphangiogenesis, holds promise for unraveling the mechanisms underlying lymphatic metastases and pre-metastatic niche formation in lymph nodes, and will provide new tools for drug testing.


Conflict of interest statement

The authors declare no competing financial interests.

Figures

Figure 1
Figure 1. Description of the main steps of the ear sponge assay.
The two major steps of the ear sponge assay are the sponge preparation (af) and the sponge implantation in mouse ears (gj). (a) Sterile compressed gelatin sponges were cut with a sterile biopsy punch into small cylindrical pieces. (b) Sponges were next placed in a 96-well plate (one per well) with a forceps. (c) For each experiment, the positivity for the Luciferase gene expression in B16F10Luc+ transfected cells was checked by bioluminescence. Serial dilutions of cells, starting at 5 × 105 B16F10Luc+ cells (wells at left), were associated with proportional Xenogen signals. (d) A drop of the appropriate cell suspension (20 μl) was seeded on top of the sponge, allowing the progressive diffusion of the solution into the sponge during an incubation for 30 minutes at 37 °C. (e) Sponges were soaked with a collagen mix, placed immediately in a new well and incubated at 37 °C for 30 minutes to allow collagen gel polymerization. (f) Such collagen coating did not affect the bioluminescence emitted by cells when luciferin was added inside the sponge. In the picture, sponges soaked with 20 μl of 1 × 105 and 2 × 105 at left and right, respectively. (g) A horizontal incision was performed in the basal, external and central part of the mouse ear and the external mouse ear skin layer was smoothly detached from the cartilage with a thin forceps. (h) Sponges were placed in the incision. (i) The gelatin sponge was introduced inside the hole, between the external mouse skin layer and the cartilage. A suture point was made to close the skin incision. (j) The same procedure was repeated in the other mouse ear, using always sponges with the same experimental condition in the same mouse.
Figure 2
Figure 2. Comparison between the mouse ear sponge assay and the intradermal injection of tumor cells into mouse ears.
The B16F10Luc+ tumor cell suspension (5 × 105 cells/50 μl) was directly injected between the two ear skin layers of C57BL/6J mice (Intradermal Injection) or added on a cylindrical piece of sponge and then implanted in mouse ears (Sponge Implantation). (a) At different time points (Day 2, 4, 9 and 14) bioluminescence in mouse ears was recorded in vivo with a Xenogen system. (b) The draining sentinel LNs were dissected and their bioluminescence was visualized ex vivo over time. Numeric values displayed in the color scale for radiance are expressed in photons/sec/cm2. “L” represents left ears/LNs and “R” represents right ears/LNs, n = 8 sponges or LNs per group (4 mice/group).
Figure 3
Figure 3. The mouse ear sponge model recapitulates the primary tumor growth, pre-metastatic and metastatic stages in LNs.
Sponges soaked with serum-free DMEM medium (control condition without tumor cells), 1.5 × 105 or 2 × 105 B16F10Luc+ cells diluted in serum-free DMEM medium, were implanted into both C57BL/6J mouse ears and mice were kept for 2 or 4 weeks. (a) Representative pictures showing the in vivo bioluminescent signals of the primary tumors developed in ears, at 2 (left panels) and 4 (right panels) weeks post-sponge insertion. Numeric values depicted in the color scale for the radiance are expressed in photons/sec/cm2. (b) Quantification of bioluminescent signal radiance expressed in photons/sec/cm2 and measures of tumor sizes from histological sections of ear sponges. Data are presented as mean ± SEM, Wilcoxon-Mann-Whitney significance test was used to compare the mean parameter values, *p < 0.05, **p < 0.01, ***p < 0.001, n = 12 sponges per group (6 mice/group). (c) Representative pictures of ex vivo bioluminescent signal of the draining sentinel LNs at week 2 (left panels) and 4 (right panels) post-sponge implantation. Numeric values displayed in the color bar for radiance are expressed in photons/sec/cm2. For positive LNs, a bright field picture of LN is shown below the bioluminescent images. (d) Table of positive LNs incidence at week 2 and 4 post-sponge insertion. “L” represents left mouse ear/LN and “R” refers to right mouse ear/LN, n = 12 LNs per group (6 mice/group).
Figure 4
Figure 4. Immunohistochemical analyses of the primary tumors (mouse ears) after 2 and 4 weeks of sponge implantation.
Control sponges devoid of tumor cells (control) and sponges populated with 1.5 × 105 or 2 × 105 B16F10Luc+ tumor cells were implanted in C57BL/6J mouse ears for 2 (a) or 4 (b) weeks. Lymphatic initial vessels (LYVE-1 positivity, blue staining) and tumor cells (tyrosinase expression, pink staining) were detected by immunohistochemistry, in control ears (sponges soaked with serum-free DMEM without tumor cells) and in ear-bearing primary tumors. Representative pictures are belonging to the central area of the ear sponge. Lower panels in “a” and “b” represent a higher magnification of the region delineated by the square in the upper pictures. Black arrows indicate some representative lymphatic vessels and the dotted black lines in “b” delineate the well-established tumor areas. ESL and ISL indicate the external and internal skin layers in mouse ears, respectively. Asterisk indicates the cartilage in mouse ears. Scale bars represent 500 and 100 μm in the low and high magnification pictures, respectively.
Figure 5
Figure 5. Computerized-assisted 2D image processing.
Sections of the primary tumors (mouse ears) (a) and metastatic LNs (b) were immunostained for lymphatic vessels (LYVE-1 positivity in blue) and tumor cells (tyrosinase positivity in pink) (image 1), and subjected to image processing (images 2–9). (2) Contrast color enhancement using excess transformation. (3–4) Color image decomposition into its grey level components corresponding to (3) tumor (red component) and (4) lymphatic vessels (blue component). (5, 7) Automatic binarization of the (5) tumor and the (7) peritumoral region. (6, 8) Automatic binarization of (6) intratumoral vessels (confined inside the red dotted lines), and (8) peritumoral vessels (confined inside the blue dotted lines). (9) Color image compiling all the previous detected structures (peritumoral area in blue, tumor area in red, peritumoral vessels in light blue and intratumoral vessels in yellow).
Figure 6
Figure 6. Computerized-assisted quantifications of the lymphatic vasculature in the primary tumors.
Sponges devoid of tumor cells (controls) and sponges populated with 1.5 × 105 or 2 × 105 B16F10Luc+ tumor cells were implanted in the mouse ears for 2 (ae) or 4 (fj) weeks. Different parameters were measured on peritumoral and intratumoral areas. (a,f) The lymphatic vessel density (LVD). (b,g) The number of vessel sections per mm2 of specific tissue area. (c,h) The number of vessel sections smaller than a specific size (<2 × 10−2 mm2 or <1 × 10−2 mm2 for peritumoral or intratumoral, respectively). (d,i) The number of vessel sections larger than a specific size (>2 × 10−2 mm2 or >1 × 10−2 mm2 for peritumoral or intratumoral, respectively). (e,j) The normalized number of vessel sections at a distance of 0.45 mm or 0.3 mm from the ear border after 2 weeks or 4 weeks of sponge insertion. Results are expressed as mean ± SEM, and Wilcoxon-Mann-Whitney significance test was used to compare the mean parameter values, *p < 0.05; **p < 0.01; ***p < 0.001, n = 12 sponges per group (6 mice/group).
Figure 7
Figure 7. Immunostainings of lymphatic vessels and tumor cells in the draining sentinel LNs.
Draining sentinel LNs were resected from mice with either control ear sponges or sponges populated with B16F10Luc+ tumor cells. (a) Representative sections, belonging to the central LN region, are shown for control SLN and pre-metastatic SLN after 2 weeks of sponge insertion. (b) 3D reconstruction of the representative control and pre-metastatic SLN shown in (a), with lymphatic vessels in green and tissue border in blue. (c) Representative sections of control SLN and metastatic SLN, belonging to the central LN region, after 4 weeks of sponge implantation. (d) 3D reconstruction of the representative control and metastatic SLN shown in (c), with lymphatic vessels in green, tumor mass in red and tissue border in blue. Right panels in (a) and (c) represent higher magnification pictures of areas delineated by the square. Immunostained lymphatic vessels (LYVE-1 positive) appear in blue and tumor cells (tyrosinase positive) in pink. Black arrows indicate representative lymphatic vessels and the black dotted line delineate the tumor area. Scale bar represents 250 μm. For 3D reconstructions of SLN, around 40 sections were stacked, with a final z-stack thickness of ∼ 200 μm.
Figure 8
Figure 8. Computerized-assisted quantifications of lymphatic vasculature in the draining sentinel LNs.
Quantitative analyses were performed on immunolabeled control and pre-metastatic SLN sections from LNs resected after 2 weeks of sponge implantation (ad), and on immunolabeled control and metastatic SLN dissected after 4 weeks (eh) of sponge insertion. (a,e) The LN tissue section size (mm2) in control SLN (red bar), pre-metastatic SLN (blue bar) and metastatic SLN (green bar). (b,f) The lymphatic vessel density (LVD). (c,g) The lymphatic vessels’ spatial distribution curves from the LN border (distance = 0). (d,h) The histogram corresponds to the number of lymphatic vessel sections at a distance of 0.4 mm from the border of LN. Results are expressed as mean ± SEM, and Wilcoxon-Mann-Whitney significance test was used to compare the averaged parameter values measured for the different groups, *p < 0.05, n = 12 LNs per group (6 mice/group).

References

    1. Alitalo K. The lymphatic vasculature in disease. Nature medicine 17, 1371–1380, doi: 10.1038/nm.2545 (2011). - DOI - PubMed
    1. Paupert J., Sounni N. E. & Noel A. Lymphangiogenesis in post-natal tissue remodeling: lymphatic endothelial cell connection with its environment. Molecular aspects of medicine 32, 146–158, doi: 10.1016/j.mam.2011.04.002 (2011). - DOI - PubMed
    1. Stacker S. A. et al.. Lymphangiogenesis and lymphatic vessel remodelling in cancer. Nature reviews. Cancer 14, 159–172, doi: 10.1038/nrc3677 (2014). - DOI - PubMed
    1. Card C. M., Yu S. S. & Swartz M. A. Emerging roles of lymphatic endothelium in regulating adaptive immunity. The Journal of clinical investigation 124, 943–952, doi: 10.1172/jci73316 (2014). - DOI - PMC - PubMed
    1. Pereira E. R., Jones D., Jung K. & Padera T. P. The lymph node microenvironment and its role in the progression of metastatic cancer. Seminars in cell & developmental biology 38, 98–105, doi: 10.1016/j.semcdb.2015.01.008 (2015). - DOI - PMC - PubMed

Publication types