. 2017 Jan 27:7:41647.
doi: 10.1038/srep41647.

Protective effects of recombinant human cytoglobin against chronic alcohol-induced liver disease in vivo and in vitro

Affiliations

Protective effects of recombinant human cytoglobin against chronic alcohol-induced liver disease in vivo and in vitro

Jian Wen et al. Sci Rep. .

Abstract

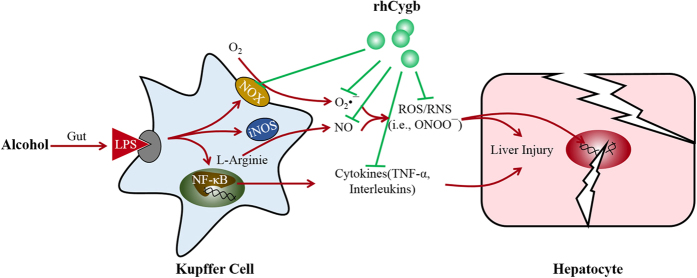
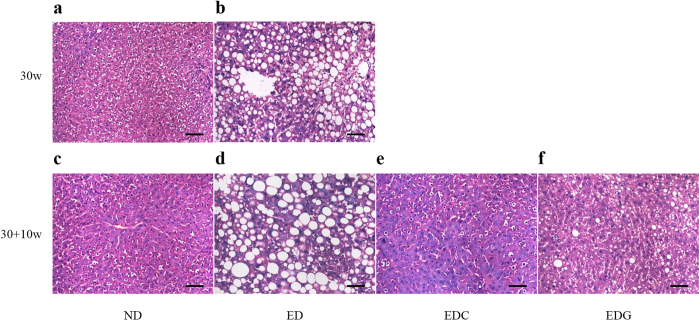
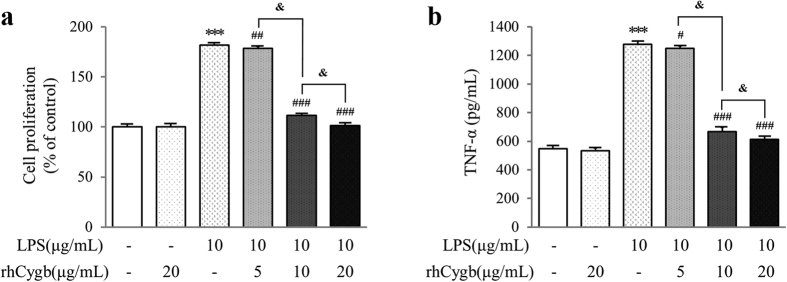
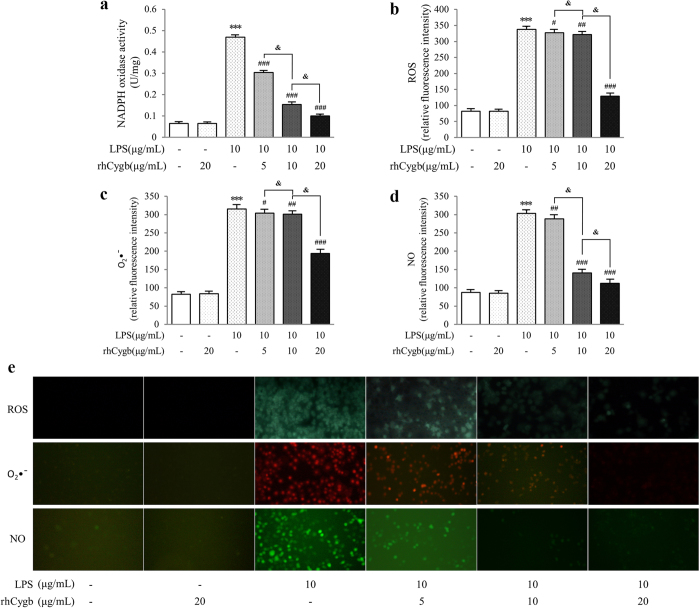
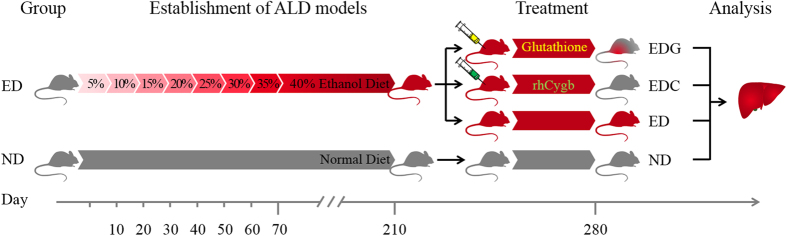
Alcoholic liver disease (ALD) is an important worldwide public health issue with no satisfying treatment available since now. Here we explore the effects of recombinant human cytoglobin (rhCygb) on chronic alcohol-induced liver injury and the underlying mechanisms. In vivo studies showed that rhCygb was able to ameliorate alcohol-induced liver injury, significantly reversed increased serum index (ALT, AST, TG, TC and LDL-C) and decreased serum HDL-C. Histopathology observation of the liver of rats treated with rhCygb confirmed the biochemical data. Furthermore, rhCygb significantly inhibited Kupffer cells (KCs) proliferation and TNF-α expression in LPS-induced KCs. rhCygb also inhibited LPS-induced NADPH oxidase activity and ROS, NO and O2- generation. These results collectively indicate that rhCygb exert the protective effect on chronic alcohol-induced liver injury through suppression of KC activation and oxidative stress. In view of its anti-oxidative stress and anti-inflammatory features, rhCygb might be a promising candidate for development as a therapeutic agent against ALD.


Conflict of interest statement

The authors declare no competing financial interests.

Figures

Figure 1
Figure 1. The potential mechanism of rhCygb on alcohol - induced liver injury.
Kupffer cells activated by gut-derived LPS release ROS, RNS and inflammatory cytokines (e.g., TNF-α), thus give rise to oxidative stress in liver, resulting in lipid peroxidation of cellular membranes and hepatocyte injury and even DNA damage. Based on this working model, rhCygb was employed to prevent or reverse the liver injury. (Supplementary Figure 1)
Figure 2
Figure 2. rhCygb identification profile and biological activity assessment.
(a) SDS-PAGE analysis of rhCygb expression: Lane 1, Protein marker; Lane 2, Induced E. coli cell lysate; Lane 3, Uninduced E. coli cell lysate clone. (b) Purification of rhCygb: Lane 1, Protein marker; Lane 2, Purified protein by sephadex G-25; Lane 3, Purified protein by affinity chromatography. (c) Western blot analysis of purified rhCygb: Lane 1, Protein marker; Lane 2, Purified rhCygb; Lane 3, Cygb knockout cell lysate. (d) Biological activity assessment of rhCygb: The activity of rhCygb was significantly (*P < 0.01) higher than the controls (SIRT2 and PBS) at the same concentrations. (The gel of Fig. 2a,b has been cropped, the full-length gels are presented in Supplementary figure 2a and Fig. 2b. The blot of Fig. 2c has not been cropped, the original blot is presented in Supplementary Figure 2c).
Figure 3
Figure 3. Hepatic histopathological analysis.
Representative photomicrographs of HE staining for observing the morphology of livers from different groups (×200). (a,c) The normal diet (ND) group, normal histoarchitecture of the hepatic tissues. (b,d) The ethanol diet (ED) group, increased hepatocyte steatosis with inflammation and ballooning. (e) The ED + rhCygb (3 mg/kg, EDC) group, decreased fatty degeneration and regeneration in hepatocytes. (f) The ED + glutathione (120 mg/kg, EDG) group, decreased fatty accumulation but extensive ballooning in hepatocytes. The scale bar represents 25 μm.
Figure 4
Figure 4
Inhibition of LPS-induced cell proliferation (a) and TNF-α production (b) by rhCygb. Data are expressed as mean ± S.D. (n = 12). ***P < 0.001 vs. normal control; and #P < 0.05, ##P < 0.01, ###P < 0.001 vs. LPS control; &P < 0.05 vs. 5, 10 μg/mL rhCygb.
Figure 5
Figure 5. Effects of rhCygb on NADPH oxidase activation, ROS, O2 and NO generation in rat Kupffer cells.
(a) NADPH oxidase activity. Cultured KCs were treated with LPS (10 μg/mL) in the presence or absence of variant doses of rhCygb (0, 5, 10 or 20 μg/mL) for 24 h. NADPH oxidase activity was then measured. Data are expressed as mean ± S.D. (n = 6). ***P < 0.001 vs. normal control; ###P < 0.001 vs. LPS control; &P < 0.05 vs. 5, 10 μg/mL rhCygb. (b–e) Intracellular productions of ROS, O2 and NO. Intracellular ROS levels were assessed using a fluorescent probe, DCFH-DA. Fluorescence intensity was detected by multimode reader (b) and observed directly under the fluorescence microscope (e upper panels). The light green fluorescence represented intracellular ROS. Intracellular O2 was detected by a fluorescent probe, DHE. Fluorescence intensity was detected by multimode reader (c) and observed directly under the fluorescence microscope (e, middle panels). The red fluorescence represented intracellular O2. Intracellular NO was detected by a fluorescent probe, DAF-FM DA. Fluorescence intensity was detected by multimode reader (d) and observed directly under the fluorescence microscope (e, lower panels). The green fluorescence represented intracellular NO. Data are expressed as mean ± S.D. (n = 12). ***P < 0.001 vs. normal control; #P < 0.05, ##P < 0.01, ###P < 0.001 vs. LPS control; &P < 0.05 vs. 5, 10 μg/mL rhCygb.
Figure 6
Figure 6. Experimental design of ALD model and animal treatment.
Rats in ED group were administered a liquid diet containing ethanol to establish chronic ALD models. The 5% (v/v) to 35% (v/v) ethanol were supplied for 10 days and the 40% (v/v) concentration for the next 20 weeks. After model was established, they were randomly divided into ED, EDG, and EDC groups for 10 weeks, while the ND group animals received an isocaloric liquid diet containing sugar instead of ethanol throughout the test period. Sera and liver tissues were collected for further analysis.

References

    1. Chiang D. J. & McCullough A. J. The impact of obesity and metabolic syndrome on alcoholic liver disease. Clin Liver Dis. 18, 157–163 (2014). - PMC - PubMed
    1. Ceni E., Mello T. & Galli A. Pathogenesis of alcoholic liver disease: role of oxidative metabolism. World J Gastroenterol. 20, 17756–17772 (2014). - PMC - PubMed
    1. Lelbach W. K. Liver damage in chronic alcoholism: results of a clinical, clinical-chemical and bioptic-histological study in 526 alcoholic patients during a low calorie diet in an open drinking sanatorium. Acta Hepatosplenol. 13, 321–349 (1966). - PubMed
    1. Mann R. E., Smart R. G. & Govoni R. The epidemiology of alcoholic liver disease. Alcohol Res. Health. 27, 209–219 (2003). - PMC - PubMed
    1. Beier J. I. & McClain C. J. Mechanisms and cell signaling in alcoholic liver disease. Biol Chem. 391, 1249–1264 (2010). - PMC - PubMed

Publication types

MeSH terms

LinkOut - more resources