. 2017 Jan 27:8:14242.
doi: 10.1038/ncomms14242.

A Lin28 homologue reprograms differentiated cells to stem cells in the moss Physcomitrella patens

Affiliations

A Lin28 homologue reprograms differentiated cells to stem cells in the moss Physcomitrella patens

Chen Li et al. Nat Commun. .

Abstract

Both land plants and metazoa have the capacity to reprogram differentiated cells to stem cells. Here we show that the moss Physcomitrella patens Cold-Shock Domain Protein 1 (PpCSP1) regulates reprogramming of differentiated leaf cells to chloronema apical stem cells and shares conserved domains with the induced pluripotent stem cell factor Lin28 in mammals. PpCSP1 accumulates in the reprogramming cells and is maintained throughout the reprogramming process and in the resultant stem cells. Expression of PpCSP1 is negatively regulated by its 3'-untranslated region (3'-UTR). Removal of the 3'-UTR stabilizes PpCSP1 transcripts, results in accumulation of PpCSP1 protein and enhances reprogramming. A quadruple deletion mutant of PpCSP1 and three closely related PpCSP genes exhibits attenuated reprogramming indicating that the PpCSP genes function redundantly in cellular reprogramming. Taken together, these data demonstrate a positive role of PpCSP1 in reprogramming, which is similar to the function of mammalian Lin28.


Conflict of interest statement

The authors declare no competing financial interests.

Figures

Figure 1
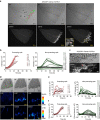
Figure 1. PpCSP1 that shares conserved domains with Lin28 is expressed in protonema apical stem cells.
(a,b) Bright-field (BF) and fluorescence (Citrine) images of chloronemata (a) and caulonemata (b) of the nPpCSP1-Citrine-nosT #136 line. Red and yellow arrows indicate apical stem cells and side branch initial cells, respectively. (c) Alignment of the amino acid sequences of PpCSPs and human Lin28 proteins. PpCSPs and human Lin28 proteins were predicted to contain one CSD (red line) and two CCHC zinc-finger domains (blue lines). Black and grey shades indicate identical amino acids and amino acids with similar characters to the consensus amino acid, respectively. (d) Phylogeny of PpCSP1, Lin28 and related proteins, with a cold-shock domain and zinc-finger domains. The maximum likelihood tree was constructed using amino acid sequences of the proteins. The wag model of amino acid substitution was used. Branch lengths are proportional to the number of substituted residues. Bootstrap probability >50% is indicated on the branches (estimated by 1,000 resampling). The accession numbers and species names are indicated. Colour of the OTU represents the phylogenetic position: Orange, metazoans; blue, eudicots; light purple, monocots; dark purple, other seed plants including gymnosperms and basal angiosperms; green, bryophytes; brown, lycophytes. This is an unrooted tree. The left-most node was chosen for the best match of organism phylogeny. Mammalian Lin28 genes used for the iPSC reprogramming are included in the ‘Lin28 homologue A'. Scale bars, 100 μm (a,b). The scale bar represents the number of amino acid substitutions per site in d.
Figure 2
Figure 2. PpCSP1 is induced in the process of reprogramming.
(a) Expression pattern of PpCSP1-Citrine in an excised leaf of nPpCSP1-Citrine-3′-UTR #1 line. Bright-field (BF) and fluorescent (Citrine) images at 0, 24 and 48 h after cutting are shown. Inset red star and triangle indicate a distal chloronema apical stem cell and a proximal chloronema cell, respectively. All edge cells and several non-edge cells were numbered for quantitative analysis in b. See also Supplementary Movie 1. (b) The intensity of the Citrine signals in each cell of an excised leaf of nPpCSP1-Citrine-3′-UTR #1 (1–25 correspond to cells in the top panel of a). Red and green lines indicate the signal intensity in edge cells that were and were not reprogrammed into stem cells, respectively. Black lines indicate the signal intensity in non-edge cells that were not reprogrammed into stem cells. (c) PpCSP1-Citrine fusion protein localization in excised leaf cells 24 h after cutting of the nPpCSP1-Citrine-3′-UTR #1 line. Red arrow indicates the nucleus. (d) PpCSP1 promoter activity and the protein accumulation during the reprogramming. Bright-field (top), luciferase (middle) and Citrine images (bottom) of an excised leaf of the PpCSP1pro:LUC nPpCSP1-Citrine-3′-UTR #2 line at 0, 24 and 48 h after cutting. Calibration bars were shown for pseudo-colour images of LUC and Citrine, respectively. All edge cells and several non-edge cells are numbered for e,f. See also Supplementary Movie 4. (e,f) The intensity of luciferase (e) and Citrine (f) signals in each cell (indicated by 1–23 in the top left of d) in an excised leaf. Red and green lines indicate the signal intensity in edge cells that were and were not reprogrammed into stem cells, respectively. Black lines indicate the signal intensity in non-edge cells that were not reprogrammed into stem cells. Scale bars, 100 μm (a); 10 μm (c); and 50 μm (d).
Figure 3
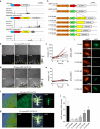
Figure 3. 3′-UTR of PpCSP1 gene has a universal degradation function.
(a) Location of 5′-end of PpCSP1 and PpCSP1-Citrine transcripts in wild-type, nPpCSP1-Citrine-3′-UTR and nPpCSP1-Citrine-nosT lines, respectively, detected by 5′-DGE transcriptome analysis. Sequence reads of full-length mRNAs were mapped around the transcription start site of the gene, and those of degraded mRNAs were mapped to other region of the transcript. (b,d) Bright-field (BF) and sGFP images of an excised leaf of EF1αpro:sGFP-nosT #3 (b) and EF1αpro:sGFP-3′-UTR #18 (d) at 0, 24 and 48 h after cutting. Several edge and non-edge cells are numbered for c,e, respectively. (c,e) The intensity of the sGFP signals in each cell of an excised leaf of EF1αpro:sGFP-nosT #3 (c) and EF1αpro:sGFP-3′-UTR #18 (e) (numbers correspond to cells in the top panels of b,d, respectively). Red and black lines indicate the sGFP intensity in cells that were and were not reprogrammed into stem cells, respectively. (f,g) Bright-field (BF) and fluorescent images of EF1αpro:sGFP-nosT #3 (f) and EF1αpro:sGFP-3′-UTR #18 (g) in protonemata and a gametophore, respectively. (h) Schematic representation of the introduced fragments. Series of the PpCSP1 3′-UTR with different lengths (yellow boxes) were connected to sGFP (green arrows), which is constitutively expressed by the rice Actin 1 promoter (orange arrows). These deletion constructs were introduced into Physcomitrella leaf cells with mRFP (red arrow) fragments (shown at the top) by particle bombardment. (i) Representative cells with mRFP (red) and sGFP (green) signals with constructs shown in h. (j) Ratio of sGFP intensity to co-transformed mRFP intensity in each transformed cell (n=10). Error bars represent s.d. Scale bars, 50 μm (b,d,i); 500 μm (f,g).
Figure 4
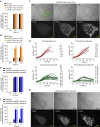
Figure 4. Increased PpCSP1 protein accumulation causes enhanced reprogramming.
(a,b) Percentages of excised leaves with protruding edge cells (a) and protruding non-edge cells (b). Twenty leaves excised from wild type, nPpCSP1-Citrine-nosT (#136 and #142), and nPpCSP1-Citrine-3′-UTR #1 were used for each analysis. Error bars represent s.d. from biological triplicates. ***P<0.001 by two-sided Welch's t-test. (c) Expression pattern of PpCSP1-Citrine in an excised leaf of nPpCSP1-Citrine-nosT #136. Bright-field (BF) and Citrine images at 0, 24 and 48 h after cutting are shown. All edge cells and several non-edge cells are numbered for d. See also Supplementary Movie 5. (d) The intensity of Citrine signals in each cell (numbers correspond to cells in the top panel of c) of an excised leaf of nPpCSP1-Citrine-nosT #136. Red and green lines indicate the intensities of Citrine signals in protruding and non-protruding cells, respectively. (e,f) Percentage of excised leaves with protruding edge cells (e) and protruding non-edge cells (f). Twenty leaves were excised from wild type and PpCSP1pro:PpCSP1-Citrine (#2 and #5). Error bars represent the s.d. from biological triplicates. ***P<0.001 by two-sided Welch's t-test. (g) Expression patterns of PpCSP1-Citrine in an excised leaf of PpCSP1pro:PpCSP1-Citrine #2. BF and Citrine images at 0, 24 and 48 h after cutting are shown. Scale bars, 100 μm (c,g).
Figure 5
Figure 5. Inhibition of reprogramming in quadruple deletion mutants.
(a,b) Percentage of excised leaves with protruding edge cells (a) and protruding non-edge cells (b) in wild type, ppcsp1 #46, ppcsp2 #38, ppcsp3 #48, ppcsp4 #69, ppcsp1 ppcsp2 #4 and ppcsp1 ppcsp2 ppcsp3 #2. Twenty leaves were excised from each line. Error bars represent s.d. of biological triplicates. (c,d) Percentage of excised leaves of wild-type and ppcsp1 ppcsp2 ppcsp3 ppcsp4 (#29 and #44) with tip growth from edge (c) and non-edge cells (d), respectively. Twenty leaves were excised from each line. Error bars represent s.d. of biological triplicates. *P<0.05, **P<0.01 and ***P<0.001 by two-sided Welch's t-test. (e) Hypothetical model of the function of PpCSP1 in the reprogramming. The 3′-UTR represses PpCSP1 expression in both edge and non-edge cells. Signals from wounding are capable of overriding the repression and of effectively increasing PpCSP1 expression, resulting in activation of the reprogramming process.

Similar articles

Cited by

References

    1. Sánchez Alvarado A. & Yamanaka S. Rethinking differentiation: stem cells, regeneration, and plasticity. Cell 157, 110–119 (2014). - PMC - PubMed
    1. Heidstra R. & Sabatini S. Plant and animal stem cells: similar yet different. Nat. Rev. Mol. Cell Biol. 15, 301–312 (2014). - PubMed
    1. Birnbaum K. D. & Sánchez Alvarado A. Slicing across kingdoms: regeneration in plants and animals. Cell 132, 697–710 (2008). - PMC - PubMed
    1. Sugimoto K., Gordon S. P. & Meyerowitz E. M. Regeneration in plants and animals: dedifferentiation, transdifferentiation, or just differentiation? Trends Cell Biol. 21, 212–218 (2011). - PubMed
    1. Steward F., Mapes M. O. & Mears K. Growth and organized development of cultured cells. II. Organization in cultures grown from freely suspended cells. Am. J. Bot. 45, 705–708 (1958).

Publication types

MeSH terms

Substances