. 2017 Jan 27:7:41341.
doi: 10.1038/srep41341.

Multilevel interaction of the DnaK/DnaJ(HSP70/HSP40) stress-responsive chaperone machine with the central metabolism

Affiliations

Multilevel interaction of the DnaK/DnaJ(HSP70/HSP40) stress-responsive chaperone machine with the central metabolism

Fréderic Anglès et al. Sci Rep. .

Abstract

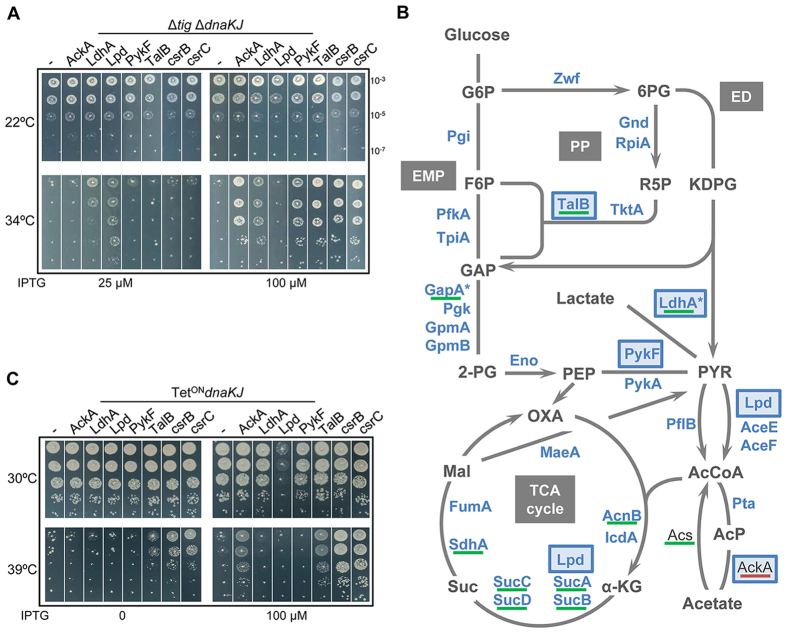
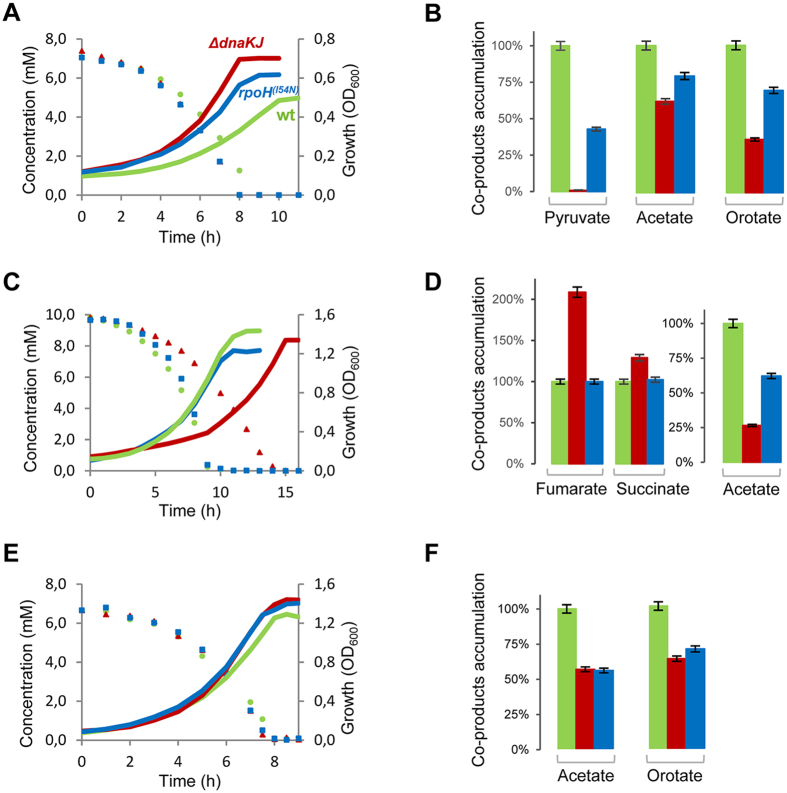
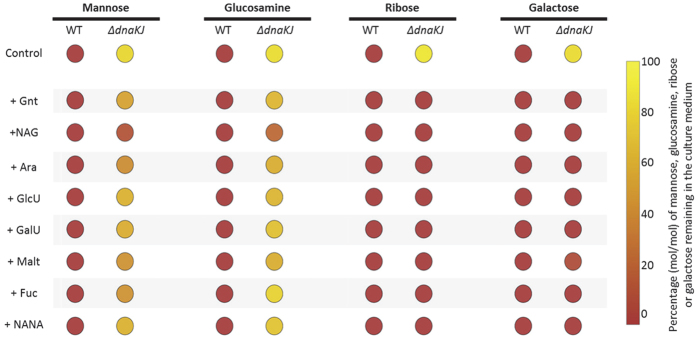
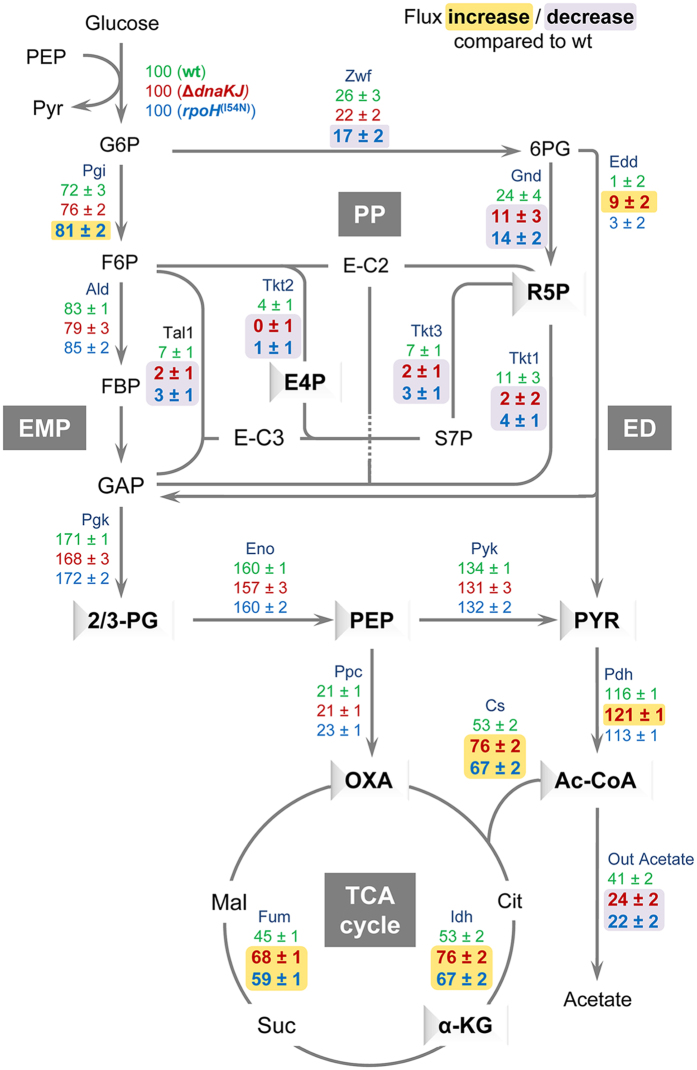
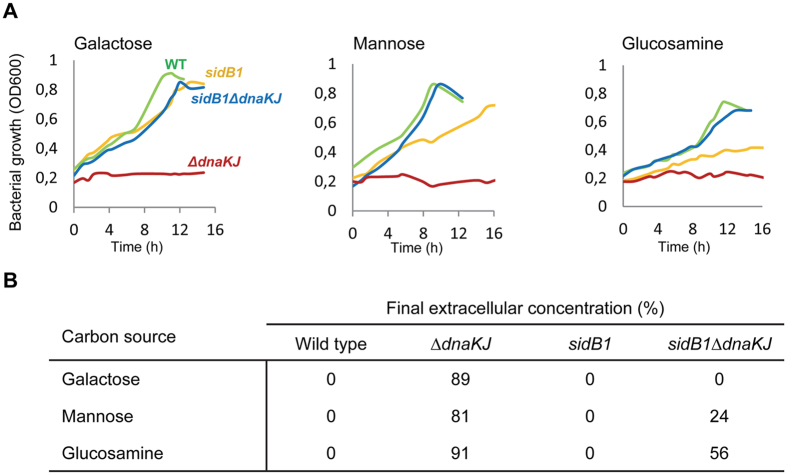
Networks of molecular chaperones maintain cellular protein homeostasis by acting at nearly every step in the biogenesis of proteins and protein complexes. Herein, we demonstrate that the major chaperone DnaK/HSP70 of the model bacterium Escherichia coli is critical for the proper functioning of the central metabolism and for the cellular response to carbon nutrition changes, either directly or indirectly via the control of the heat-shock response. We identified carbon sources whose utilization was positively or negatively affected by DnaK and isolated several central metabolism genes (among other genes identified in this work) that compensate for the lack of DnaK and/or DnaK/Trigger Factor chaperone functions in vivo. Using carbon sources with specific entry points coupled to NMR analyses of real-time carbon assimilation, metabolic coproducts production and flux rearrangements, we demonstrate that DnaK significantly impacts the hierarchical order of carbon sources utilization, the excretion of main coproducts and the distribution of metabolic fluxes, thus revealing a multilevel interaction of DnaK with the central metabolism.


Conflict of interest statement

The authors declare no competing financial interests.

Figures

Figure 1
Figure 1. Central metabolism genes rescue bacterial growth in the absence of major chaperones.
(A) MG1655 Δtig ΔdnaKJ mutant containing plasmid pSE380NcoI vector (−), pSE-AckA, pSE-LdhA, pSE-Lpd, pSE-PykF, pSE-TalB, pSE-csrB or pSE-csrC were grown at 22 °C, serially diluted 10-fold, and spotted on LB ampicillin agar plates with (25 or 100 μM) or without IPTG inducer. Plates were incubated for 1 day at 34 °C or 2 days at 22 °C. (B) Schematic representation of previously identified in vivo DnaK interactors by Calloni and coworkers (2012) within the central metabolic network. Interactors of DnaK are depicted in blue and newly identified suppressors from (A) are highlighted with a dark blue frame. Proteins significantly increased in the ΔdnaK mutant are underlined in green and those significantly decreased in red. Heat-shock proteins are marked with an asterisk. Metabolic network includes the Embden–Meyerhof–Parnas (EMP) pathway, the Pentose Phosphate (PP) pathway, the Entner-Doudoroff (ED) pathway and the Tricarboxylic Acid cycle (TCA cycle). Abbreviations: glucose-6-phosphate (G6P), fructose-6-phosphate (F6P), 6- phosphogluconate (6PG), ribose-5-phosphate (R5P), 2-keto-3-deoxy-6-phospho-gluconate (KDPG), glyceraldehyde-3-phosphate (GAP), 2-phospho-D-glycerate (2-PG), phosphoenolpyruvate (PEP), pyruvate (PYR), acetyl-CoA (AcCoA), acetyl-phosphate (AcP), α-ketoglutarate (α-KG), succinate (Suc), malate (Mal) and oxaloacetate (OXA). (C) Transformants of MG1655 PTetON dnaKJ containing plasmid pSE380NcoI vector, pSE-AckA, pSE-LdhA, pSE-Lpd, pSE-PykF, pSE-TalB, pSE-csrB or pSE-csrC were grown to mid-log phase at 30 °C in LB supplemented with ampicillin and anhydrotetracycline to ensure expression of DnaKJ, serially diluted 10-fold, and spotted on LB ampicillin agar plates with or without IPTG. Note that the anhydrotetracycline inducer was not present in the plates to ensure the repression of the dnaKJ operon. Plates were incubated for 1 day at 30 °C or at 39 °C.
Figure 2
Figure 2. DnaK’s impact on E. coli growth is carbon source-dependent.
(A) Whole cell extracts of MG1655 wild type, ΔdnaKJ and rpoH(I54N) were separated on SDS-PAGE, stained with Coomassie Blue or analyzed by western blot using anti-Lon, -DnaK, -GroEL, -DnaJ or -RpoH antibodies. (B) Heat maps representing the averaged growth rates obtained from three different biological replicates of the three strains grown on 21 carbon sources. The blue scale indicates high (darker) to low (lighter) growth rate. Carbon sources were grouped into five classes each representing a different growth behavior of either the ΔdnaKJ or the rpoH(I54N) mutant compared to the wild type: class I groups carbon sources on which the two mutants did not grow, class II groups carbon sources on which both mutants exhibit higher growth rates than the wild type, class III groups carbon sources on which a growth defect of the dnaKJ mutant is observed, class IV groups carbon sources on which dnaKJ mutant exhibits a lowest rate of growth compared to both the wild-type strain and the rpoH(I54N) mutant and class V groups carbon sources on which no significant difference in growth was observed for both mutants and the wild type. Abbreviations NAG and NANA stand for N-acetyl-glucosamine and N-acetyl-neuraminate, respectively. (C) Representative growth curves of E. coli K-12 MG1655 wild type (green), ΔdnaKJ (red) and rpoH(I54N) (blue) for each class: Glucosamine (class I), Pyruvate (class II), Ribose (class III), Succinate (class IV) and Xylose (class V).
Figure 3
Figure 3. Effect of DnaK on carbon sources utilization and extracellular accumulation of metabolic products.
Growth kinetics and carbon utilization monitored for MG1655 wild type (green), ΔdnaKJ (red) and rpoH(I54N) (blue) grown on lactate (A), malate (C) and glucose (E). Extracellular accumulation of metabolic compounds detected during growth MG1655 wild type (green), ΔdnaKJ (red) and rpoH(I54N) (blue) on lactate (B), malate (D) and glucose (F) corresponds to molar yields (mol of by-products formed/mol of carbon sources consumed) relative to those measured for the wild type. Growth was monitored by optical density measurement at 600 nm (OD600) and compounds in culture supernatant were quantified by 1D 1H-NMR every 30 min.
Figure 4
Figure 4. DnaK-dependent adaptive growth in complex mixture of carbon sources known to be present in intestinal environment.
(A) Carbon sources consumption by MG1655 wild type (left panel), ΔdnaKJ (middle panel) and rpoH(I54N) (right panel) in a chemically defined medium supplemented with 13 carbon nutrients (0.5 g/l each). Carbon sources in culture supernatants were quantified by 1H 1D-NMR. (B) The period of time where consumption of the indicated sugar began and was completed, are depicted by horizontal bars, green for the E. coli K-12 MG1655 wild type, red for ΔdnaKJ mutant and blue for rpoH(I54N)mutant. Abbreviations: gluconate (Gnt), N-acetyl-glucosamine (NAG), galactose (Gal), N-acetyl-neuraminate (NANA), ribose (Rib), arabinose (Ara), mannose (Man), glucuronate (GlcU), galacturonate (GalU), glucosamine (GlcN), maltose (Malt), fucose (Fuc), and acetate (Ac). acetate (C) and orotate (D) concentrations in culture supernatant during growth in the complex mixture of carbon sources and % of extracellular accumulation (mol of by-products formed/mol of carbon sources consumed) relative to those measured for the wild type (left insets).
Figure 5
Figure 5. Mannose, glucosamine, ribose and galactose utilization in presence of one additional carbon source.
Cultures of MG1655 wild type and ΔdnaKJ grown in LB media overnight at 30 °C were washed and transferred in minimal M9 based-medium supplemented with glucose (2.7 g/L). Before cells enter the stationary phase, cells were washed and then inoculated at an initial OD600 of 0.1 in M9 based-medium supplemented with binary mixture of two carbon sources one of which was mannose, glucosamine, ribose or galactose. Concentration of each carbon source in the medium was 1 g/L. Cultivations were performed in triplicate using a bioreactor block in an automatic high throughput fluxomic workstation (Freedom EVO 200, TECAN, Switzerland). Samples of culture supernatants were collected when cells stopped growing and analyzed by 1D 1H NMR, to determine the proportion of mannose, glucosamine, ribose or galactose remaining in the medium. All analyses showed exhaustion of all the others carbon sources. Abbreviations: gluconate (Gnt), N-acetyl-glucosamine (NAG), N-acetyl-neuraminate (NANA), arabinose (Ara), glucuronate (GlcU), galacturonate (GalU), maltose (Malt), fucose (Fuc).
Figure 6
Figure 6. DnaK modulates metabolic flux distribution.
Flux distributions within central metabolism for the three strains: upper values in green, wild type; middle values in red, ΔdnaKJ mutant; lower values in blue, rpoH(I54N)mutant. Underlined values indicate a flux increase (yellow) or decrease (purple) compared to the wild type, respectively. The three different strains were grown at 30 °C in minimal medium supplemented with a mixture of 80% [1-13C] and 20% [U-13C] glucose. All fluxes are presented as a molar percentage of the specific glucose uptake rate. The data are presented as flux ± 95% Confidence Interval (CI), the latter being determined by Monte-Carlo-based sensitivity analysis. Metabolite precursors for amino acid biosynthesis are depicted in relief. Abbreviations: fructose-1,6-bisphosphate (FBP), citrate (Cit), combined pool of 2- and 3-phosphoglycerate (2/3-PG), erythrose-4-phosphate (E4P), sedoheptulose-7-phosphate (S7P), Glucose-6-phosphate 1-dehydrogenase (zwf), Glucose-6-phosphate isomerase (Pgi), 6-phosphogluconate dehydrogenase (Gnd), Phosphogluconate dehydratase (Edd), fructose-bisphosphate aldolase (Ald), Transaldolase (Tal), Transketolase (Tkt), Phosphoglycerate kinase (Pgk), Enolase (Eno), Pyruvate kinase (Pyk), Phosphoenolpyruvate carboxylase (Ppc), Citrate synthase (Cs), Pyruvate dehydrogenase (Pdh), Fumarase (Fum), Isocitrate dehydrogenase (Idh). All the other abbreviations are from Fig. 1
Figure 7
Figure 7. Destabilizing σ32 in the absence of DnaK partially restores growth on class I carbon sources.
(A) Representative growth curves of MG1655 wild type (green), ΔdnaKJ (red), sidB1 (blue) and sidB1 ΔdnaKJ (yellow) on class I carbon sources, namely galactose, mannose, glucosamine. Strains were first grown at 30 °C in minimal M9 medium supplemented with glucose (2.7 g/L). Mid-log phase cultures were washed and then inoculated at an initial OD = 0.2 in M9 medium supplemented with 1 g/L galactose, mannose, glucosamine. Cultivations were performed in triplicate using a bioreactor block in an automatic high throughput fluxomic workstation (Freedom EVO 200, TECAN, Switzerland). (B) Samples of culture supernatants were collected when cells stopped growing and analyzed by 1D 1H NMR, to determine the concentration of each carbon source remaining in the medium.

References

    1. Hartl F. U. Chaperone-assisted protein folding: the path to discovery from a personal perspective. Nat Med 17, 1206–1210, doi: 10.1038/nm.2467 (2011). - DOI - PubMed
    1. Bukau B., Weissman J. & Horwich A. Molecular chaperones and protein quality control. Cell 125, 443–451 (2006). - PubMed
    1. Genevaux P., Georgopoulos C. & Kelley W. L. The Hsp70 chaperone machines of Escherichia coli: a paradigm for the repartition of chaperone functions. Mol. Microbiol. 66, 840–857 (2007). - PubMed
    1. Acebron S. P., Martin I., del Castillo U., Moro F. & Muga A. DnaK-mediated association of ClpB to protein aggregates. A bichaperone network at the aggregate surface. FEBS Lett 583, 2991–2996, doi: 10.1016/j.febslet.2009.08.020 (2009). - DOI - PubMed
    1. Kramer G., Boehringer D., Ban N. & Bukau B. The ribosome as a platform for co-translational processing, folding and targeting of newly synthesized proteins. Nature Structural & Molecular Biology 16, 589–597 (2009). - PubMed

Publication types

MeSH terms