. 2017 Jan 27:8:14237.
doi: 10.1038/ncomms14237.

A tachykinin-like neuroendocrine signalling axis couples central serotonin action and nutrient sensing with peripheral lipid metabolism

Affiliations

A tachykinin-like neuroendocrine signalling axis couples central serotonin action and nutrient sensing with peripheral lipid metabolism

Lavinia Palamiuc et al. Nat Commun. .

Abstract

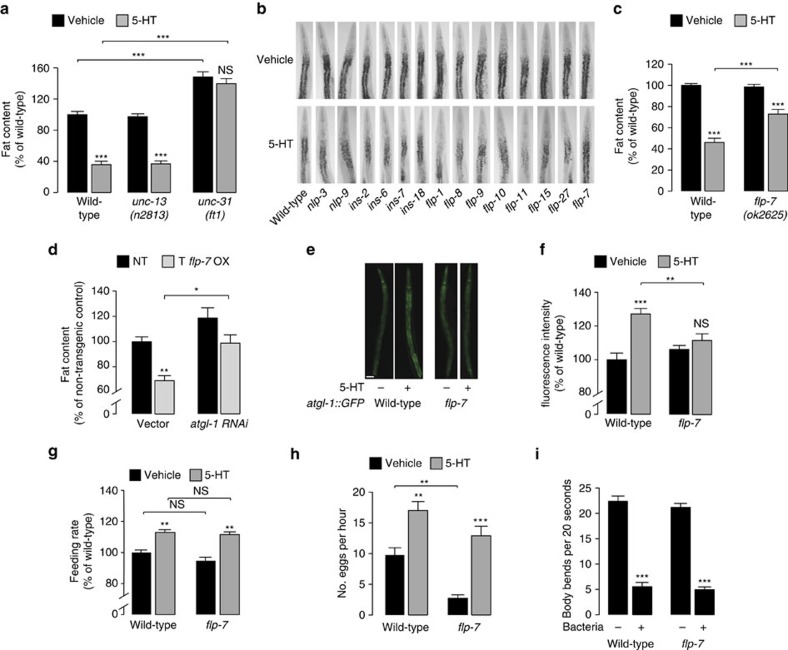
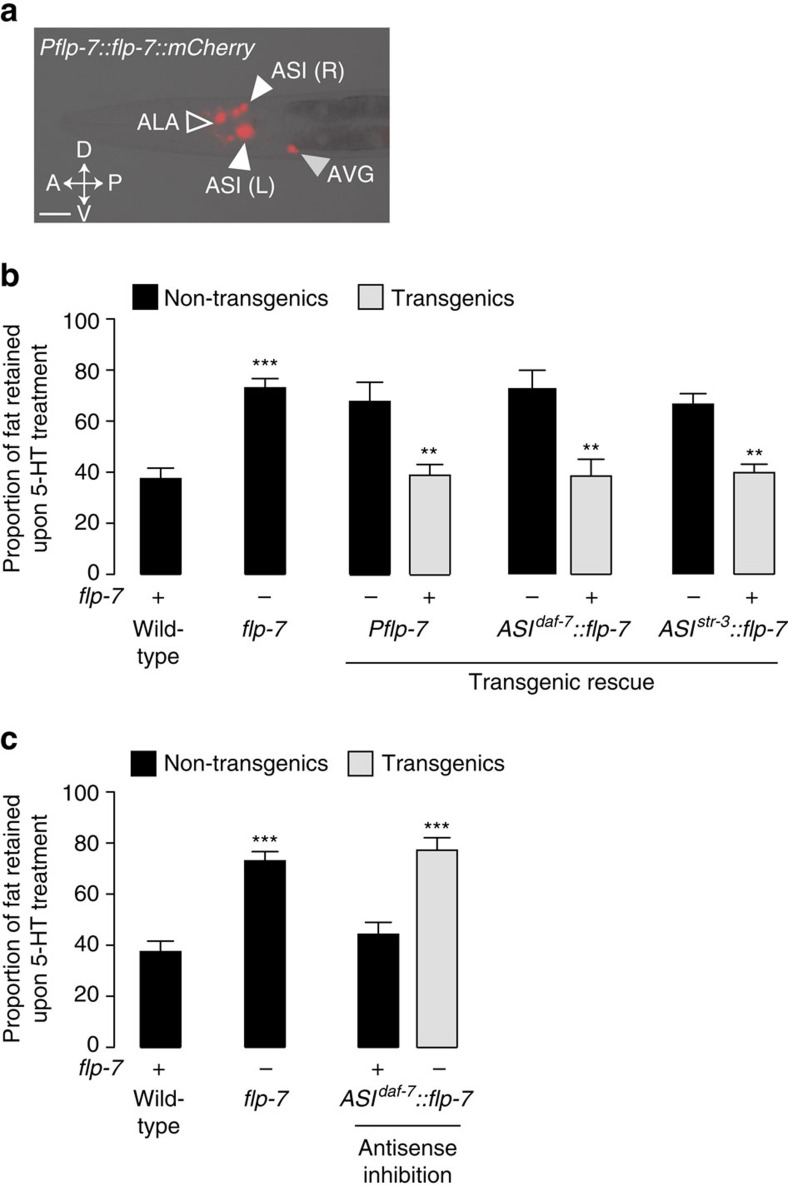
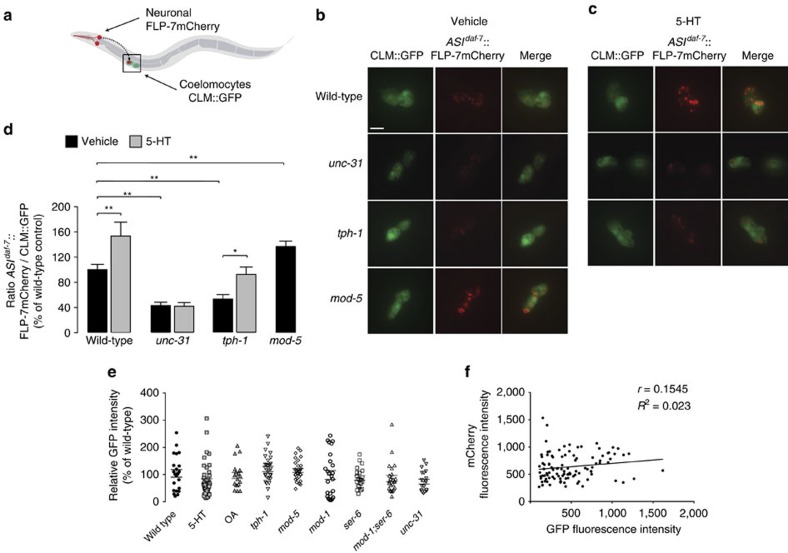
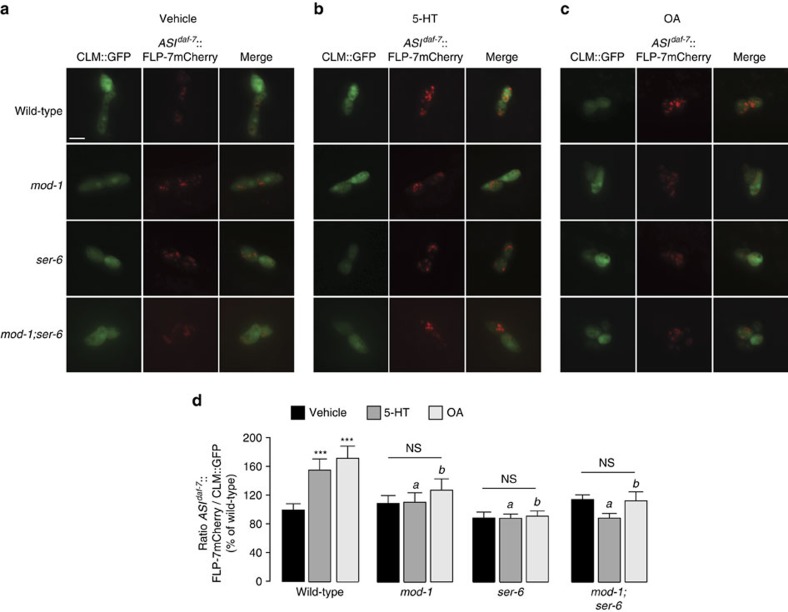
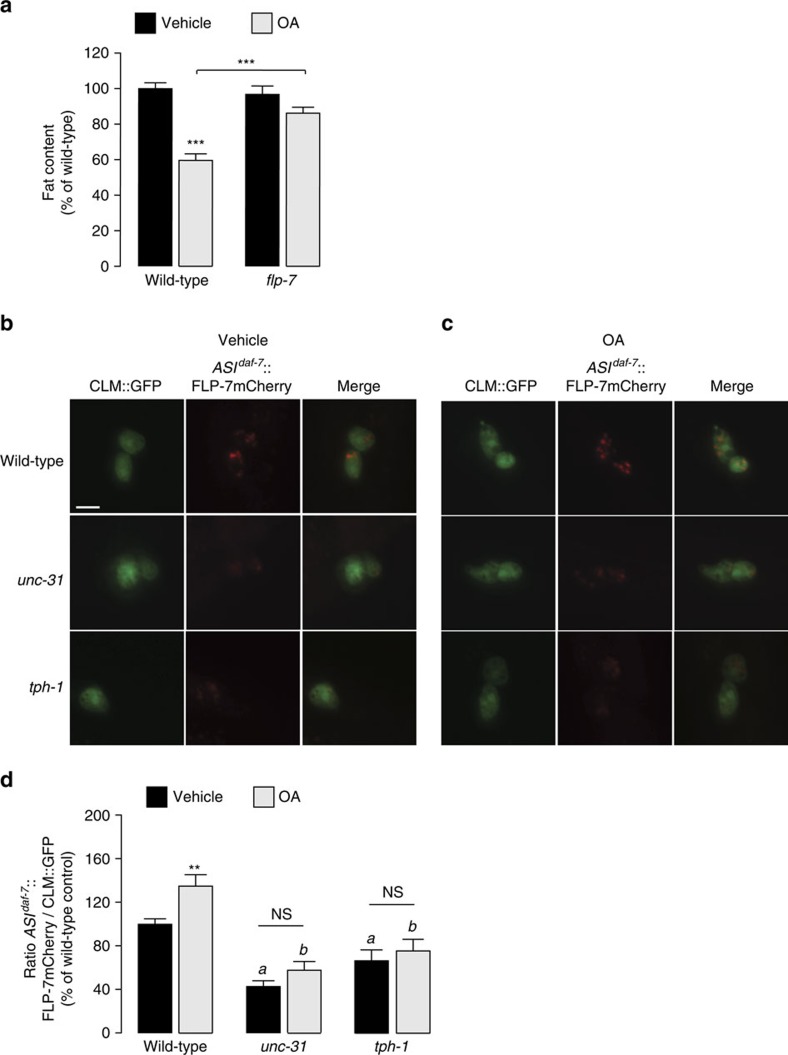
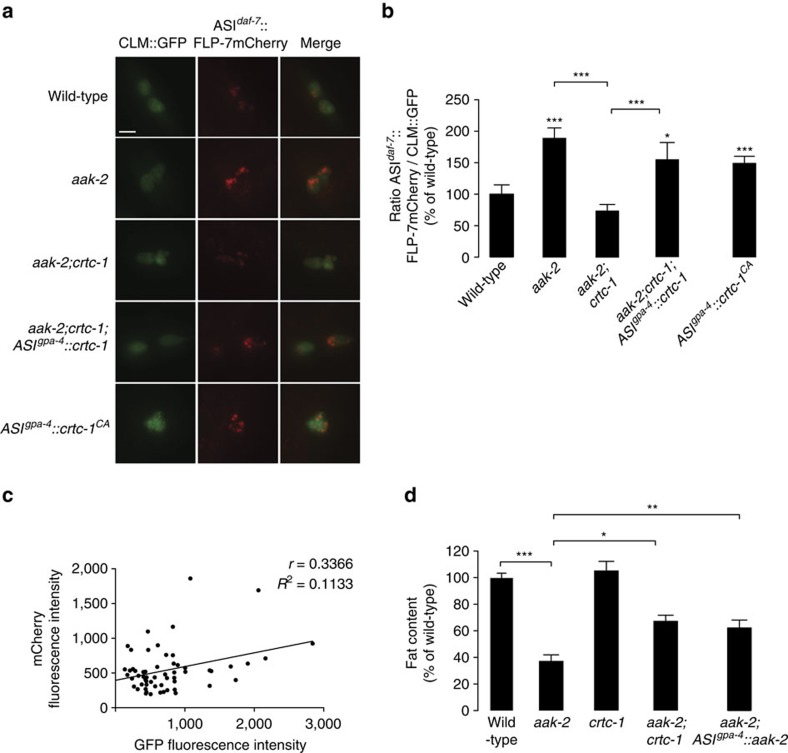
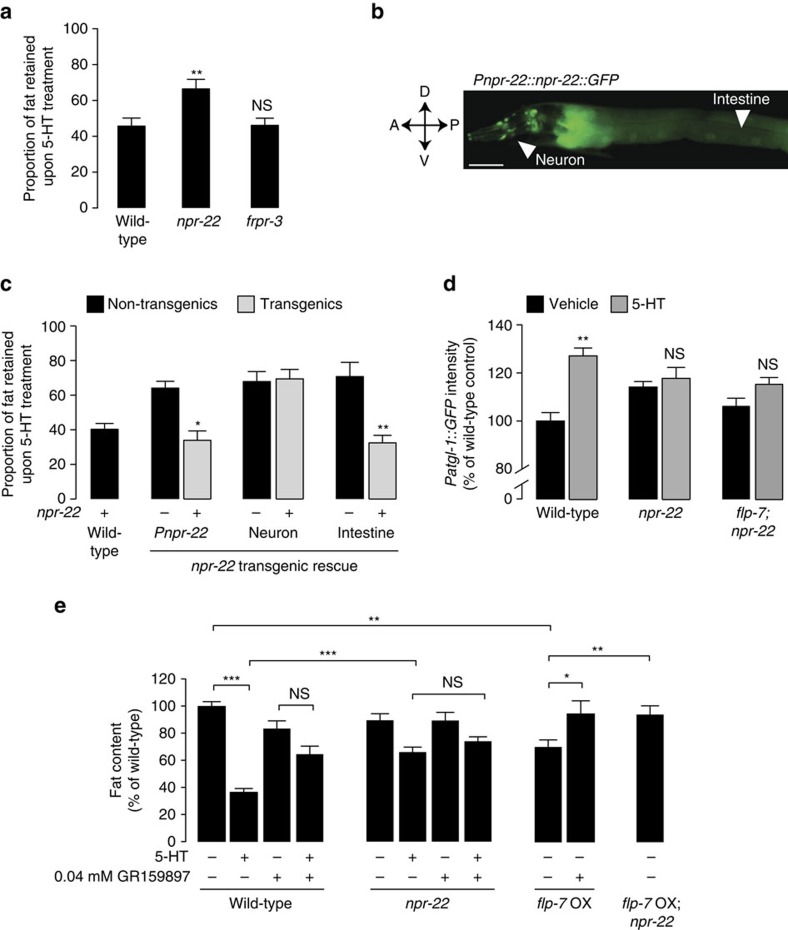
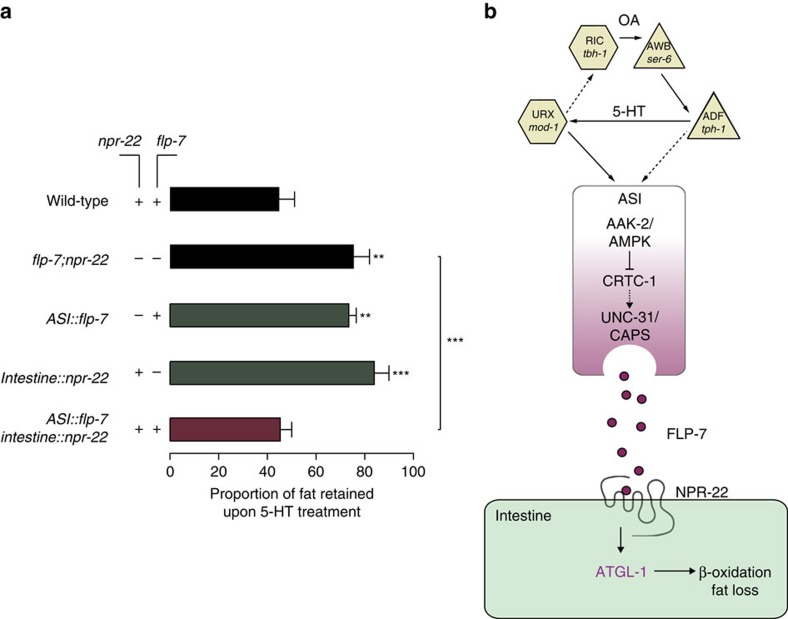
Serotonin, a central neuromodulator with ancient ties to feeding and metabolism, is a major driver of body fat loss. However, mechanisms by which central serotonin action leads to fat loss remain unknown. Here, we report that the FLP-7 neuropeptide and its cognate receptor, NPR-22, function as the ligand-receptor pair that defines the neuroendocrine axis of serotonergic body fat loss in Caenorhabditis elegans. FLP-7 is secreted as a neuroendocrine peptide in proportion to fluctuations in neural serotonin circuit functions, and its release is regulated from secretory neurons via the nutrient sensor AMPK. FLP-7 acts via the NPR-22/Tachykinin2 receptor in the intestine and drives fat loss via the adipocyte triglyceride lipase ATGL-1. Importantly, this ligand-receptor pair does not alter other serotonin-dependent behaviours including food intake. For global modulators such as serotonin, the use of distinct neuroendocrine peptides for each output may be one means to achieve phenotypic selectivity.


Conflict of interest statement

The authors declare no competing financial interests.

Figures

Figure 1
Figure 1. Neuropeptide signalling is required for 5-HT-mediated fat loss.
(a,c) Vehicle- and 5-HT-treated animals were fixed and stained with oil Red O. Genotypes are indicated in the figure. Fat content for each genotype was quantified and expressed as a percentage of vehicle-treated wild-type animals±s.e.m. (n=10–14). ***P<0.001 and NS, not significant by two-way ANOVA. (b) Representative images of vehicle- or 5-HT-treatment, fixed and stained with oil Red O in the indicated genotypes. Animals are oriented facing upwards with the pharynx at the anterior end. Lipid droplets that store body fat are restricted to the intestinal cells. (d) Wild-type animals (black bars) overexpressing the flp-7 transgene (OX; grey bars) grown on vector or atgl-1 RNAi containing bacteria were fixed and stained with oil Red O. Data are expressed as a percentage of body fat in wild-type (non-transgenic) animals±s.e.m. (lower panels; n=11–21). *P<0.05 and **P<0.01 by two-way ANOVA. (e) Representative images of vehicle- and 5-HT-treated wild-type animals and flp-7 mutants bearing an integrated atgl-1::GFP transgene. Scale bar, 50 μm. (f) The fluorescence intensity of atgl-1 expression in vehicle- and 5-HT-treated wild-type animals and flp-7 mutants was quantified and is expressed as a percentage of vehicle-treated wild-type animals±s.e.m. (17–27). **P<0.01, ***P<0.001 and NS, not significant by two-way ANOVA. (g) Feeding rate is expressed as a percentage of vehicle-treated wild-type animals±s.e.m. (n=27). Genotypes are indicated in the figure **P<0.01 and NS, not significant by two-way ANOVA. (h) Egg-laying rates were measured in vehicle- and 5-HT-treated wild-type animals and flp-7 mutants. For each genotype and condition, the average number of eggs laid was counted as described in the methods. Data are expressed as an average±s.e.m. (n=10). **P<0.01 and ***P<0.001, by two-way ANOVA. (i) The number of body bends over a 20-s interval was counted in the presence and absence of the bacterial food sòurce. Data are expressed as an average±s.e.m. (n=10–16). ***P<0.001 by two-way ANOVA.
Figure 2
Figure 2. The tachykinin-related neuropeptide FLP-7 functions in the ASI neurons to regulate 5-HT-induced fat loss.
(a) Fluorescent image of a transgenic animal bearing a polycistronic flp-7::mCherry transgene under the control of the endogenous flp-7 promoter. White arrowheads indicate expression in ASI neurons, the open arrowhead indicates expression in ALA and the grey arrowhead indicates expression in AVG. A, anterior; P, posterior; V, ventral; D, dorsal. Scale bar, 20 μm. (b) Fat content of vehicle- and 5-HT-treated flp-7 mutants bearing a flp-7 transgene using the indicated promoters was measured. Relative to non-transgenic controls, transgenic flp-7 animals bearing the flp-7 transgene under the control of the endogenous flp-7 promoter and the heterologous ASI promoters daf-7 and str-3 restore 5-HT-induced fat loss indistinguishably from wild-type animals. Data are expressed as a proportion of fat retained upon 5-HT treatment±s.e.m. (lower panels; n=8–20). **P<0.01 and ***P<0.001 by two-way ANOVA. (c) flp-7 was inactivated in wild-type animals using RNAi-mediated antisense. Relative to non-transgenic controls, transgenic wild-type animals bearing flp-7 sense-antisense transgenes under the control of the ASI-specific daf-7 promoter suppress 5-HT-induced fat loss, as seen in flp-7 mutants. Data are expressed as a proportion of fat retained upon 5-HT treatment±s.e.m. (lower panels; n=10–24). ***P<0.001 by two-way ANOVA.
Figure 3
Figure 3. The coelomocyte uptake assay allows visualization of FLP-7 secretion in response to serotonergic genes.
(a) Model illustrating the coelomocyte uptake assay for neuropeptide secretion. The FLP-7mCherry fusion protein (marked in red) is expressed from ASI neurons and GFP is expressed in the coelomocytes (marked in green). The ratio of red:green fluorescence is used to quantify the extent of secretion under different experimental conditions. CLM, coelomocytes. (b,c) Representative images of vehicle- and 5-HT-treated wild-type, unc-31, tph-1 and mod-5 animals bearing the FLP-7mCherry and CLM::GFP integrated transgenes, respectively. Left panels, GFP expression in coelomocytes; centre panels, secreted FLP-7mCherry uptake in coelomocytes; right panels (merge). Scale bar, 10 μm. (d) For vehicle- and 5-HT-treated animals bearing integrated FLP-7mCherry and CLM::GFP transgenes, the intensity of FLP-7mCherry fluorescence within a single coelomocyte was quantified and normalized to the area of CLM::GFP expression. Genotypes are indicated in the figure. Data are expressed as a percentage of the normalized FLP-7mCherry fluorescence intensity of vehicle-treated wild-type animals±s.e.m. (n=10–20 animals). *P<0.05 and **P<0.01 by two-way ANOVA. (e) Individual values for the fluorescence intensity of CLM::GFP within a single coelomocyte are shown for each condition. Bars indicate the average value±s.e.m. within each condition. Data are expressed as a percentage of wild-type animals. No significant differences were observed by one-way ANOVA, n=19–46. (f) mCherry fluorescence intensity values are plotted against GFP fluorescence intensity values for each animal across representative experimental conditions, n=103.
Figure 4
Figure 4. FLP-7 secretion in response to 5-HT and OA receptors.
(ac) Representative images of vehicle-, 5-HT- and Octopamine (OA)-treated wild-type, mod-1, ser-6, and mod-1;ser-6 animals bearing integrated FLP-7mCherry and CLM::GFP transgenes, respectively. Left panels, GFP expression in coelomocytes; centre panels, secreted FLP-7mCherry uptake in coelomocytes; right panels (merge). Scale bar, 10 μm. (d) The intensity of FLP-7mCherry fluorescence was quantified and normalized to the area of the CLM::GFP. Genotypes are indicated in the figure. Data are expressed as a percentage of the normalized FLP-7mCherry fluorescence intensity of vehicle-treated wild-type animals±s.e.m. (lower panels; n=11–27). ***P<0.001 and NS, not significant by two-way ANOVA for within-group analyses. (a) P<0.01 by two-way ANOVA compared to 5-HT-treated wild-type animals. (b) P<0.05 by two-way ANOVA compared to OA-treated wild-type animals.
Figure 5
Figure 5. FLP-7 is required for OA-induced fat loss.
(a) Vehicle- or OA-treated wild-type and flp-7 mutant animals were fixed and stained with oil Red O. Fat content was quantified for each genotype and is expressed as a percentage of vehicle-treated wild-type animals±s.e.m. (lower panels; n=11-24). ***P<0.001 by two-way ANOVA. (b,c) Representative images for vehicle- and OA-treated wild-type, unc-31, and tph-1 animals bearing integrated FLP-7mCherry and CLM::GFP transgenes. Left columns, GFP expression in coelomocytes; centre panels, secreted FLP-7mCherry uptake in coelomocytes; right panels (merge). Scale bar, 10 μm. (d) The intensity of FLP-7mCherry fluorescence was quantified and normalized to the area of the CLM::GFP. Data are expressed as a percentage of the normalized FLP-7mCherry fluorescence intensity of vehicle-treated wild-type animals±s.e.m. (lower panels; n=8–27). Within group analyses is represented by **P<0.01; (a) P<0.05 across the vehicle treatment groups (black bars); (b) P<0.001 across the OA treatment groups (grey bars) and NS, not significant; two-way ANOVA used for the statistical comparisons.
Figure 6
Figure 6. The nutrient sensor AAK-2/AMPK regulates FLP-7 release from ASI neurons.
(a) Representative images of wild-type, aak-2, ctrc-1 and aak-2;crtc-1 animals, with the indicated rescuing transgenes in the FLP-7mCherry and CLM::GFP secretion line. Left panels, GFP expression in coelomocytes; centre panels, secreted FLP-7mCherry uptake in coelomocytes; right panels (merge). Scale bar, 10 μm. (b) For vehicle- and 5-HT-treated animals bearing integrated FLP-7mCherry and CLM::GFP transgenes, the intensity of FLP-7mCherry fluorescence within a single coelomocyte was quantified and normalized to the area of CLM::GFP expression. Genotypes are indicated in the figure. Data are expressed as a percentage of the normalized FLP-7mCherry fluorescence intensity of vehicle-treated wild-type animals±s.e.m. (n=10–25 animals). *P<0.05 and **P<0.01, ***P<0.001 by one-way ANOVA. (c) mCherry fluorescence intensity values are plotted against GFP fluorescence intensity values for each animal across representative experimental conditions, n=58. (d) Fat content was quantified in wild-type animals and aak-2, crtc-1, aak-2;crtc-1 mutants and aak-2;crtc-1 mutants bearing a aak-2 transgene the ASI-specific gpa-4 promoter, as indicated. Data are expressed as a proportion of fat retained upon 5-HT treatment±s.e.m. (n=18–20). **P<0.01 and ***P<0.001 by two-way ANOVA.
Figure 7
Figure 7. The GPCR NPR-22/Tachykinin 2 receptor (NK2R) functions as the FLP-7 receptor in the intestine.
(a) Fat content of vehicle- and 5-HT-treated wild-type, npr-22 and frpr-3 animals fixed and stained with oil Red O was quantified. Fat content for each genotype is expressed as a proportion of fat retained upon 5-HT treatment±s.e.m. (lower panels; n=10-13). **P<0.01 and NS, not significant by two-way ANOVA. (b) Fluorescent image of a transgenic animal bearing an npr-22::GFP transgene under the control of the endogenous npr-22 promoter. GFP expression was observed in the intestine and several pairs of neurons in the head. A, anterior; P, posterior; V, ventral; D, dorsal. Scale bar, 50 μm. (c) Fat content of vehicle- and 5-HT-treated wild-type animals and npr-22 mutants fixed and stained with oil Red O was quantified, and is indicated as a proportion of fat retained upon 5-HT treatment. For the transgenic lines bearing npr-22 expression, the promoters used are indicated, and non-transgenic animals are marked as (−) and transgenic animals as (+). The unc-31 promoter was used for expression in neurons and the ges-1 promoter was used for expression in the intestine. Data are expressed as a proportion of fat retained upon 5-HT treatment±s.e.m. (lower panels; n=8–12). *P<0.05 and **P<0.01 by two-way ANOVA. (d) The fluorescence intensity of atgl-1 expression in vehicle- and 5-HT-treated wild-type animals and npr-22 and flp-7;npr-22 mutants bearing an integrated atgl-1::GFP transgene was quantified. The fluorescence intensity is expressed as a percentage of vehicle-treated wild-type animals±s.e.m. (n=17–25). **P<0.01 and ns, not significant by two-way ANOVA. (e) Wild-type animals and npr-22 mutants bearing the flp-7 over-expression (OX) transgene were grown on plates containing either vehicle (10% dimethyl sulfoxide) or the selective NK2R antagonist GR159897 at the indicated concentration. At the completion of development (late L4 stage), animals were transferred to plates containing GR159897 and either vehicle or 5-HT. Fat content was quantified for each condition and is expressed as a percentage of vehicle-treated wild-type animals±s.e.m. (11–20). *P<0.05, **P<0.01, ***P<0.001 and NS, not significant by two-way ANOVA.
Figure 8
Figure 8. FLP-7 and NPR-22 function as a fat regulatory neuroendocrine ligand-receptor pair in vivo.
(a) Fat content was quantified in vehicle- and 5-HT-treated wild-type animals and in flp-7;npr-22 double mutants bearing the flp-7 and/or npr-22 transgenes under the control of the ASI daf-7 or intestinal ges-1 promoters, as indicated. Data are expressed as a proportion of fat retained upon 5-HT treatment±s.e.m. (n=11–26). **P<0.01 and ***P<0.001 by two-way ANOVA. (b) Model depicting the FLP-7/NPR-22 neuroendocrine axis that underlies the 5-HTergic control of body fat loss. In the nervous system, an integrated 5-HT and octopaminergic circuit stimulates body fat loss. In this study, we report the discovery of a tachykinin signalling system that underlies the 5-HTergic control of body fat loss in C. elegans. The FLP-7 neuroendocrine peptide is secreted from the ASI neurons in response to 5-HT and Oct-mediated signalling. The nutrient sensor AAK-2/AMPK acts in the ASI neurons via the CREB co-regulator CRTC-1 to regulate FLP-7 release in response to 5-HT-encoded signals of food availability. Upon release, FLP-7 acts in the intestine via the NPR-22/NK2R receptor to stimulate the ATGL-1 lipase, which drives fat loss. The identification of FLP-7 and NPR-22 addresses a long-standing question about the molecular basis of the central effects of 5-HT on fat loss in peripheral tissues.

References

    1. Noble T., Stieglitz J. & Srinivasan S. An integrated serotonin and octopamine neuronal circuit directs the release of an endocrine signal to control C. elegans body fat. Cell. Metab. 18, 672–684 (2013). - PMC - PubMed
    1. Kong D. et al.. GABAergic RIP-Cre neurons in the arcuate nucleus selectively regulate energy expenditure. Cell 151, 645–657 (2012). - PMC - PubMed
    1. Liu J. et al.. Synphilin-1 alters metabolic homeostasis in a novel Drosophila obesity model. Int. J. Obes. (Lond.) 36, 1529–1536 (2012). - PMC - PubMed
    1. Tecott L. H. Serotonin and the orchestration of energy balance. Cell. Metab. 6, 352–361 (2007). - PubMed
    1. Sze J. Y., Victor M., Loer C., Shi Y. & Ruvkun G. Food and metabolic signalling defects in a C. elegans serotonin-synthesis mutant. Nature 403, 560–564 (2000). - PubMed

Publication types

MeSH terms