

Sulphur cycling in a Neoarchaean microbial mat
- PMID: 28128527
- PMCID: PMC5412852
- DOI: 10.1111/gbi.12227
Sulphur cycling in a Neoarchaean microbial mat
Abstract
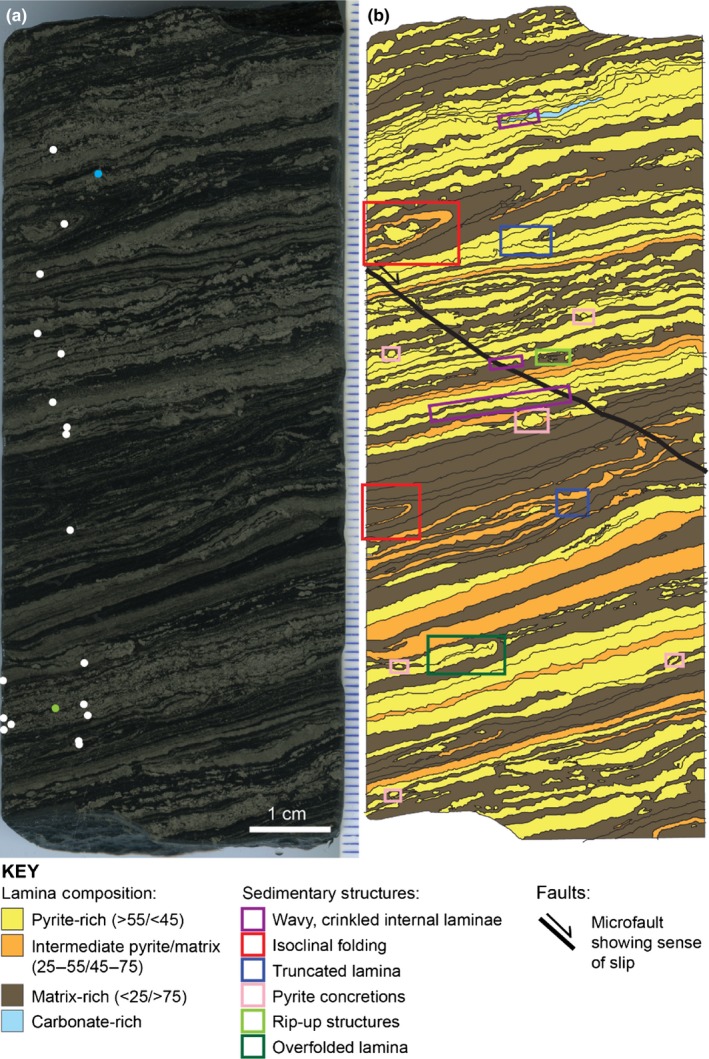
Multiple sulphur (S) isotope ratios are powerful proxies to understand the complexity of S biogeochemical cycling through Deep Time. The disappearance of a sulphur mass-independent fractionation (S-MIF) signal in rocks <~2.4 Ga has been used to date a dramatic rise in atmospheric oxygen levels. However, intricacies of the S-cycle before the Great Oxidation Event remain poorly understood. For example, the isotope composition of coeval atmospherically derived sulphur species is still debated. Furthermore, variation in Archaean pyrite δ34 S values has been widely attributed to microbial sulphate reduction (MSR). While petrographic evidence for Archaean early-diagenetic pyrite formation is common, textural evidence for the presence and distribution of MSR remains enigmatic. We combined detailed petrographic and in situ, high-resolution multiple S-isotope studies (δ34 S and Δ33 S) using secondary ion mass spectrometry (SIMS) to document the S-isotope signatures of exceptionally well-preserved, pyritised microbialites in shales from the ~2.65-Ga Lokammona Formation, Ghaap Group, South Africa. The presence of MSR in this Neoarchaean microbial mat is supported by typical biogenic textures including wavy crinkled laminae, and early-diagenetic pyrite containing <26‰ μm-scale variations in δ34 S and Δ33 S = -0.21 ± 0.65‰ (±1σ). These large variations in δ34 S values suggest Rayleigh distillation of a limited sulphate pool during high rates of MSR. Furthermore, we identified a second, morphologically distinct pyrite phase that precipitated after lithification, with δ34 S = 8.36 ± 1.16‰ and Δ33 S = 5.54 ± 1.53‰ (±1σ). We propose that the S-MIF signature of this secondary pyrite does not reflect contemporaneous atmospheric processes at the time of deposition; instead, it formed by the influx of later-stage sulphur-bearing fluids containing an inherited atmospheric S-MIF signal and/or from magnetic isotope effects during thermochemical sulphate reduction. These insights highlight the complementary nature of petrography and SIMS studies to resolve multigenerational pyrite formation pathways in the geological record.
© 2017 The Authors Geobiology Published by John Wiley & Sons Ltd.
Figures


Similar articles
-
The Neoarchaean surficial sulphur cycle: An alternative hypothesis based on analogies with 20th-century atmospheric lead.Geobiology. 2017 May;15(3):385-400. doi: 10.1111/gbi.12234. Epub 2017 Mar 16. Geobiology. 2017. PMID: 28299862
-
Microscale δ34S and δ18O variations of barite as an archive for fluid mixing and microbial sulphur metabolisms in igneous rock aquifers.Isotopes Environ Health Stud. 2024 Dec;60(6):557-584. doi: 10.1080/10256016.2024.2410293. Epub 2024 Oct 4. Isotopes Environ Health Stud. 2024. PMID: 39365692
-
Environmental insights from high-resolution (SIMS) sulfur isotope analyses of sulfides in Proterozoic microbialites with diverse mat textures.Geobiology. 2018 Jan;16(1):17-34. doi: 10.1111/gbi.12265. Epub 2017 Oct 19. Geobiology. 2018. PMID: 29047210
-
Geological constraints on detecting the earliest life on Earth: a perspective from the Early Archaean (older than 3.7 Gyr) of southwest Greenland.Philos Trans R Soc Lond B Biol Sci. 2006 Jun 29;361(1470):851-67. doi: 10.1098/rstb.2006.1836. Philos Trans R Soc Lond B Biol Sci. 2006. PMID: 16754603 Free PMC article. Review.
-
Microbial impact on polysulfide dynamics in the environment.FEMS Microbiol Lett. 2016 Jun;363(11):fnw103. doi: 10.1093/femsle/fnw103. Epub 2016 Apr 15. FEMS Microbiol Lett. 2016. PMID: 27190288 Review.
Cited by
-
Single-cell analysis reveals an active and heterotrophic microbiome in the Guaymas Basin deep subsurface with significant inorganic carbon fixation by heterotrophs.Appl Environ Microbiol. 2024 Jun 18;90(6):e0044624. doi: 10.1128/aem.00446-24. Epub 2024 May 6. Appl Environ Microbiol. 2024. PMID: 38709099 Free PMC article.
References
-
- Altermann, W. , & Siegfried, H. P. (1997). Sedimentology and facies development of an Archaean shelf: Carbonate platform transition in the Kaapvaal Craton, as deduced from a deep borehole at Kathu, South Africa. Journal of African Earth Sciences, 24, IN1–IN4.
-
- Altermann, W. , & Wotherspoon, J. M. (1995). The carbonates of the Transvaal and Griqualand West Sequences of the Kaapvaal craton, with special reference to the Lime Acres limestone deposit. Mineralium Deposita, 30, 124–134.
-
- Baroni, M. , Thiemens, M. H. , Delmas, R. J. , & Savarino, J. (2007). Mass‐independent sulfur isotopic compositions in stratospheric volcanic eruptions. Science, 315, 84–87. - PubMed
-
- Beukes, N. J. (1987). Facies relations, depositional environments and diagenesis in a major early Proterozoic stromatolitic carbonate platform to basinal sequence, Campbellrand Subgroup, Transvaal Supergroup, Southern Africa. Sedimentary Geology, 54, 1–46.
-
- Bradley, A. S. , Leavitt, W. D. , Schmidt, M. , Knoll, A. H. , Girguis, P. R. , & Johnston, D. T. (2016). Patterns of sulfur isotope fractionation during Microbial Sulfate Reduction. Geobiology, 14, 91–101. - PubMed
Publication types
MeSH terms
Substances
LinkOut - more resources
Full Text Sources
Other Literature Sources
Medical
Molecular Biology Databases
Miscellaneous
