. 2017 Jan 4;25(1):165-180.
doi: 10.1016/j.ymthe.2016.08.001. Epub 2017 Jan 4.

Therapeutic miR-21 Silencing Ameliorates Diabetic Kidney Disease in Mice

Affiliations

Therapeutic miR-21 Silencing Ameliorates Diabetic Kidney Disease in Mice

Malte Kölling et al. Mol Ther. .

Abstract

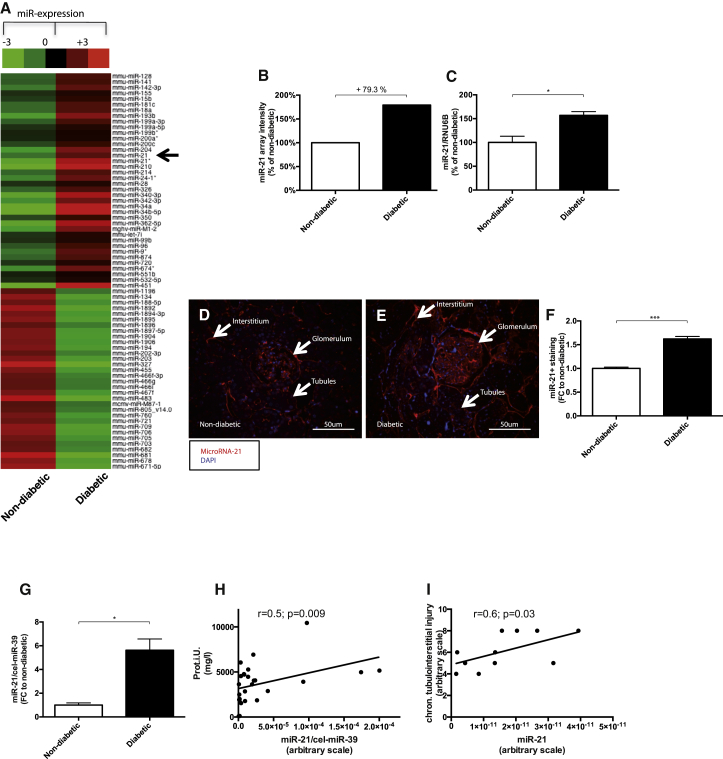
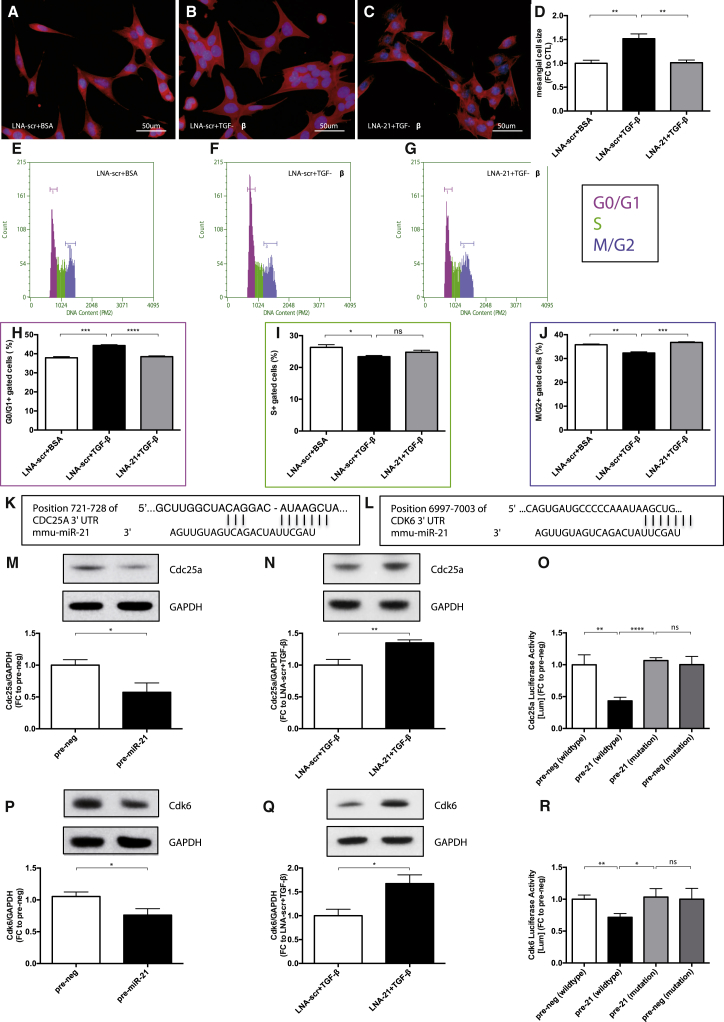
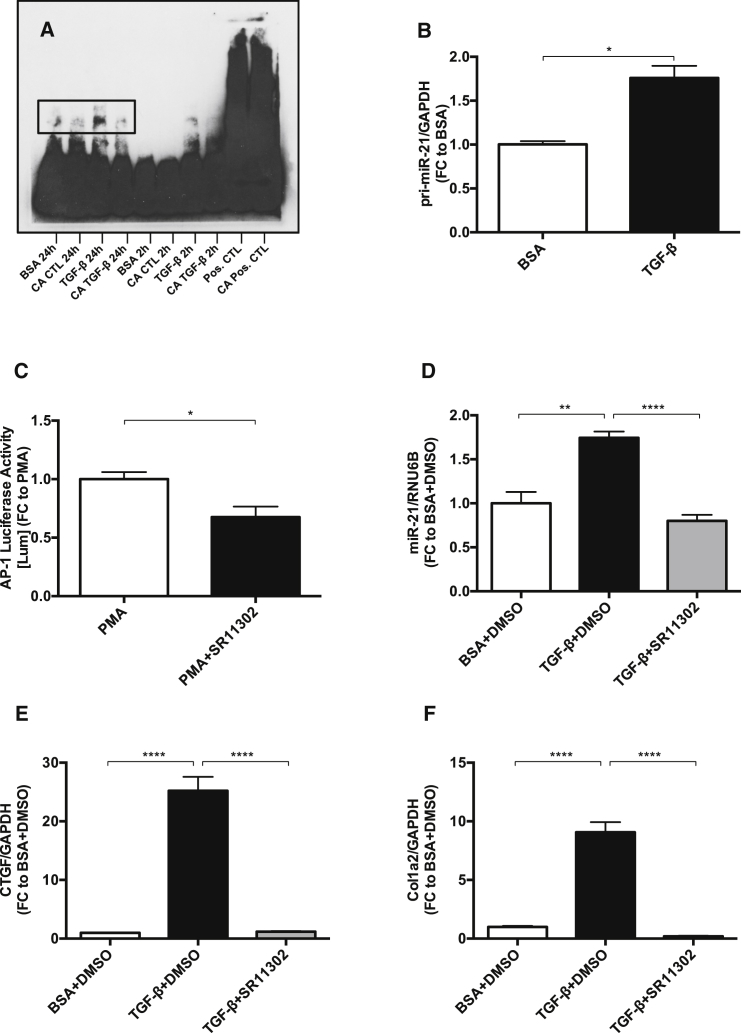
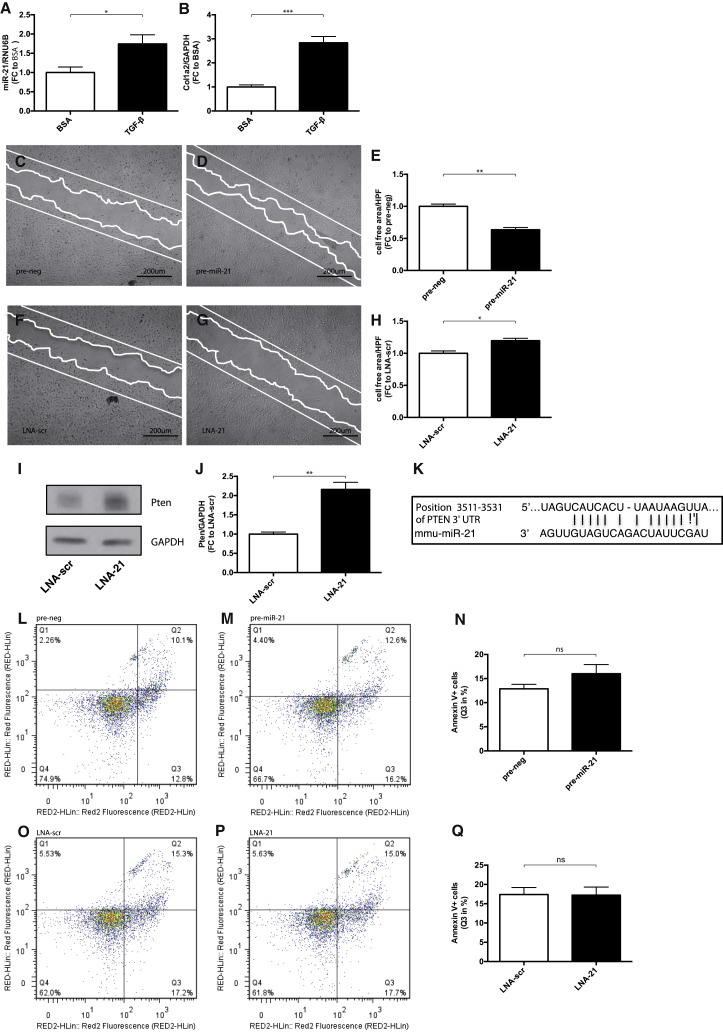
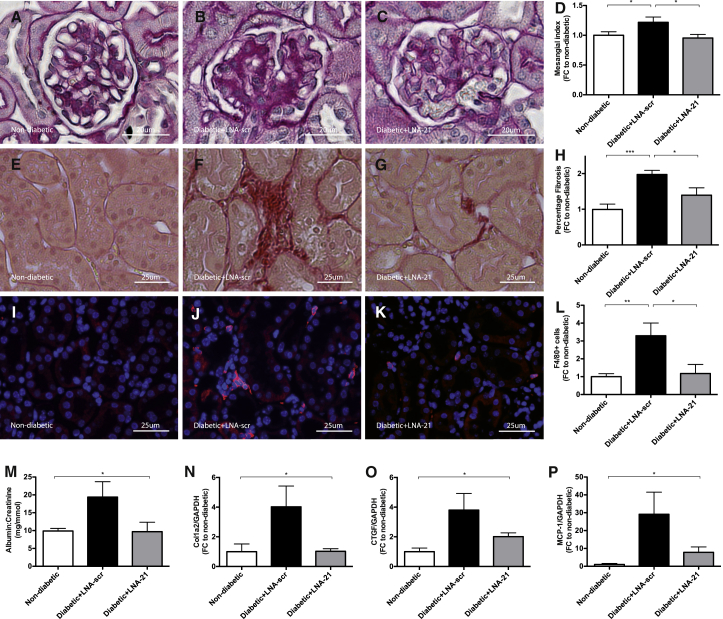
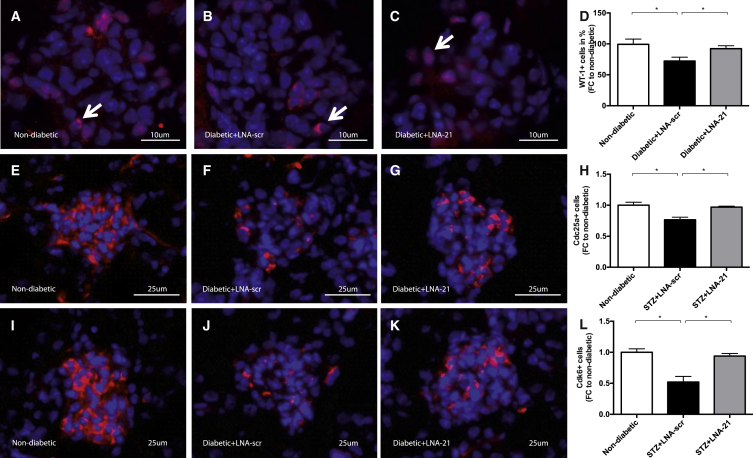
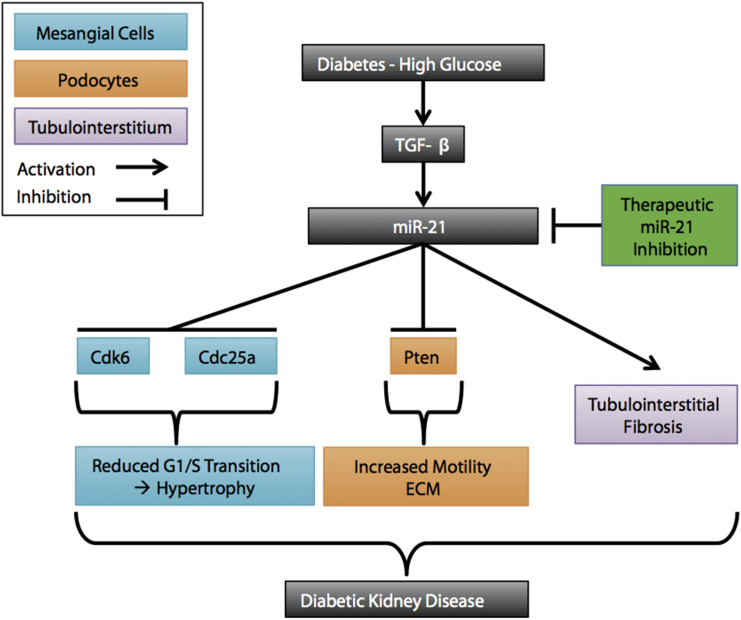
Diabetic nephropathy is the main cause of end-stage renal disease. MicroRNAs are powerful regulators of the genome, and global expression profiling revealed miR-21 to be among the most highly regulated microRNAs in kidneys of mice with diabetic nephropathy. In kidney biopsies of diabetic patients, miR-21 correlated with tubulointerstitial injury. In situ PCR analysis showed a specific enrichment of miR-21 in glomerular cells. We identified cell division cycle 25a (Cdc25a) and cyclin-dependent kinase 6 (Cdk6) as novel miR-21 targets in mesangial cells. miR-21-mediated repression of Cdc25a and Cdk6 resulted in impaired cell cycle progression and subsequent mesangial cell hypertrophy. miR-21 increased podocyte motility by regulating phosphatase and tensin homolog (Pten). miR-21 antagonism in vitro and in vivo in streptozotocin-induced diabetic mice decreased mesangial expansion, interstitial fibrosis, macrophage infiltration, podocyte loss, albuminuria, and fibrotic- and inflammatory gene expression. In conclusion, miR-21 antagonism rescued various functional and structural parameters in mice with diabetic nephropathy and, thus, might be a viable option in the treatment of patients with diabetic kidney disease.

Keywords: TGF-β; cell-cycle regulators; diabetic nephropathy; mesangial hypertrophy; miR-21; microRNA; podocyte motility.


Figures

Figure 1
Figure 1
miR-21 in Diabetic Mice and Diabetic Patients (A and B) miRNA-array analysis: arrow indicates miR-21 (A), miR-21 array quantification (B), and qPCR validation of miR-21 (C). miR-21 visualization by in situ PCR on kidney sections of non-diabetic (D) and diabetic (E) mice. (F) Quantification of in situ PCR miR-21 positive (red) staining. (G) Serum miR-21 expression is increased in diabetic patients compared to healthy controls. (H) Urinary miR-21 expression correlated with proteinuria in diabetic patients. (I) miR-21 expression in human kidney biopsies of diabetic patients correlated with chronic tubulointerstitial injury (percentage of injury was translated into the following arbitrary scale for further correlation studies: 1%–10% = 1; 11%–20% = 2; 21%–30% = 3; 31%–40% = 4; 41%–50% = 5; 51%–60% = 6; 61%–70% = 7; 71%–80% = 8; 81%–90% = 9; 91%–100% = 10) (I). *p < 0.05; **p < 0.01; ***p < 0.001; ****p < 0.0001.
Figure 2
Figure 2
Mesangial Cell Hypertrophy Is Induced by miR-21-Mediated Repression of Cdc25a and Cdk6 (A and B) Mesangial cell hypertrophy displayed by F-actin staining (red) after transfection with LNA-scr and either BSA (A) as control (LNA-scr+BSA) or TGF-β (B) treatment (LNA-scr+TGFβ). (C) Inhibition of miR-21 by transfection of LNA-21 and additional TGF-β treatment (LNA-21+TGFβ). (D) Quantification of the cell size measurements (n = 5 each). (E–G) DNA histograms showing mesangial cells detected in G0/G1, S, or M/G2 phase of the cell cycle after LNAscr+BSA (E), LNA-scr+TGF-β (F), and LNA-21+TGF-β (G). (H–J) Quantification of cells detected in G0/G1 phase (H), S phase (I), and M/G2 phase (J) (n = 4). (K and L) Predicted consequential pairing of Cdc25a target region and miR-21 (K) and of Cdk6 target region and miR-21 (L), respectively (http://www.targetscan.org). (M and P) Western blot (WB) analysis of cytosolic Cdc25a (M) and Cdk6 (P) after overexpression of miR-21 by transfection with precursor-miR21 (pre-miR-21) in comparison to a scrambled control (pre-neg) oligonucleotide (n = 3). (N and Q) Western blot (WB) analysis of cytosolic Cdc25a (N) and Cdk6 (Q) after LNA-scr+TGFβ and LNA-21+TGFβ (n = 3). (O and R) Validation of miR-21 targeting Cdc25a (O) and Cdk6 (R) by Luciferase activity in relation to β-galactosidase activity after overexpression of miR-21 by transfection with pre-miR-21 in comparison to pre-neg with either wild-type or mutated target sites of Cdc25a and Cdk6 (n = 3). *p < 0.05; **p < 0.01; ***p < 0.001; ****p < 0.0001.
Figure 3
Figure 3
AP-1 as Key Transcriptional Activator of miR-21 in Mesangial Cells (A) Electrophoretic mobility shift assay showing AP-1 activation as an AP-1/DNA complex (shifted band) after TGF-β treatment for 2 hr and 24 hr. (B) Every treatment was assessed in comparison to a competition assay (CA), respectively. qPCR quantification of primary-miR-21 after TGF-β treatment (n = 3). (C) AP-1 Luciferase activity in relation to β-galactosidase activity after an initial increase of AP-1 activity by phorbol myristate acetate (PMA) and subsequent AP-1 inhibition by synthetic retinoid 11302 (SR11302) (n = 4). (D–F) qPCR quantification of miR-21 (D), CTGF (E), and Col1a2 (F) after co-treatment with TGF-β and SR11302 (n = 4). *p < 0.05; **p < 0.01; ***p < 0.001; ****p < 0.0001.
Figure 4
Figure 4
miR-21-Mediated Podocyte Phenotype (A and B) qPCR quantification of miR-21 (A) and Col1a2 (B) after TGF-β treatment (n = 5). (C–H) Scratch migration for 8 hr in podocytes after pre-miR-21 treatment compared to pre-neg (C and D) and LNA-21 treatment compared to LNA-scr (F-G); quantification of the cell free area after 8 hr migration (E and H) (n = 6). (I and J) Western blot analysis of Pten after LNA-21 treatment compared to LNA-scr. (K) Predicted consequential pairing of Pten target region and miR-21 (miRTaBase). (L–Q) Annexin V apoptosis staining and FACS analysis of cells undergoing early apoptosis (quadrant 3 = Q3) after pre-miR-21 treatment compared to pre-negative controls (L–N) and LNA-21 treatment compared to LNA-scr (O–Q). RED fluorescence detects the level of cell viability using 7-amino actinomycin D (7-AAD), RED2 fluorescence represents annexin V positivity. *p < 0.05; **p < 0.01; ***p < 0.001; ****p < 0.0001.
Figure 5
Figure 5
Molecular Therapeutic Inhibition of miR-21 Reduced Structural Complications in Diabetic Mice Histological evaluation of therapeutic miR-21 inhibition in diabetic (STZ) mice. (A–D) Mesangial index analysis after periodic acid Schiff (PAS) staining in non-diabetic mice (A), diabetic mice with LNA-scrambled (B), and LNA-21 treatment (C) as well as quantification of results (D). (E–I) Detection of interstitial collagen by Sirius Red staining in non-diabetic mice (E), diabetic mice with LNA-scrambled (F), and LNA-21 treatment (G) as well as quantification of results (H). (I–L) Analysis of F4/80 (red) positive macrophage infiltration in non-diabetic mice (I), diabetic mice with LNA-scrambled (J), and LNA-21 treatment (K) as well as quantification of results (L). (M–P) Urinary albumin:creatinine ratio (M), qPCR quantification of Col1a2 (N), CTGF (O) and MCP-1 (P) in non-diabetic control mice as well as diabetic mice subjected to LNA-21 and LNA-scr treatment. Non-diabetic mice, n = 10. Diabetic (STZ) mice treated with LNA-scr, n = 6. Diabetic (STZ) mice treated with LNA-21, n = 5. *p < 0.05; **p < 0.01; ***p < 0.001; ****p < 0.0001.
Figure 6
Figure 6
Molecular Therapeutic Inhibition of miR-21 Reduced Functional Complications in Diabetic Mice (A–D) Determination of WT-1 (red) positive podocyte loss in non-diabetic mice (A), diabetic mice with LNA-scrambled (B), and LNA-21 treatment (C) as well as quantification of results (D). (E–H) Cdc25a immunofluorescence staining in non-diabetic mice (E), diabetic mice with LNA-scrambled (F), and LNA-21 treatment (G) as well as quantification of results (H). (I–L) Cdk6 immunofluorescence staining in non-diabetic mice (I), diabetic mice with LNA-scrambled (J), and LNA-21 treatment (K) as well as quantification of results (L). Non-diabetic mice, n = 10. Diabetic (STZ) mice treated with LNA-scr, n = 6. Diabetic (STZ) mice treated with LNA-21, n = 5. *p < 0.05; **p < 0.01; ***p < 0.001; ****p < 0.0001.
Figure 7
Figure 7
Summary of the Main Results High glucose under diabetic conditions leads to an increase in TGF-β. miR-21 targets Cdc25a and Cdk6 in mesangial cells (turquoise), leading to mesangial cell hypertrophy by inducing a G1-phase arrest. miR-21 targets Pten, leading to increased podocyte motility and extracellular matrix production (orange). miR-21 leads to extracellular matrix accumulation (purple). These mechanisms contribute to diabetic kidney disease. miR-21 silencing ameliorates these phenomena.

References

    1. Raptis A.E., Viberti G. Pathogenesis of diabetic nephropathy. Exp. Clin. Endocrinol. Diabetes. 2001;109(Suppl 2):S424–S437. - PubMed
    1. Fineberg D., Jandeleit-Dahm K.A., Cooper M.E. Diabetic nephropathy: diagnosis and treatment. Nat. Rev. Endocrinol. 2013;9:713–723. - PubMed
    1. Sarnak M.J., Levey A.S., Schoolwerth A.C., Coresh J., Culleton B., Hamm L.L., McCullough P.A., Kasiske B.L., Kelepouris E., Klag M.J., American Heart Association Councils on Kidney in Cardiovascular Disease, High Blood Pressure Research, Clinical Cardiology, and Epidemiology and Prevention Kidney disease as a risk factor for development of cardiovascular disease: a statement from the American Heart Association Councils on Kidney in Cardiovascular Disease, High Blood Pressure Research, Clinical Cardiology, and Epidemiology and Prevention. Circulation. 2003;108:2154–2169. - PubMed
    1. Lorenzen J.M., Haller H., Thum T. MicroRNAs as mediators and therapeutic targets in chronic kidney disease. Nat. Rev. Nephrol. 2011;7:286–294. - PubMed
    1. Kato M., Zhang J., Wang M., Lanting L., Yuan H., Rossi J.J., Natarajan R. MicroRNA-192 in diabetic kidney glomeruli and its function in TGF-beta-induced collagen expression via inhibition of E-box repressors. Proc. Natl. Acad. Sci. USA. 2007;104:3432–3437. - PMC - PubMed

Publication types

MeSH terms