. 2017 Jan 4;25(1):24-43.
doi: 10.1016/j.ymthe.2016.10.014. Epub 2017 Jan 4.

CRISPR/Cas9-Induced (CTG⋅CAG)n Repeat Instability in the Myotonic Dystrophy Type 1 Locus: Implications for Therapeutic Genome Editing

Affiliations

CRISPR/Cas9-Induced (CTG⋅CAG)n Repeat Instability in the Myotonic Dystrophy Type 1 Locus: Implications for Therapeutic Genome Editing

Ellen L van Agtmaal et al. Mol Ther. .

Abstract

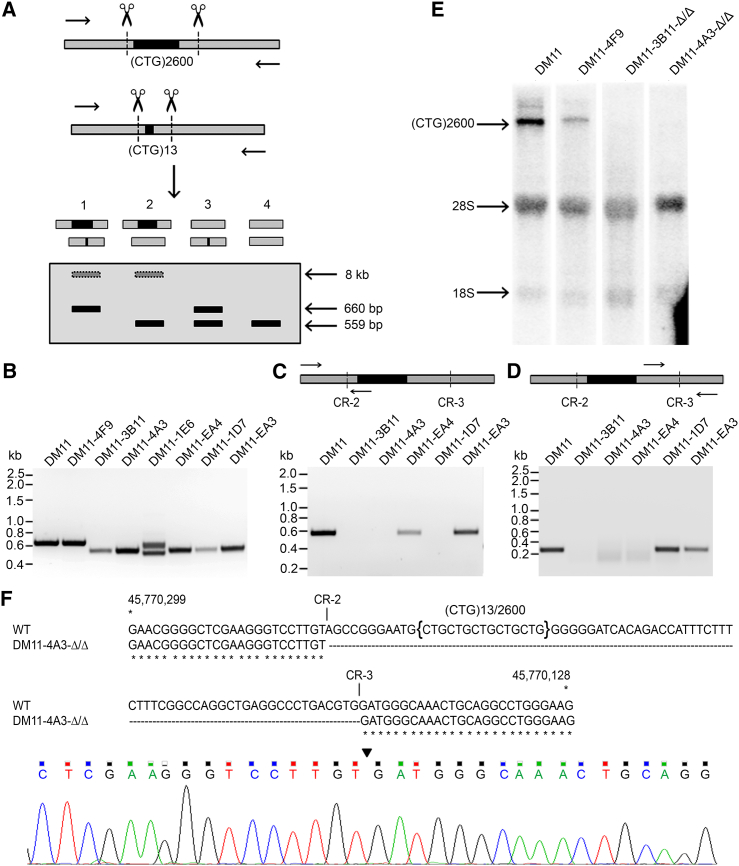
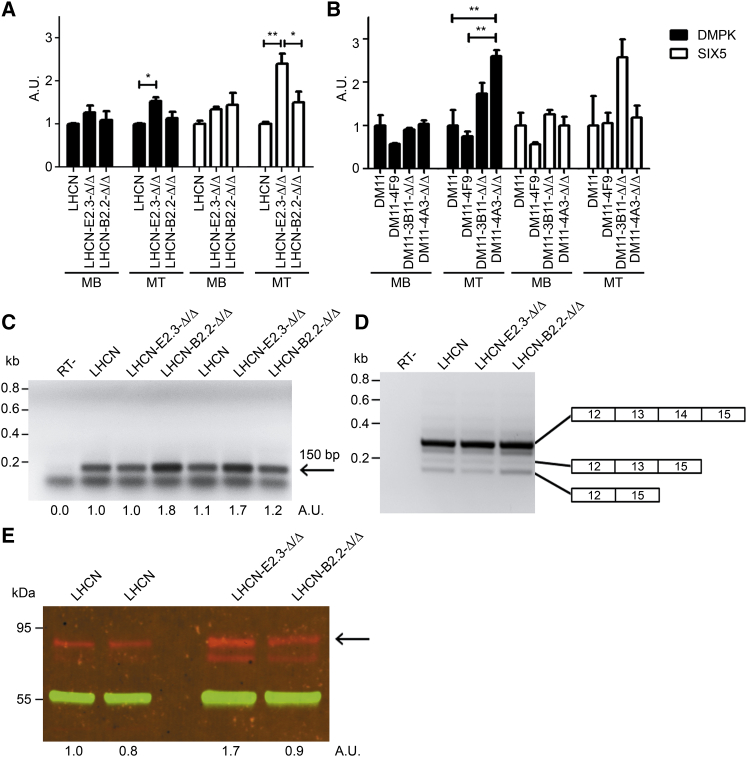
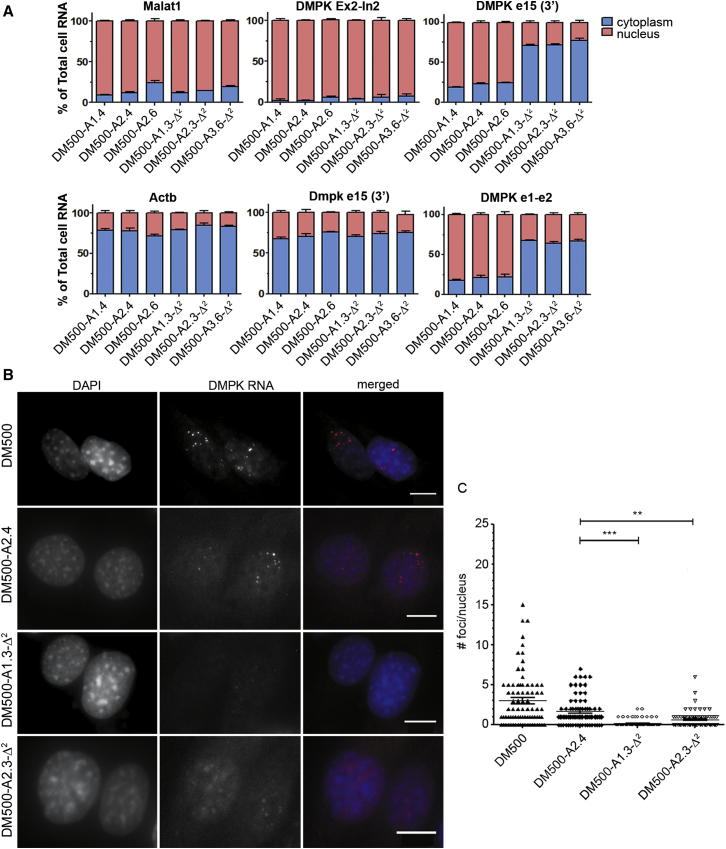
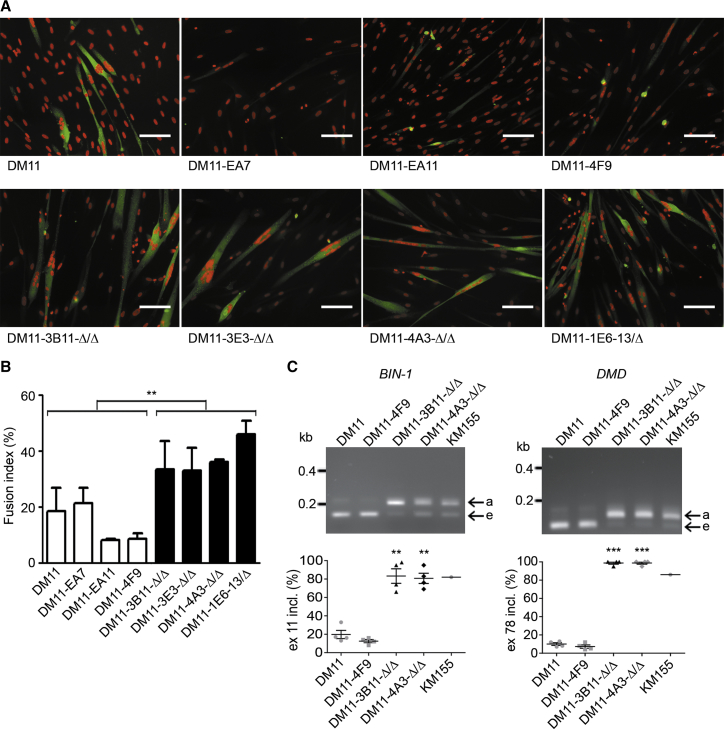
Myotonic dystrophy type 1 (DM1) is caused by (CTG⋅CAG)n-repeat expansion within the DMPK gene and thought to be mediated by a toxic RNA gain of function. Current attempts to develop therapy for this disease mainly aim at destroying or blocking abnormal properties of mutant DMPK (CUG)n RNA. Here, we explored a DNA-directed strategy and demonstrate that single clustered regularly interspaced short palindromic repeats (CRISPR)/Cas9-cleavage in either its 5' or 3' unique flank promotes uncontrollable deletion of large segments from the expanded trinucleotide repeat, rather than formation of short indels usually seen after double-strand break repair. Complete and precise excision of the repeat tract from normal and large expanded DMPK alleles in myoblasts from unaffected individuals, DM1 patients, and a DM1 mouse model could be achieved at high frequency by dual CRISPR/Cas9-cleavage at either side of the (CTG⋅CAG)n sequence. Importantly, removal of the repeat appeared to have no detrimental effects on the expression of genes in the DM1 locus. Moreover, myogenic capacity, nucleocytoplasmic distribution, and abnormal RNP-binding behavior of transcripts from the edited DMPK gene were normalized. Dual sgRNA-guided excision of the (CTG⋅CAG)n tract by CRISPR/Cas9 technology is applicable for developing isogenic cell lines for research and may provide new therapeutic opportunities for patients with DM1.

Keywords: (CTG⋅CAG)n repeat; CRISPR/Cas9; DM1 myoblasts; NHEJ; dsDNA break repair; myotonic dystrophy; somatic cell therapy; therapeutic genome editing; trinucleotide instability.


Figures

Figure 1
Figure 1
CRISPR Design (A) Schematic overview of CRISPR/Cas9 target sites across part of the 3′ UTR in DMPK exon 15. The (CTG⋅CAG)n repeat is indicated in black, and flanking regions in the DMPK gene are in gray. Using different web tools, multiple candidate gRNA target sequences were identified upstream and downstream of the repeat. Positions of guide RNA target sites are displayed by arrows in different colors, representing a good (red), average (blue), or poor (yellow) utility score. Target sites that were chosen for further experiments are encircled and numbered as CRISPR-1, CRISPR-2, etc., in the text. (B) Schematic overview of the structural organization of the DMPK gene, including the (CTG)n repeat in exon 15 in black. Positions of cleavage sites for CRISPR-1, -2, and -3, i.e., the gRNA target sites that were most intensely used in this study, are indicated. The corresponding sequence in exon 15 is displayed below, with the (CTG)n repeat in bold black, CRISPR sites in red, and PAM sequences in green letters.
Figure 2
Figure 2
CRISPR Activity in Myoblasts with Normal-Size (CTG⋅CAG)n Repeats (A) Schematic outline of the T7EI assay for determination of CRISPR cleavage efficiency. Part of DMPK exon 15 ([CTG⋅CAG]n repeat in black) containing CRISPR-1, -2, and -3 recognition sites and positioning of PCR primers used for amplification of the relevant segment are shown on top. Possible fragments formed in the assay are depicted, with sizes given underneath. (B) T7EI assay of DNA from small pools of transfection-positive LHCN cells. Quantification of signal strength (assessed by scanning of fluoresce signal intensity upon UV illumination for all assays shown in B–E) revealed target efficiencies of <1% for CRISPR-1, 8%–21% for CRISPR-2, and 14% for CRISPR-3. DNAs of non-transfected (untr.) LHCN (two alleles with equal DMPK repeat lengths) and KM155C25 myoblasts (one [CTG⋅CAG]5 and one [CTG⋅CAG]14 allele) were used as negative and positive control, respectively. (C) T7E1 assay of DNA from a pool of LHCN myoblasts treated with CRISPR-2 and -3 simultaneously. Untransfected LHCN and KM155C25 were included as controls. Note that we could not differentiate between deletion of the entire region between the two CRISPR sites or simultaneous formation of small indels at each of the two CRISPR sites. (D) PCR analysis of the relevant DMPK genomic segment after dual genome-editing with CRISPR-2 and -3. The upper band represents the unmodified PCR product. The lower band is indicative for deletion of the 77 bp (CTG⋅CAG)5 repeat and flanking regions in a small portion of CRISPR-2- and CRISPR-3-treated cells. (E) PCR analysis of genome changes in three CRISPR-2- and CRISPR-3-treated LHCN cell clones. Clone LHCN-B2.1 contains two unmodified repeats (single signal at 636 bp), whereas clone LHCN-B2.2 has a repeat deletion on both alleles (single signal at 559 bp). Clone LHCN-F3.2 carries one unmodified and one edited allele (signals at 559 bp and 636 bp). (F) Sequence verification of excision of the repeat-containing segment. Top: sequencing profile of the DMPK exon-15 gene region in clonally expanded LHCN cells after dual gene editing with CRISPR-2 and -3. The site at which the DSBs are fused is indicated by an arrowhead. No indels were found. Bottom: the exon-15 sequence lacking the 77-bp repeat-containing segment aligned with the normal DMPK sequence.
Figure 3
Figure 3
Treatment of DM500 Cells with CRISPR-2 and/or -3 (A) Schematic overview of CRISPR/Cas9 target sites relative to the (CTG⋅CAG)n repeat (black) and the flanking DNA (gray) PCR primers (arrows) and probes used for small pool PCR analysis. (B–D) Small-pool PCR analysis of genomic DNA from DM500 cells treated with CRISPR-2 and/or CRISPR-3. (B) shows amplicons from control and treated DM500 cells, generated using the inner primers (DM-C−/−DR) and hybridized using the (CTG⋅CAG)n probe DM56. (C) shows amplicons from control and treated cells, generated using the outer primers (DM-A/-BR) and hybridized using the 5′-flanking probe. For the untreated and treated cells, four replicate PCRs containing ∼50 molecules of template DNA are shown. Note that a clean full-excision DM-C/-DR product is only 85 bp long and is not expected to be detected with the DM56 probe in (B). In (B) and (C), the molecular weight markers (right-hand scale) have been converted to the number of (CTG⋅CAG)n repeats on the left-hand scale. (D) A zoomed-in shorter exposure of the autoradiograph in (B) reveals that the DM500 cell line comprises three primary alleles of ∼540, ∼570, and ∼610 (CTG⋅CAG)n repeats and that the ∼570 and ∼610 alleles are preferentially modified by both CRISPR-2 and -3. (E) PCR analysis of genome changes in DM500 clones treated with CRISPR-2 and -3 using the DMPK e15 primers described in Materials and Methods. Clone DM500-A2.6 contains unmodified (CTG⋅CAG)540/570/610 repeats (single signal at ∼2.2 kb). Clone DM500-A1.3-Δ2 has a repeat deletion on both chromosome copies (single signal at 559 bp). Clone DM500-A2.2-Δ1 carries one unmodified allele and one edited allele (signals at ∼2.2 kb and 559 bp, respectively). Note that the enormous difference in signal intensity is due to relative inefficient amplification of the expanded repeat-containing allele.
Figure 4
Figure 4
Alterations in the DM500 Repeat Region after Cleavage with a Single CRISPR DM500 cells were treated with either CRISPR-2 or -3, after which a 2.2-kb region (including the (CTG⋅CAG)530/580 repeat) was PCR amplified and subsequently analyzed on blot using 32P-labeled probes. (A) Top: outline of the relevant region in DMPK exon 15. Shown are the (CTG⋅CAG)500 repeat in black, cleavage sites for CRISPR-2 and -3, and locations of PCR primers (arrows) and probes used for hybridization detection (bars). Bottom: four large panels showing signals from PCR products from nine pools of DM500 cells (∼20–30 clones per pool) treated with CRISPR-2 (left panel) or CRISPR-3 (right panel), hybridized with probe 1, a 32P-labeled DMPK oligonucleotide located 5′ of the CRISPR cleavage sites (upper panels), or probe 2, a 32P-labeled (CAG)9 oligonucleotide (lower panels). Besides, PCR products of untreated DM500 cells and clone DM500-A1.3-Δ2 carrying a verified deletion of both repeats were used as controls (small panels on far right). Presence of small PCR products in the upper panels indicates deletion of large parts of the repeat in a fair proportion of cells. These products are invisible in the lower panels because the (CAG)9 probe will not bind if the repeat is entirely lost or considerably shortened. (B) Overview of different types of deletions induced by cleavage with single CRISPRs in isolated DM500 cell clones treated with CRISPR-2 (left; four examples) or CRISPR-3 (right, seven examples). Results shown are based on sequencing of the transgenic DMPK exon-15 gene region of these clones. Sizes of residual (CTG⋅CAG)n repeats and sequences flanking the deletions are indicated. Gray rectangles with dotted outlines indicate that no sequence data were available for that particular region.
Figure 5
Figure 5
Dual Genome Editing of DM11 cells Using CRISPR-2 and -3 (A) PCR strategy used for characterization of DM11 clones treated with CRISPR-2 and -3. Four possible outcomes for PCR analysis are displayed (primer positions indicated on top). Because it is not possible to amplify the (CTG⋅CAG)2,600 repeat efficiently, the putative ∼8 kbp signal (gray band with dotted outlines) will not be visible on gel. (B) Results from the PCR for untreated DM11 cells and seven independent DM11 clones treated with CRISPR-2 and -3. Sequencing showed that the deletion of the (CTG·CAG)2,600 repeat in clone DM11-1E6 started 15 bp upstream of the CR-2 site and extended until 16 bp downstream of the CR-3 site; hence, the lower signal is somewhat smaller than the expected 559 bp (outcome 3 in A). A small deletion of 11 nt was found in the (CTG⋅CAG)13 allele. (C and D) Analysis of the fate of the (CTG⋅CAG)2,600 repeat in five different DM11 clones that yielded a single PCR fragment of 559 bp with the assay described in (A). A clean deletion of the (CTG⋅CAG)13 repeat was confirmed by sequencing for all five clones. To verify the fate of the (CTG⋅CAG)2,600 repeat, PCRs were done across the CRISPR-2 site and across the CRISPR-3 site. Absence of products in both reactions indicate deletions of the (CTG⋅CAG)2,600 repeat in both alleles (outcome 4 in A; clones DM11-3B11 and DM11-4A3). (E) Northern blot analysis of RNA isolated from DM11 clones using a 32P-labeled (CAG)9 probe to verify DMPK (CUG)2600 expression. RNA from non-treated DM11 cells was included as positive control. Absence of signal in clones DM11-3B11-Δ/Δ and DM11-4A3-Δ/Δ corroborates successful repeat removal. Clone DM11-4F9 shows a slightly larger DMPK transcript than that of DM11 cells, presumably due to expansion of the repeat during cell culture. (F) Sequence verification of excision of the repeat-containing segment in clone DM11-4A3-Δ/Δ. Top: DMPK exon 15 sequence that has lost the repeat-containing segment aligned with the normal DMPK sequence. Bottom: DNA sequencing profile of the DMPK exon 15 region. The site at which the two DSBs are fused is indicated by an arrowhead. Absence of double peaks indicates that no differences exist between the two modified alleles.
Figure 6
Figure 6
Effects of (CTG⋅CAG)n Repeat Excision on Expression of RNA and Protein Products from Genes in the DM1 Locus (A and B) RNA was isolated from (A) LHCN myoblasts (MBs) or LHCN- Δ/Δ derivatives (see Table S4 for genotype specification) or myotubes (MTs) formed thereof after 5 days in differentiation medium or (B) from DM11 and CRISPR-edited derivative (see Table S4) MBs and MTs, and used for RT-qPCR analysis of expression of DMPK (black bars) and SIX5 (white bars). Bar heights in the diagram correspond to steady-state expression levels given in arbitrary units (n = 3; mean + SEM). (C) RT-PCR analysis of DM1-AS expression in myoblasts (signal strength of the specific 150-bp product is given in arbitrary units underneath; the lower band seen in all lanes represents a primer-dimer signal). (D) RT-PCR analysis of major splice isoforms of DMPK mRNA formed by alternative skipping of exon 13 to 14 or 14 regions in DMPK heterogeneous nuclear RNA (hnRNA) from myoblasts. (E) Visualization of DMPK protein production in parental and gene-edited LHCN myotubes (5 days of differentiation) by western blot analysis. The most abundant DMPK isoform, i.e., the protein produced from the longest RNA splice isoform with exons 13 to 14 included, has an apparent molecular weight of 80–85 kDa (arrow) and is present in all cells. The smaller DMPK isoform, lacking exon 13 to 14 sequences, comigrates with cross-reacting proteins. Variation in signal strength of immunostaining with polyvalent rabbit anti-DMPK antiserum (red) is given in arbitrary units below. Staining with monoclonal mouse-anti-β tubulin antibody (green) was used as control for loading and normalization.
Figure 7
Figure 7
Effects of (CTG·CAG)n Repeat Excision on Nuclear DMPK RNA Retention in DM500 Myoblasts (A) Cell fractionation was used to collect nuclear and cytoplasmic RNA from three DM500 clonal cell lines containing unmodified (CTG⋅CAG)540/570/610 repeats and three independent DM500-Δ2 clonal cell lines with deletions of the repeat in both transgenic alleles. RT-qPCR analysis was used to determine expression levels for (1) nuclear markers Malat1 and pre-DMPK mRNA (exon 2-intron 2 amplicon), (2) cytoplasmic markers Actb and Dmpk from mouse, and (3) mature DMPK mRNA from the human transgene (exon 1-exon 2 and internal exon 15 amplicon). (B) RNA FISH on untreated DM500 cells, clone DM500-A2.4, containing two expanded (CTG·CAG)540/570/610 repeats, and two DM500-Δ clones. Foci containing DMPK (CUG)540/570/610 RNA were labeled using a (CAG)6-TYE563 LNA probe (red). Nuclei were stained with DAPI (blue). No foci were seen in the DM500-Δ2 clones. Scale bar, 10 μm. (C) Quantification of nuclear foci in cell lines shown in (B). Each symbol represents the number of foci in one nucleus. Mean + SEM. ***p < 0.005.
Figure 8
Figure 8
Effects of (CTG⋅CAG)n Repeat Excision on Myogenic Capacity and Aberrant RNA Splicing in DM11 Myoblasts (A) Immunostaining of MHC expression (green) in DM11 cells after 7 days of differentiation. Nuclei were stained with DAPI (red). Scale bar, 100 μm. (B) Fusion index of DM11 cells after 7 days of differentiation. The fusion index was calculated as the ratio of the number of nuclei inside MHC-positive myotubes to the number of total nuclei × 100. Note the improvement of fusion index after excision of the expanded repeat. Mean + SEM. **p < 0.01. (C) Comparative RT-PCR analysis of BIN-1 and DMD in DM11 cells after 5 days of differentiation. Typical embryonic splicing patterns (e) were reverted to the normal adult (a) modes of alternative splicing after loss of the repeat. KM155 myoblasts were used as control cells. (n = 4, mean + SEM). **p < 0.01; ***p < 0.001.

Similar articles

Cited by

References

    1. Caso F., Agosta F., Peric S., Rakočević-Stojanović V., Copetti M., Kostic V.S., Filippi M. Cognitive impairment in myotonic dystrophy type 1 is associated with white matter damage. PLoS ONE. 2014;9:e104697. - PMC - PubMed
    1. Minnerop M., Weber B., Schoene-Bake J.C., Roeske S., Mirbach S., Anspach C., Schneider-Gold C., Betz R.C., Helmstaedter C., Tittgemeyer M. The brain in myotonic dystrophy 1 and 2: evidence for a predominant white matter disease. Brain. 2011;134:3530–3546. - PMC - PubMed
    1. Groenen P., Wieringa B. Expanding complexity in myotonic dystrophy. BioEssays. 1998;20:901–912. - PubMed
    1. Brook J.D., McCurrach M.E., Harley H.G., Buckler A.J., Church D., Aburatani H., Hunter K., Stanton V.P., Thirion J.P., Hudson T. Molecular basis of myotonic dystrophy: expansion of a trinucleotide (CTG) repeat at the 3′ end of a transcript encoding a protein kinase family member. Cell. 1992;68:799–808. - PubMed
    1. Mahadevan M., Tsilfidis C., Sabourin L., Shutler G., Amemiya C., Jansen G., Neville C., Narang M., Barceló J., O’Hoy K. Myotonic dystrophy mutation: an unstable CTG repeat in the 3′ untranslated region of the gene. Science. 1992;255:1253–1255. - PubMed

MeSH terms