. 2017 Jan 27;12(1):e0170466.
doi: 10.1371/journal.pone.0170466. eCollection 2017.

Target Uncertainty Mediates Sensorimotor Error Correction

Affiliations

Target Uncertainty Mediates Sensorimotor Error Correction

Luigi Acerbi et al. PLoS One. .

Abstract

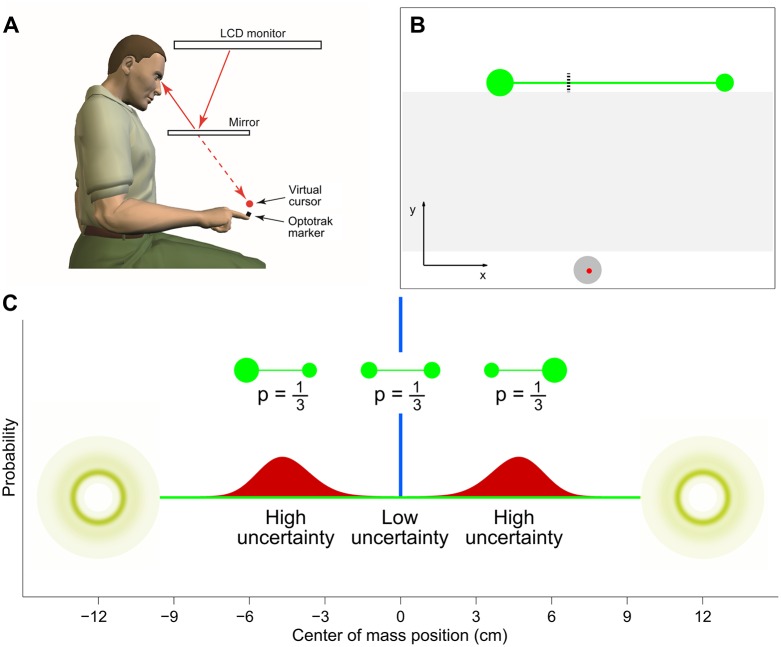
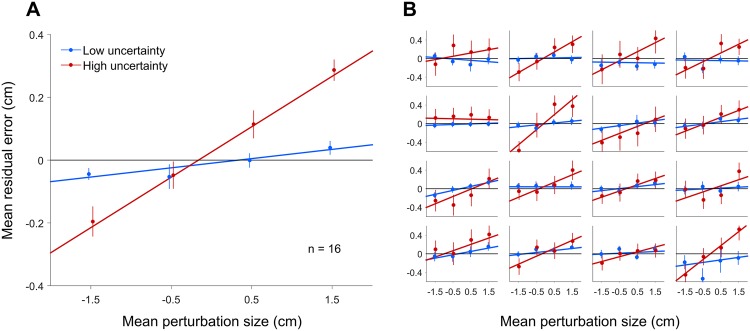
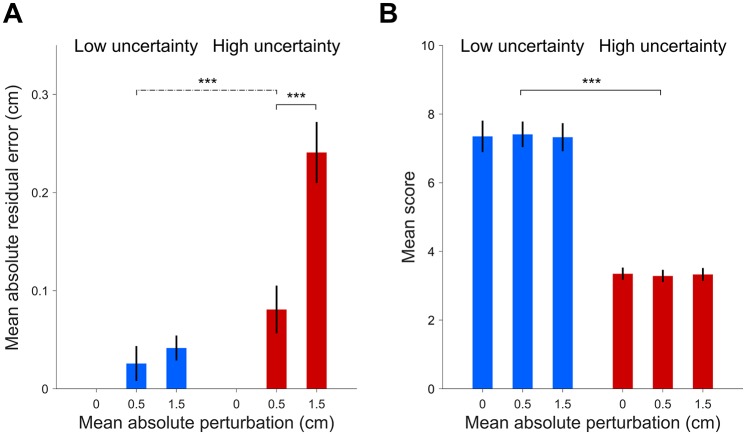
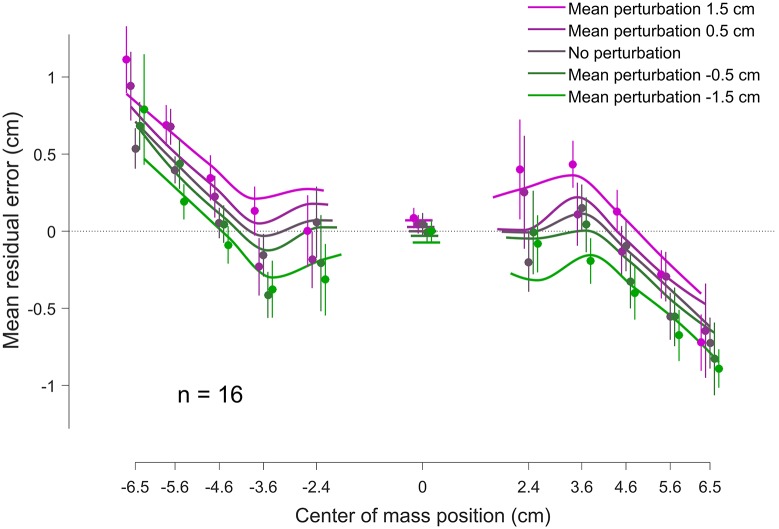
Human movements are prone to errors that arise from inaccuracies in both our perceptual processing and execution of motor commands. We can reduce such errors by both improving our estimates of the state of the world and through online error correction of the ongoing action. Two prominent frameworks that explain how humans solve these problems are Bayesian estimation and stochastic optimal feedback control. Here we examine the interaction between estimation and control by asking if uncertainty in estimates affects how subjects correct for errors that may arise during the movement. Unbeknownst to participants, we randomly shifted the visual feedback of their finger position as they reached to indicate the center of mass of an object. Even though participants were given ample time to compensate for this perturbation, they only fully corrected for the induced error on trials with low uncertainty about center of mass, with correction only partial in trials involving more uncertainty. The analysis of subjects' scores revealed that participants corrected for errors just enough to avoid significant decrease in their overall scores, in agreement with the minimal intervention principle of optimal feedback control. We explain this behavior with a term in the loss function that accounts for the additional effort of adjusting one's response. By suggesting that subjects' decision uncertainty, as reflected in their posterior distribution, is a major factor in determining how their sensorimotor system responds to error, our findings support theoretical models in which the decision making and control processes are fully integrated.


Conflict of interest statement

I have read the journal's policy and the authors of this manuscript have the following competing interests: SV received funding from Microsoft Research as Microsoft Senior Research Fellow in Learning Robotics. This does not alter our adherence to PLOS ONE policies on sharing data and materials.

Figures

Fig 1
Fig 1. Experimental setup.
A: Subjects wore an Optotrak marker on the tip of their right index finger. The visual scene from a CRT monitor, including a virtual cursor that tracked the finger position, was projected into the plane of the hand via a mirror. B: The screen showed a home position at the bottom (grey circle), the cursor (red circle), here at the start of a trial, and the object at top (green dumbbell). The task consisted of locating the center of mass of the object, here indicated by the dashed line. Visual feedback of the cursor was removed in the region between the home position and the target line (here shaded for visualization purposes). C: The two disks were separated by 24 cm and, depending on the disks size ratio, the target (center of mass) was either exactly halfway between the two disks (p = 1/3; low uncertainty; blue distribution) or to the right (p = 1/3) or left (p = 1/3) of the midpoint (high uncertainty; red distributions), leading to a trimodal distribution of center of mass.
Fig 2
Fig 2. Mean residual error against mean perturbation size, for Low-uncertainty (blue) and High-uncertainty (red) trials.
A: Group mean residual error against mean perturbation size. Error bars are SEM between subjects. Fits are are linear regressions to the mean data. B: Each panel reports the mean residual error against mean perturbation size for a single subject, for Low-uncertainty (blue) and High-uncertainty (red) trials. Error bars are SEM between trials. Fits are linear regressions to the individual data. For both panels each subject’s data have been shifted so as to remove the mean residual error for the 0 perturbation condition for that subject.
Fig 3
Fig 3. Participants’ mean absolute residual errors and mean scores.
A: Mean absolute residual error (mean ± SE across subjects; residual errors are computed after removing the residual error for the 0 perturbation condition) by perturbation size (0, ±0.5, ±1.5 cm) and trial uncertainty (Low, High). These data are the same as in Fig 2A, here shown in absolute value and aggregated by perturbation size. B: Participants’ mean scores (mean ± SE between subjects) by perturbation size and trial uncertainty. Even though the residual errors (panel A) are significantly different from zero and significantly modulated by perturbation size (p < .001) and the interaction between the uncertainty and perturbation size (p < .001), the scores (panel B) are significantly affected only by the trial uncertainty (p < .001).
Fig 4
Fig 4. Mean residual error (bias) as a function of the location of the center of mass.
Data points and error bars are mean data ± SE across subjects in the test session (binned for visualization). Colors correspond to different mean perturbation levels. Continuous lines are the fits of the Bayesian model to each individual dataset, averaged over subjects (asymmetries are due to asymmetries in the data). For both data and model fits, distinct perturbation levels are displayed with a slight offset on the x axis for visualization purposes. Vertical shifts in residual error for different levels of perturbation correspond to different amounts of average lack of correction (absolute residual errors shown in Fig 3A).
Fig 5
Fig 5. Slope of mean residual error with respect to perturbation, comparison between data and model.
Each circle represents the slope of the mean residual error (Fig 2B) for a single subject for Low-uncertainty trials (blue dots) and High-uncertainty trials (red dots). The x axis indicates the slope predicted by the Bayesian observer model, while the y axis reports the slope measured from the data (slope of linear regressions in Fig 2B). The model correctly predicts the substantial difference between Low-uncertainty and High-uncertainty trials and is in good quantitative agreement with individual datasets.

References

    1. Faisal AA, Selen LP, Wolpert DM. Noise in the nervous system. Nat Rev Neurosci. 2008;9(4):292–303. 10.1038/nrn2258 - DOI - PMC - PubMed
    1. Kersten D, Mamassian P, Yuille A. Object perception as Bayesian inference. Annu Rev Psychol. 2004;55:271–304. 10.1146/annurev.psych.55.090902.142005 - DOI - PubMed
    1. Simoncelli EP. Optimal estimation in sensory systems In: Gazzaniga MS, editor. The cognitive neurosciences, IV edition MIT Press; 2009. p. 525–535.
    1. Ma WJ. Organizing probabilistic models of perception. Trends Cogn Sci. 2012;16(10):511–518. 10.1016/j.tics.2012.08.010 - DOI - PubMed
    1. Körding KP, Wolpert DM. Bayesian integration in sensorimotor learning. Nature. 2004;427(6971):244–247. 10.1038/nature02169 - DOI - PubMed

LinkOut - more resources