. 2017 Jan 26;168(3):413-426.e12.
doi: 10.1016/j.cell.2017.01.005.

Cellular and Circuit Mechanisms Shaping the Perceptual Properties of the Primate Fovea

Affiliations

Cellular and Circuit Mechanisms Shaping the Perceptual Properties of the Primate Fovea

Raunak Sinha et al. Cell. .

Abstract

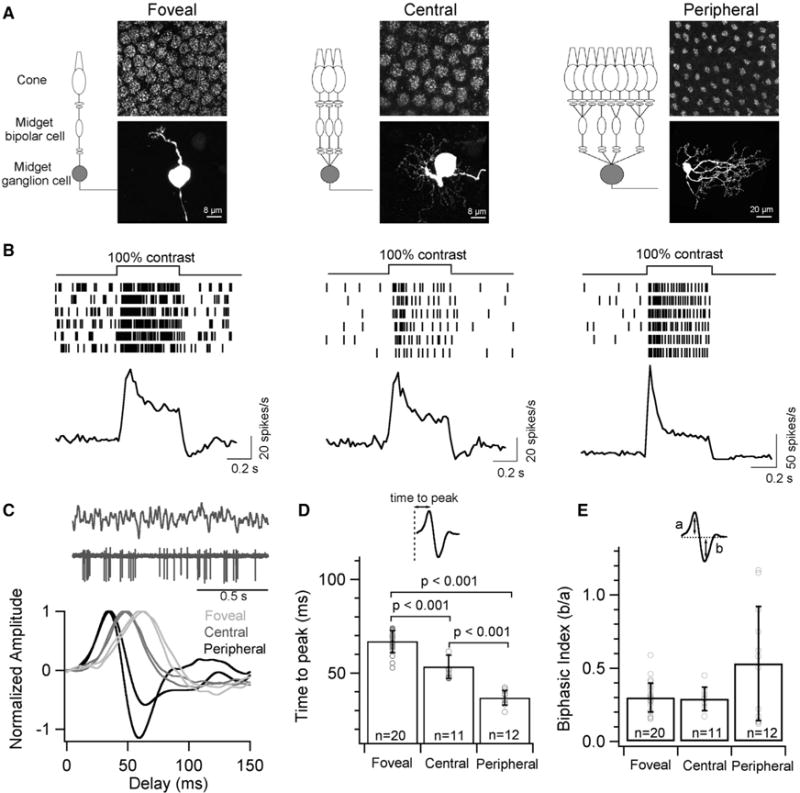
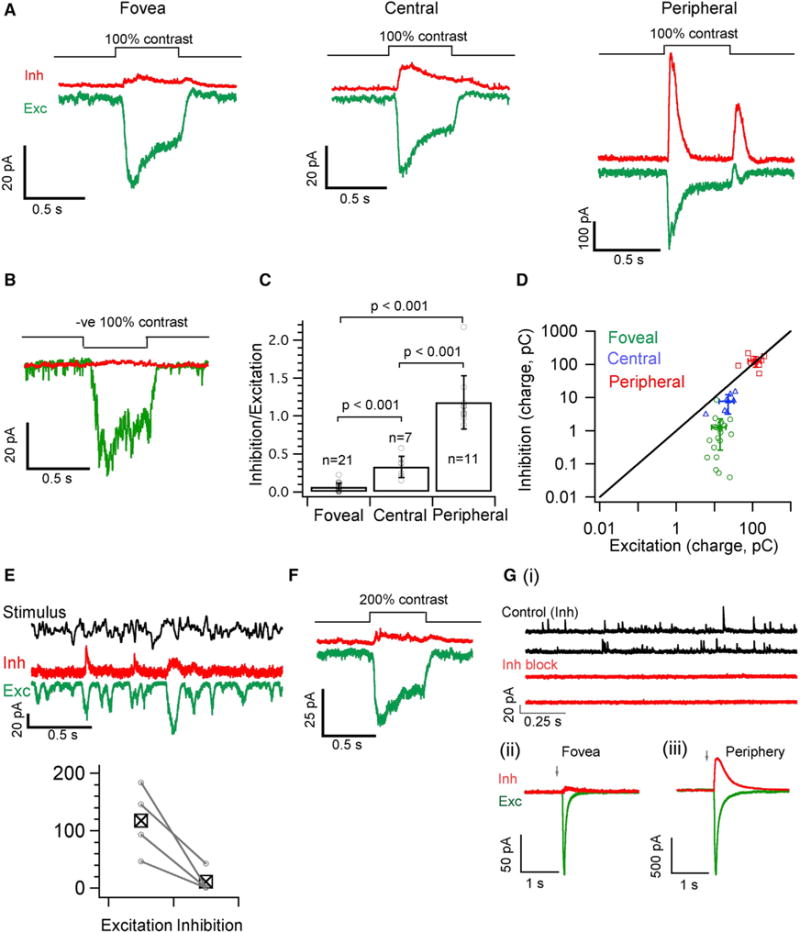
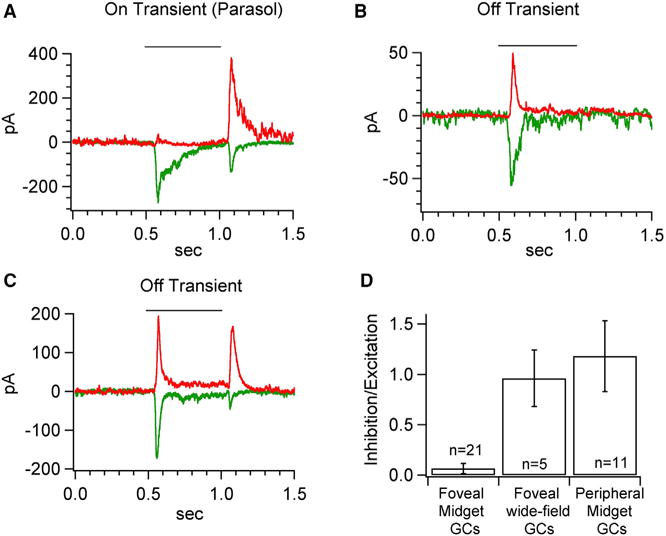
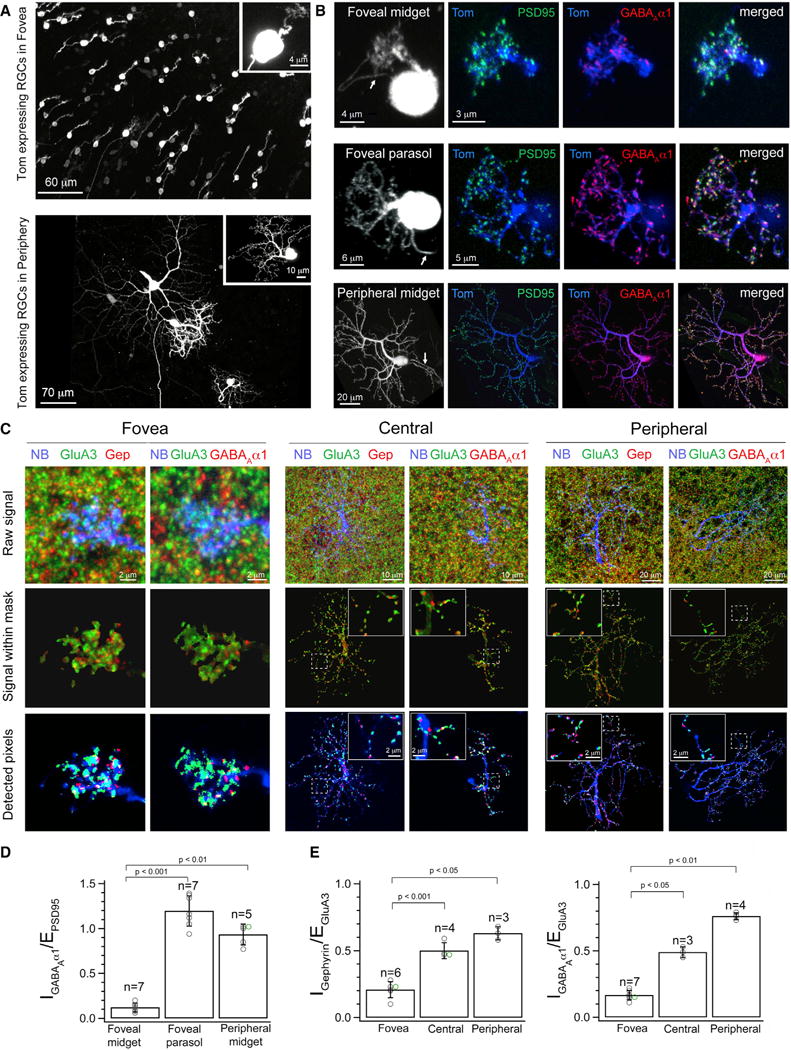
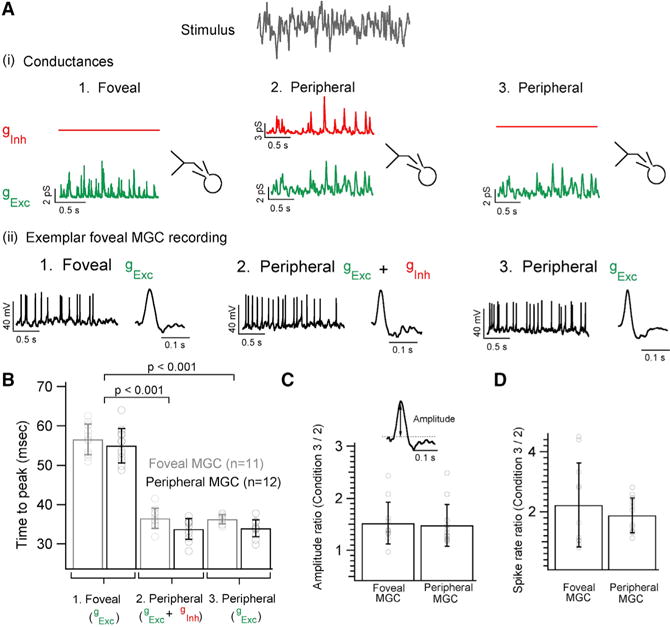
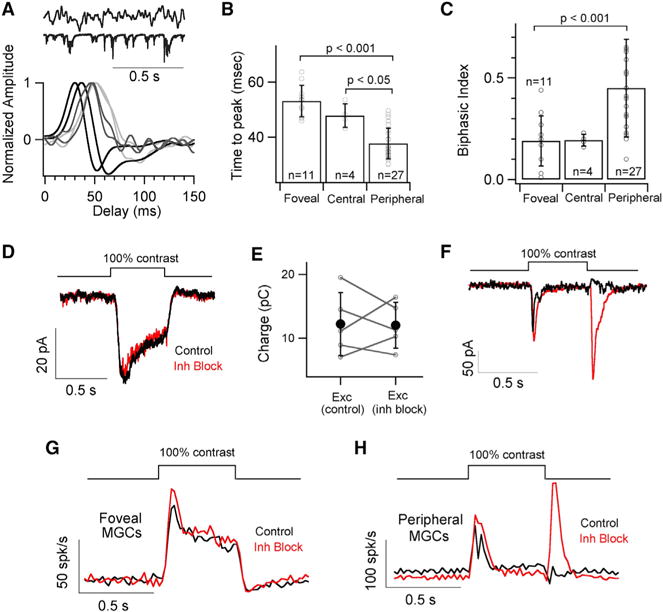
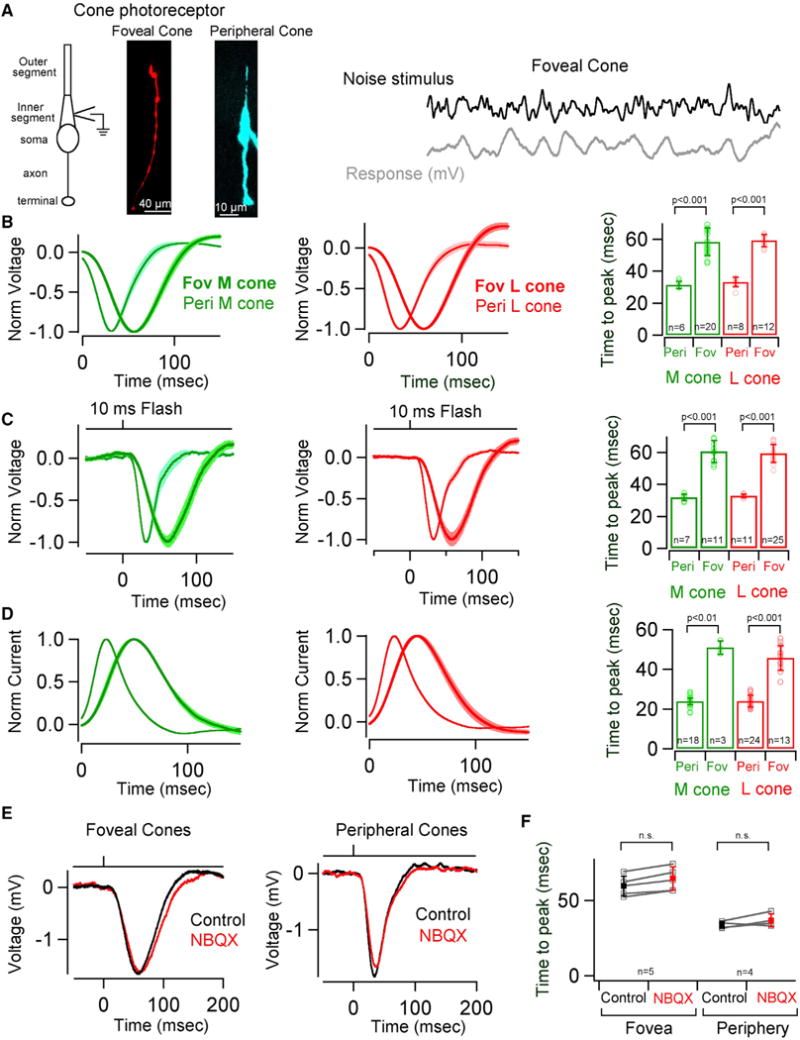
The fovea is a specialized region of the retina that dominates the visual perception of primates by providing high chromatic and spatial acuity. While the foveal and peripheral retina share a similar core circuit architecture, they exhibit profound functional differences whose mechanisms are unknown. Using intracellular recordings and structure-function analyses, we examined the cellular and synaptic underpinnings of the primate fovea. Compared to peripheral vision, the fovea displays decreased sensitivity to rapid variations in light inputs; this difference is reflected in the responses of ganglion cells, the output cells of the retina. Surprisingly, and unlike in the periphery, synaptic inhibition minimally shaped the responses of foveal midget ganglion cells. This difference in inhibition cannot however, explain the differences in the temporal sensitivity of foveal and peripheral midget ganglion cells. Instead, foveal cone photoreceptors themselves exhibited slower light responses than peripheral cones, unexpectedly linking cone signals to perceptual sensitivity.


Figures

Figure 1
Figure 1. Midget Ganglion Cells Show Slower Response Kinetics in the Fovea than in the Periphery
(A) Schematic depicting the convergence of the midget circuit in primate retina at three different eccentricities. MGCs were classified as foveal (<1 mm), central (2–4 mm), and peripheral (>6 mm) based on their distance from the foveal pit. Top panel shows a composite fluorescence micrograph of AMPA receptor subunit, GluA3, at the outer plexiform layer indicating the cone density and the bottom panel is the corresponding image of a neurobiotin-filled MGC at each eccentricity. (B) Spike trains from six trials of an exemplar MGC and the average peri-stimulus time histogram (binwidth of 20ms) across several MGCs at each retinal eccentricity in response to a full-field 100% contrast light step. Note the transient spike response from peripheral MGCs. (C) Temporal receptive field probed with a full-field Gaussian white noise stimuli. A short excerpt of the stimulus and spike response (top) with exemplar time-reversed spike-triggered average (STA) of individual MGCs at each retinal eccentricity (bottom). (D) Quantification of the time to peak i.e., latency of the peaks in STAs yields a mean of 67 ± 6 ms for foveal MGCs, 53 ± 6 ms for central MGCs and 37 ± 4 ms for peripheral MGCs. The latency of the STAs is significantly longer for foveal MGCs than central or peripheral MGCs. (E) Quantification of the biphasic index of STAs i.e., the ratio of the peak amplitudes from the baseline yields a mean value of 0.33 ± 0.15, 0.30 ± 0.06 and 0.51 ± 0.35 for MGCs in foveal, central and peripheral retina, respectively. In all figures, error bars indicate s.d. and ‘n’ refers to the number of cells analyzed.
Figure 2
Figure 2. Foveal Midget Ganglion Cells Receive Little or No Light-Evoked Inhibition
(A) Average excitatory (Exc, in green) and inhibitory (Inh, in red) synaptic currents produced by a 100% contrast light step (background light intensity of 4,000 R*/cone/sec) from voltage-clamped MGCs in foveal, central and peripheral retina. (B) Mean excitatory (green) and inhibitory (red) synaptic current in response to a negative 100% contrast step measured from a voltage-clamped foveal OFF MGC. (C) Ratio of the inhibitory to excitatory charge transfer analyzed from individual MGC response to a contrast light step as shown in A for each of the retinal locations. The mean I/E ratio is 0.06 ± 0.05, 0.33 ± 0.14 and 1.18 ± 0.35 for foveal, central and peripheral MGCs respectively. (D) 2D plot of absolute excitatory versus inhibitory charge transfer across eccentricity (raw values used to calculate I/E ratio in Figure 2C). The average value for peripheral MGCs lies on the unity line whereas foveal and central MGCs are below the unity line and skewed toward excitation. (E) Exemplar average trace of inhibitory and excitatory synaptic currents of foveal ON MGCs in response to a time varying stimulus. Bottom panel shows a pairwise comparison of stimulus-driven variance in excitatory and inhibitory responses across 4 foveal ON MGCs. (F) Mean excitatory (green) and inhibitory (red) synaptic current in response to a positive 200% contrast step measured from voltage-clamped foveal ON MGCs (n = 5). (G) (i), Spontaneous inhibitory synaptic currents (Control Inh) are often observed in foveal MGCs and are blocked after bath application of GABA and Glycine receptor blockers (Inh block). (G) (ii & iii), Simultaneous uncaging of Glutamate and GABA on the dendrites of foveal and Peripheral MGCs. Average traces of currents evoked by Glutamate (green; MNI-Glutamate) and GABA (red; Rubi-GABA) uncaging from foveal and peripheral MGCs (n = 3) voltage clamped at the inhibitory or excitatory reversal potential. Arrow indicates time of uncaging. The ratio of inhibition to excitation (charge transfer) yields a mean value of 0.1 ± 0.07 and 0.84 ± 0.5 for foveal and peripheral MGCs respectively. See also Figure S5.
Figure 3
Figure 3. Excitatory and Inhibitory Responses of Foveal Wide-Field Ganglion Cells
(A–C) Exemplar mean excitatory (green) and inhibitory (red) synaptic current in response to a 100% contrast step measured from voltage-clamped foveal wide-field ganglion cells. (D) Comparison of the ratio of inhibitory to excitatory charge transfer to a 100% contrast light step as shown in Figures 2A and C. The mean I/E ratio is 0.06 ± 0.05, 1.0 ± 0.3 and 1.2 ± 0.4 for foveal MGCs (data from Figure 2), foveal wide-field ganglion cells and peripheral MGCs (data from Figure 2) respectively.
Figure 4
Figure 4. Foveal Midget Ganglion Cells Express Low Levels of Inhibitory Postsynaptic Receptors Relative to Excitatory Postsynaptic Receptors
(A), Whole-mount view of retinal ganglion cells (RGCs) biolistically labeled by expression of tdTomato (Tom) in foveal (top) and peripheral (bottom) macaque retina. Inset shows a single MGC at each eccentricity. (B) Maximum intensity projection of a co-transfected MGC and parasol cell in the macaque fovea and a MGC in peripheral retina. Arrows point to the axon. PSD95-CFP (green) and GABAAα1-YFP (red) expression in tdTomato (Tom, blue) labeled cells. (C) Maximum intensity projections showing neurobiotin-filled (NB, blue) dendrites of MGCs colabeled with GluA3 (green) and gephyrin (Gep, red) or with GluA3 and GABAAα1-YFP (red) at each of the three different retinal eccentricities (foveal, central, peripheral). Top panel shows the combined raw immunolabeling signal (see Figure S2 for individual labeling panels). Middle panel shows the receptor signal within the masked MGC dendritic process. Bottom panel shows the receptor pixels above a threshold that eliminates background fluorescence associated with the immunolabeling (see STAR Methods and Figure S3). Insets for central and peripheral MGCs show raw and detected GluA3 and gephryin signal or GluA3 and GABAAα1-YFP signal along a small dendritic stretch. (D) Quantification of the % volume occupancy of GABAAα1-YFP signal relative to PSD95-CFP signal within tdTomato filled dendrites in the fovea revealed a much higher IGABAA/EPSD-95 ratio in parasol cells (mean = 1.22 ± 0.25) relative to MGCs (mean of 0.14 ± 0.05). MGCs also revealed a low-fovea to high-periphery IGABAA/EPSD-95 ratio across eccentricity (periphery, mean of 0.88 ± 0.13). The overlapping data points have been shifted and color-coded for better clarity. (E) Quantification of the IGephyrin/EGluA3 ratio by estimation of the % volume (dendrite) occupancy of gephyrin signal as compared to the % occupancy of the GluA3 signal. The IGephyrin/EGluA3 ratio for neurobiotin filled MGCs was significantly lower in foveal (mean of 0.21 ± 0.06) compared to central (mean of 0.50 ± 0.06) and peripheral (mean of 0.60 ± 0.05) retina. Similar results were obtained upon quantification of the IGABAA/EGluA3 ratio for neurobiotin filled MGCs (foveal, mean of 0.17 ± 0.04; central, mean of 0.49 ± 0.04; peripheral, mean of 0.76 ± 0.03). The overlapping data points have been shifted and color-coded for better clarity. See also Figures S1, S2, S3, S4, and S6.
Figure 5
Figure 5. Inhibitory Synaptic Input Affects Gain but Not Kinetics of Peripheral Midget Ganglion Cell Outputs
(A) Dynamic clamp experiment illustrating the three sets of conductances injected into foveal or peripheral MGCs. (1) Synaptic conductances were measured in response to white noise stimuli as in Figure 1C: 1. Foveal gExc 2. Peripheral gExc + gInh and 3. Peripheral gExc (2) Exemplar current-clamp recording from a foveal MGC where each of the three sets of conductances evokes corresponding spike responses. Exemplar STA from a foveal MGC for each of the three injected conductance sets. (B) Bar graph comparing the time to peak of the STAs for each of the three conductance sets for foveal and peripheral MGCs. MGCs show faster kinetics with shorter time to peak when injected with peripheral synaptic conductances at the fovea (mean of 36 ± 3 ms for gExc + gInh and 36 ± 1 ms for gExc) and in the periphery (mean of 34 ± 3 ms for gExc + gInh and 34 ± 2 ms for gExc). However, when MGCs are injected with foveal conductances their response kinetics gets appreciably slower (mean of 57 ± 4 ms for foveal MGCs and mean of 55 ± 4 ms for peripheral MGCs). (C) Ratio of the STA amplitude measured from MGCs without peripheral inhibitory conductances (set 3 in A) to those measured with peripheral inhibitory conductances (set 2 in A) yields a mean value of 1.5 ± 0.4 for both foveal and peripheral MGCs. (D) The ratio of the mean spike rate yields a mean value of 2.2 ± 1.4 and 1.9 ± 0.5 for foveal and peripheral MGCs, respectively.
Figure 6
Figure 6. Excitatory Inputs on MGCs Exhibit a Gradient of Kinetics across Retinal Locations
(A) Short excerpt of the white noise stimulus and excitatory synaptic response (top) with exemplar time-reversed linear filters for excitatory synaptic currents measured in response to white noise stimuli. (B) Quantification of the time to peak for the linear filters yields a mean of 53 ± 6 ms, 48 ± 4 ms and 38 ± 6 ms for foveal, central and peripheral MGCs, respectively. (C) Bar graph comparing the biphasic indices of linear filters from MGCs in foveal, central and peripheral retina. The mean biphasic indices are 0.19 ± 0.12, 0.19 ± 0.03 and 0.45 ± 0.24 for foveal, central and peripheral MGCs. (D) Average excitatory synaptic currents in response to a 100% contrast light step from foveal MGCs before and after bath application of a cocktail of GABA and Glycine receptor blockers (TPMPA, GABAzine and Strychnine). (E) A pairwise comparison of charge transfer of the excitatory response from individual MGCs (n = 5) before and after drug application (mean Exccontrol = 12.22 ± 4.92 pC and mean ExcInh block = 12.02 ± 3.57 pC) shows no significant difference (p > 0.05). (F) Mean excitatory synaptic current in response to a 100% contrast step before (black trace) and after (red trace) bath application of GABA and Glycine receptor blockers (GABAzine, TPMPA and Strychnine) reveals an OFF response (i.e., response at the light offset) suggesting a key role of presynaptic inhibition in shaping peripheral MGC input. (G and H) Average peri-stimulus time histogram (binwidth of 20ms) across foveal and peripheral MGCs in response to a full-field 100% contrast light step before (black trace) and after (red trace) bath application of inhibitory GABA and Glycine receptor blockers (GABAzine, TPMPA and Strychnine).
Figure 7
Figure 7. Cone Signals Are Slower in the Fovea than Periphery
(A) Schematic illustrating the morphology of a cone photoreceptor. Whole cell recordings were performed at the inner segment as depicted in the schematic. A cell-fill image of a foveal (Fov) and peripheral (Peri) cone. Please note the dramatic difference in cone morphology, particularly the long axon of the foveal cone. A short excerpt of a foveal cone voltage response to a time varying stimulus. Cone voltage responses (B, C and E) are depicted with an opposite polarity compared to current responses (D). (B) Average time-reversed linear filters for foveal and peripheral M and L cone voltage responses. Shaded regions represent SEM. Quantification of the time to peak for the linear filters yields a mean of 31.45 ± 2 ms and 58.37 ± 9 ms for peripheral and foveal M cones, respectively. The mean time to peak for peripheral and foveal L cones was 33.2 ± 3 ms and 59.3 ± 4 ms, respectively. Error bars represent s.d. (C) Average voltage responses of foveal and peripheral M and L cones to a 300% contrast light flash. Shaded regions represent SEM. Quantification of the time to peak for the responses yields a mean of 31.85 ± 2 ms and 60.68 ± 7 ms for peripheral and foveal M cones, respectively. The mean time to peak for peripheral and foveal L cones was 32.8 ± 1 ms and 59.44 ± 6 ms, respectively. Error bars represent s.d. (D) Average time-reversed linear filters for foveal and peripheral M and L cone currents. Shaded regions represent SEM. Quantification of the time to peak for the linear filters yields a mean of 23.9 ± 2 ms and 51.03 ± 3 ms for peripheral and foveal M cones, respectively. The mean time to peak for peripheral and foveal L cones was 23.95 ± 3 ms and 45.76 ± 6 ms, respectively. Error bars represent s.d. (E) Average voltage responses of foveal and peripheral cone photoreceptors to 300% contrast (10ms flash) under control conditions (black) and with AMPA receptors blocked (red) to eliminate cone transmission to horizontal cells (10 μM NBQX). (F) Quantification of the time to peak of the voltage responses to 300% contrast (10ms flash) yields a mean of 59.72 ± 7 ms and 64.8 ± 8 ms for foveal cones before and after application of NBQX. The mean time to peak for peripheral cones before and after NBQX application was 33.28 ± 2 ms and 36.95 ± 4 ms, respectively. Error bars represent s.d. See also Figure S7.

Comment in

References

    1. Abbott CJ, Percival KA, Martin PR, Grünert U. Amacrine and bipolar inputs to midget and parasol ganglion cells in marmoset retina. Vis Neurosci. 2012;29:157–168. - PubMed
    1. Angueyra JM, Rieke F. Origin and effect of phototransduction noise in primate cone photoreceptors. Nat Neurosci. 2013;16:1692–1700. - PMC - PubMed
    1. Asari H, Meister M. Divergence of visual channels in the inner retina. Nat Neurosci. 2012;15:1581–1589. - PMC - PubMed
    1. Baccus SA, Olveczky BP, Manu M, Meister M. A retinal circuit that computes object motion. J Neurosci. 2008;28:6807–6817. - PMC - PubMed
    1. Barrow AJ, Wu SM. Low-conductance HCN1 ion channels augment the frequency response of rod and cone photoreceptors. J Neurosci. 2009;29:5841–5853. - PMC - PubMed

Publication types