. 2017 Jan 26;168(3):503-516.e12.
doi: 10.1016/j.cell.2017.01.006.

Pathogen-Mediated Inhibition of Anorexia Promotes Host Survival and Transmission

Affiliations

Pathogen-Mediated Inhibition of Anorexia Promotes Host Survival and Transmission

Sheila Rao et al. Cell. .

Abstract

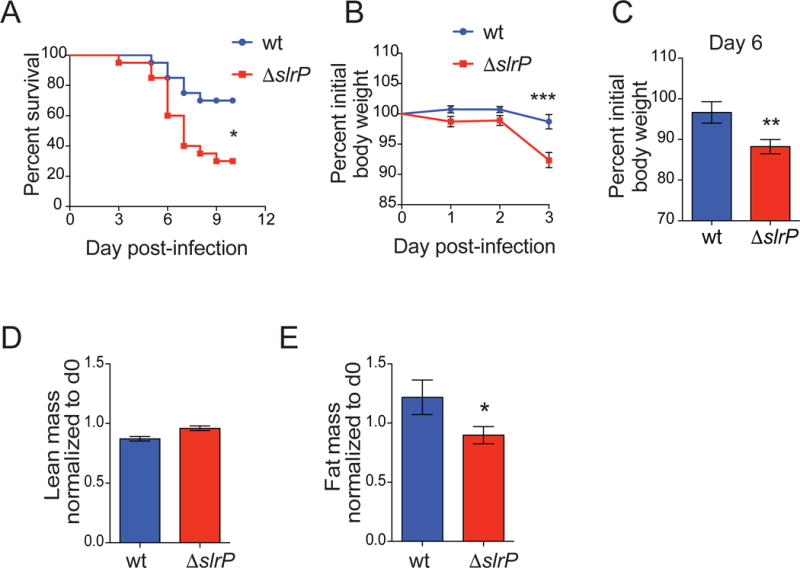
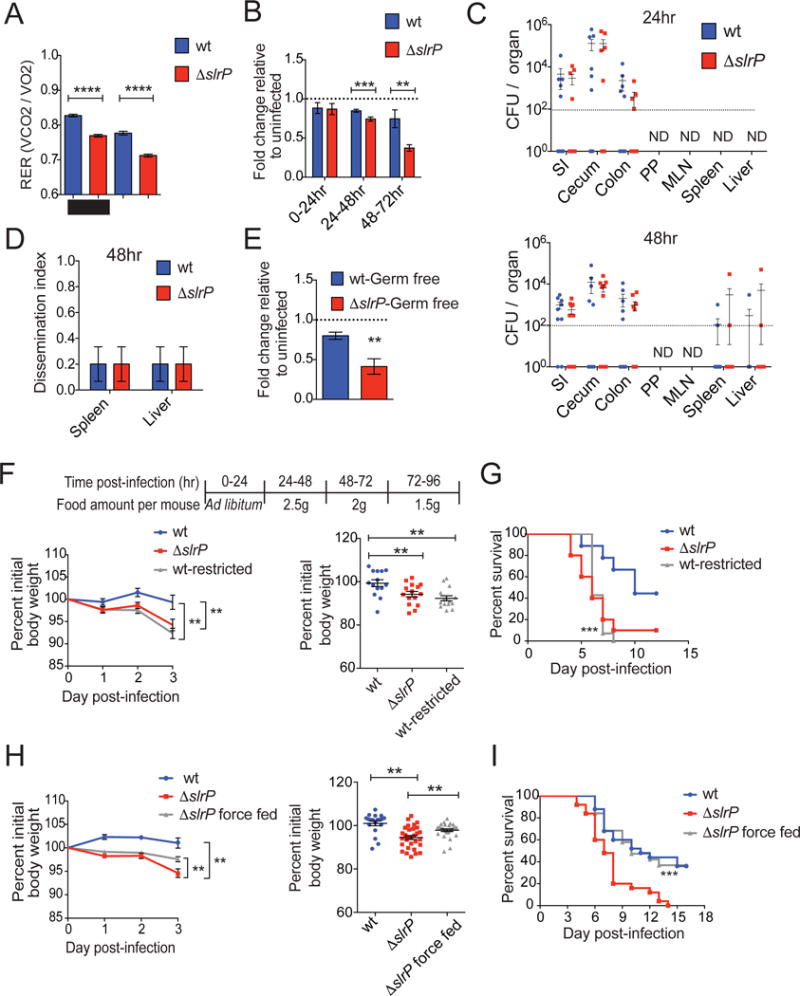
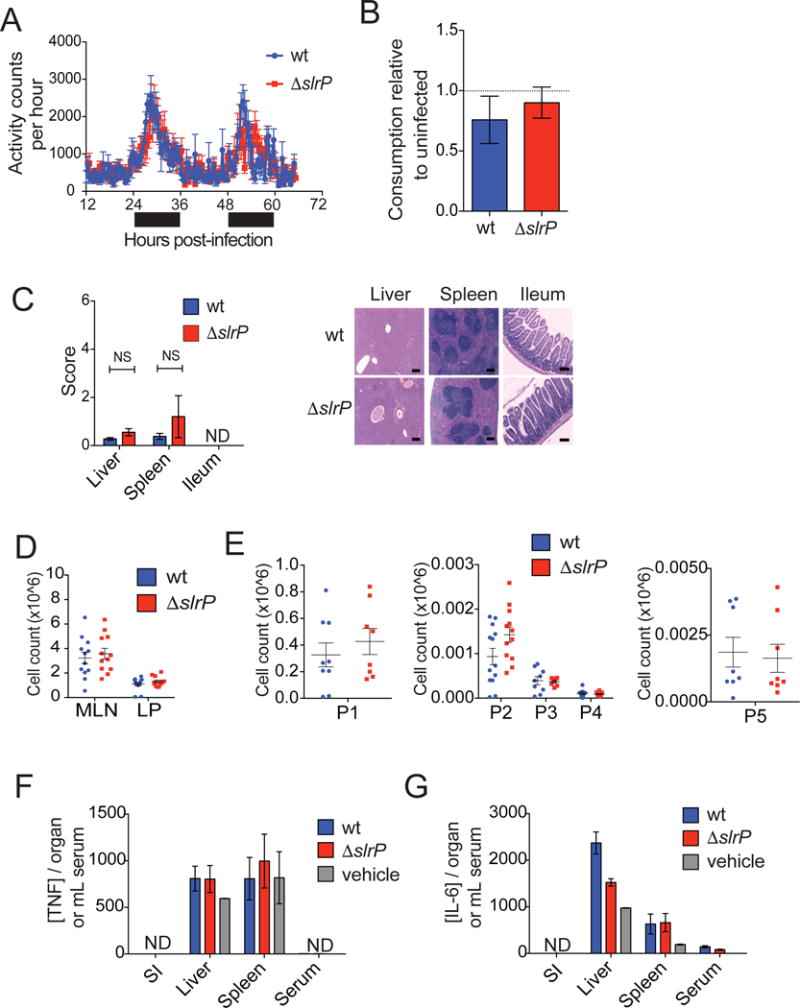
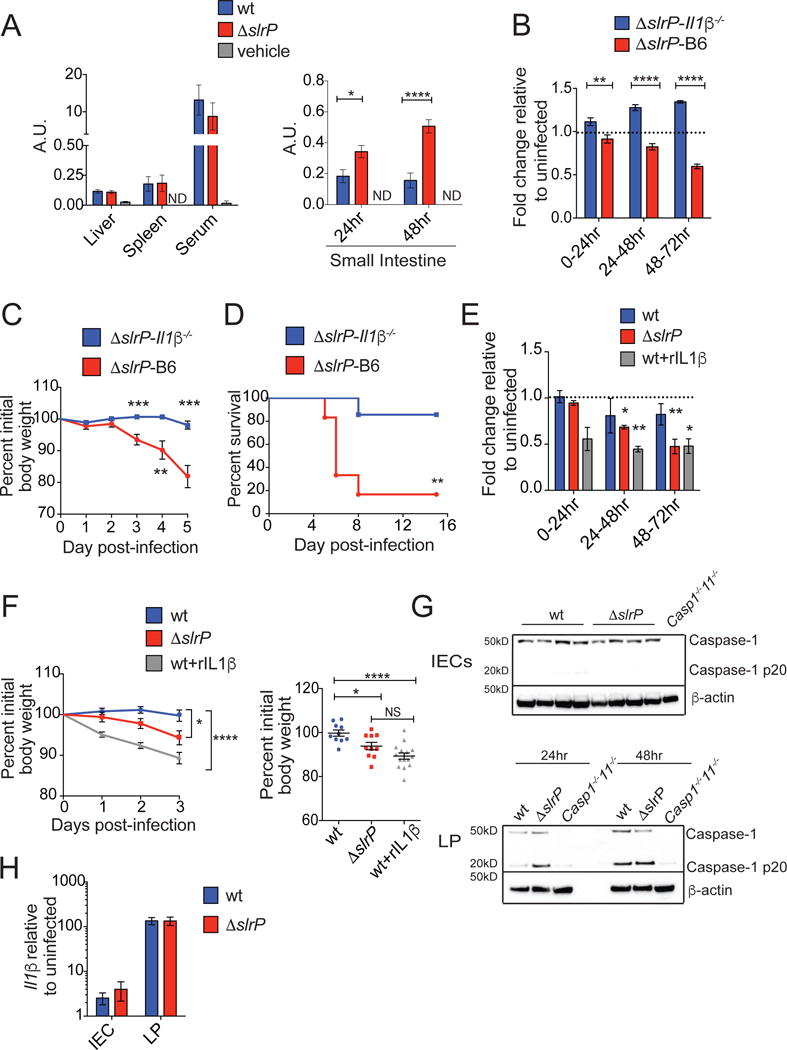
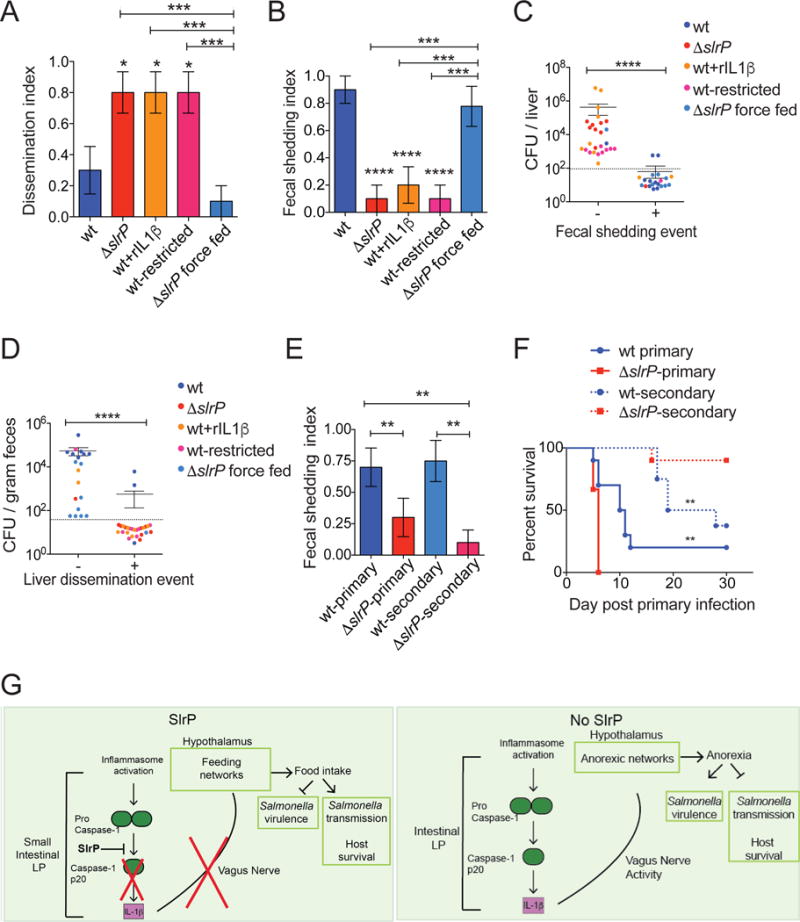
Sickness-induced anorexia is a conserved behavior induced during infections. Here, we report that an intestinal pathogen, Salmonella Typhimurium, inhibits anorexia by manipulating the gut-brain axis. Inhibition of inflammasome activation by the S. Typhimurium effector, SlrP, prevented anorexia caused by IL-1β-mediated signaling to the hypothalamus via the vagus nerve. Rather than compromising host defenses, pathogen-mediated inhibition of anorexia increased host survival. SlrP-mediated inhibition of anorexia prevented invasion and systemic infection by wild-type S. Typhimurium, reducing virulence while increasing transmission to new hosts, suggesting that there are trade-offs between transmission and virulence. These results clarify the complex and contextual role of anorexia in host-pathogen interactions and suggest that microbes have evolved mechanisms to modulate sickness-induced behaviors to promote health of their host and their transmission at the expense of virulence.

Keywords: IL-1β; Salmonella; Vagus nerve; inflammasome; pathogen transmission; sickness-induced anorexia; virulence.


Conflict of interest statement

The authors declare no conflicts of interest.

Figures

Figure 1
Figure 1. A Salmonella effector promotes survival of its host
(A) Survival of B6 mice orally infected with wt (n=20) or ΔslrP (n=20) ST. Data represent 2 independent experiments combined. (B–C) Weight loss of B6 mice orally infected with wt or ΔslrP ST on days 1–3 (B) and day 6 (C) post-infection. n=18/group. Data represent 3 independent experiments combined (B). n=12 wt-infected and n=17 ΔslrP-infected mice (C). (D–E) MRI analysis of lean (D) and fat mass (E) of B6 mice orally infected with wt (n=9) or ΔslrP (n=10) ST for 72hr. Measurements at 72hr are normalized to those taken on day 0 for each mouse. Data represent 2 independent experiments combined. *** indicates p < 0.001, ** indicates p < 0.01, * indicates p<0.05 by unpaired student’s t test or Log rank analysis (survival). Error bars +/− SEM.
Figure 2
Figure 2. Inhibition of the sickness-induced anorexia response controls virulence
(A) RER at 72hr post-infection of B6 mice orally infected with wt or ΔslrP ST. Black bar indicates dark/night cycle, and white bar indicates light/day cycle. n=5/group. (B) Food consumption of B6 mice orally infected with wt or ΔslrP ST. Quantification is expressed as a ratio of grams of food per animal at each timepoint to that of vehicle (PBS)-gavaged animals. 0–24hr: n=30 mice/group; 24–48hr: n=30 mice/group; 48–72hr: n=15 mice/group. Data represent 3 experiments combined. (C) CFU in indicated tissues of B6 mice orally infected with wt or ΔslrP ST for 24hr (top) and 48hr (bottom). n=10–16 mice/group. Data represent 2 independent experiments combined. Dotted line indicates limit of detection and mice with no CFU detected are indicated by symbols below this line. ND indicates none detected. (D) Animals from (C) were assigned a dissemination score of “1” (at least 1 CFU at the level of detection in indicated systemic organ) or “0” (no CFU detected in indicated systemic organ) 48hr post-infection. n=10/group (E) Food consumption of germ-free B6 mice orally infected with wt (n=12) or ΔslrP (n=14) ST for 24hr. Grams of food per animal normalized to uninfected consumption value of germ-free mice. Data combined from 2 independent experiments. (F) Weight loss from days 1–3 of wt ST infection (n=14), ΔslrP ST infection (n=15), and wt ST infection during which food consumption was restricted (n=15) as indicated in table. Right graph shows weight loss on day 3 post-infection from left graph. Data represent 2 independent experiments combined. (G) Survival of mice from (F). ***indicates p=0.0006 between wt-infected and wt-infected food-restricted mice by Log rank analysis. (H) Weight loss from days 1–3 of wt ST infection (n=19), ΔslrP ST infection (n=30) and ΔslrP ST infection during which mice were force fed twice daily in addition to ad libitum feeding (n=29). Right graph shows weight loss on day 3 post-infection from left graph. Data represent 3 independent experiments combined. (I) Survival of mice from (H). ***indicates p=0.0012 between ΔslrP-infected mice and ΔslrP-infected force fed mice by Log rank analysis. ****p<0.0005, ***p<0.01, **p<0.05 by unpaired student’s t test. Error bars indicate +/−SEM. See Figure S1.
Figure 3
Figure 3. Canonical mediators of sickness-induced anorexia are equivalent between wt and ΔslrP ST
(A) Activity of B6 mice orally infected with wt or ΔslrP ST. Black bar indicates dark/night cycle, and white bar indicates light/day cycle. n=6 mice/group. (B) B6 mice were infected i.p. with wt or ΔslrP ST, and food consumption was measured every 24hrs post-infection and normalized to consumption of uninfected animals. Grams of food per animal consumed within the first four days of infection shown. n=6/group. (C) H&E staining and histological scoring of spleen, liver, and ileum 24hr after oral infection of B6 mice with wt or ΔslrP ST. ND indicates pathology above limit of detection not detected. NS indicates not significant. Scale bar indicates 200μm. n=5/group. (D) Total cellularity of MLN and SI LP 48hr after oral infection of B6 mice with wt or ΔslrP ST. n=12–13/group. Data represent 3 independent experiments combined. (E) Numbers of inflammatory cell populations 48hr after oral infection of B6 mice with wt or ΔslrP ST. LP: T/B lymphocytes (P1, n=8–9/group), neutrophils (P2, n=13/group), phagocytic macrophages (P3, n=8–9/group), inflammatory monocytes (P4, n=8–9/group); MLN: migratory DCs (P5, n=8/group). Data represent 3 independent experiments combined. (F–G) ELISA measurements of TNFα (F) and IL-6 (G) in indicated tissues 48hr after oral infection of B6 mice with wt or ΔslrP ST. n=4–10/group. ND denotes Not Detected. Vehicle indicates PBS. Error bars indicate +/− SEM. See Figure S2.
Figure 4
Figure 4. ST SlrP prevents anorexia and regulates virulence through the inhibition of IL-1β
(A) Levels of mature IL-1β were determined by IL-1R reporter assay of whole organ homogenates in liver, spleen and serum of B6 mice 48hr post-infection (left, n=4–10/group) and in SI (right; n=7 vehicle-gavaged, n= 24 wt-infected and n= 24 ΔslrP-infected mice). Graph shown depicts reporter fluorescence (arbitrary units), indicative of active IL-1β. Data represent 2 experiments combined. (B–D) Food consumption (B), weight loss (C), and survival (D) during ΔslrP infection of B6 (n=6–20) and Il1β−/− (n=7–15) mice. (B) Grams of food per animal was normalized to consumption of uninfected animals of appropriate genotype. Data represent 2 experiments combined. (E–F) B6 mice were injected with PBS (n=10–20 wt-infected mice; n=10–20 ΔslrP-infected mice) or rIL-1β (0.05μg/gram mouse, n=15 wt-infected mice). Food consumption (E) and weight loss (F) were measured. (E) Data represent 2–3 experiments combined. (G) Western blot analysis of CASPASE-1 cleavage (p20) in IECs (top) and LP leukocytes (bottom) isolated from infected mice. Leukocytes were combined from 5 wt-infected mice and from 5 ΔslrP-infected mice at 24hr and 48hr post-infection. (H) Quantitative PCR analysis of Il1β expression in IECs and LP leukocytes 48hr after oral infection of B6 mice with wt or ΔslrP ST. n=5/group. ****p<0.0001, ***p<0.001, ** p<0.01, *p<0.05 by unpaired student’s t test or Log rank analysis for survival. NS indicates not significant by unpaired student’s t-test. ND indicates none detected above limit of detection. Error bars indicate +/− SEM. See Figure S3.
Figure 5
Figure 5. Salmonella regulates the anorexic response and virulence via the gut-brain axis
(A–B) Il1β−/− mice orally infected with ΔslrP were fed ad libitum (n=6) or given restricted amounts of food (n=6). ΔslrP-infected B6 mice (n=5) were fed ad libitum. Weight loss (A) and survival (B) were measured. (C) Heat map of differentially expressed genes in the hypothalamus of wt (n=3) and ΔslrP (n=3) infected B6 mice 48hr post-infection. (D) Quantitative PCR analysis of genes identified in (C) in the hypothalamus of B6 mice infected with wt (n=4) or ΔslrP (n=4) and Il1β−/− (n=10) mice infected with ΔslrP ST for 48hr. (E) Feeding of ΔslrP-infected vagotomized or sham B6 mice. Values normalized to feeding amounts of uninfected mice. n=9–10/group. Data represent 2 independent experiments combined. (F) Quantitative PCR analysis of genes identified in (C) in the hypothalamus of ΔslrP-infected vagotomized or sham B6 mice at 48hrs post-infection. n=4–5/group. (G) Levels of mature IL-1β were determined by IL-1R reporter assay 48hr post-infection in SI of ΔslrP-infected vagotomized or sham B6 mice. Graph shown depicts reporter fluorescence (arbitrary units), indicative of active IL-1β. n=4–5/group. ****p<0.0001, ***<0.01, **p<0.05, *p=0.05. Unpaired student t-test, one-sample t test, or Log rank analysis for survival. Error bars indicate +/− SEM. Il1β for (D) is from hypothalamus from 48hr and 72hr. See Figure S4 and S5.
Figure 6
Figure 6. Anorexia creates tradeoffs between virulence and transmission
(A) Animals were assigned a liver dissemination score of “1” or “0” at 72hr post-infection. n=10/group (B) Animals from (A) were assigned a score of “1” or “0” to determine fecal shedding index at 72hr post-infection. (C) CFU in liver of mice from (A) was plotted against fecal shedding index (B) for each individual mouse. “−“ denotes mice with no fecal shedding, and “+” denotes mice with fecal burden. (D) CFU detected in feces of mice from (A) was plotted against liver dissemination index (C) for each individual mouse. “−“ denotes mice with no liver dissemination, and “+” denotes mice with liver burden. (E) B6 mice were orally infected with wt or ΔslrP ST (wt-primary or ΔslrP-primary) and co-housed with an uninfected B6 mouse (wt-secondary or ΔslrP-secondary). Fecal samples were collected every 24hrs post-infection from primary and secondary hosts for CFU analysis. Mice were assigned a score of “1” or “0” n=8–15 mice/group. Data combined from 2 experiments. (F) Survival of mice from (E). 8–10 mice/group. ** represent statistical significance between both primary groups or both secondary groups. (G) Model of how wt and ΔslrP ST regulate anorexia, virulence and transmission. ****p<0.0001, ***p<0.01, **p<0.05. unpaired student t-test, one way ANOVA with tukey post-test or Log rank analysis. Dotted line indicates limit of detection, and mice with no CFU detected in indicated tissue are indicated by symbols below this line. See Figure S6.

Comment in

References

    1. Alexander M. Why microbial predators and parasites do not eliminate their prey and hosts. Annu Rev Microbiol. 1981;35:113–133. - PubMed
    1. Ayres JS. Inflammasome-microbiota interplay in host physiologies. Cell host & microbe. 2013;14:491–497. - PubMed
    1. Ayres JS. Cooperative Microbial Tolerance Behaviors in Host-Microbiota Mutualism. Cell. 2016;165:1323–1331. - PMC - PubMed
    1. Ayres JS, Schneider DS. The role of anorexia in resistance and tolerance to infections in Drosophila. PLoS biology. 2009;7:e1000150. - PMC - PubMed
    1. Bedoyan JK, Patil CS, Kyriakides TR, Spence KD. Effect of Excess Dietary Glucose on Growth and Immune-Response of Manduca-Sexta. J Insect Physiol. 1992;38:525–532.

Publication types