. 2017 Feb 21;8(8):13277-13292.
doi: 10.18632/oncotarget.14809.

Differential regulation of cellular functions by the C-termini of transmembrane 4 L six family proteins in 2- or 3-dimensional environment

Affiliations

Differential regulation of cellular functions by the C-termini of transmembrane 4 L six family proteins in 2- or 3-dimensional environment

Jin-Gyu Cheong et al. Oncotarget. .

Abstract

The transmembrane 4 L six family proteins TM4SF1, TM4SF4, and TM4SF5 share 40-50% overall sequence identity, but their C-terminus identity is limited. It may be likely that the C-termini of the members are important and unique for own regulatory functions. We thus examined how the TM4SF5 C-terminus affected cellular functions differentially from other family members. Using colon cancer cells expressing wildtype (WT), C-terminus-deleted, or chimeric mutants, diverse cellular functions were explored in 2-dimensional (2D) and 3-dimensional (3D) condition. The C-termini of the proteins were relatively comparable with respect to 2D cell proliferation, although each C-terminal-deletion mutant exhibited increased proliferation relative to the WT. Using chimeric constructs, we found that the TM4SF5 C-terminus was critical for regulating the diverse metastatic functions of TM4SF5, and could positively replace the C-termini of other family members. Replacement of the TM4SF1 or TM4SF4 C-terminus with that of TM4SF5 increased spheroids growth, transwell migration, and invasive dissemination from spheroids in 3D collagen gels. TM4SF5-mediated effects required its extracellular loop 2 linked to the C-terminus via the transmembrane domain 4, with causing c-Src activation. Altogether, the C-terminus of TM4SF5 appears to mediate pro-migratory roles, depending on a structural relay from the second extracellular loop to the C-terminus.

Keywords: 3D cell culture; migration; proliferation; spheroids; transmembrane 4 L six family.


Conflict of interest statement

CONFLICTS OF INTEREST

The authors declare no conflicts of interest.

Figures
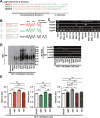
Figure 1
Figure 1. The C-termini of transmembrane 4 L six family members 1, 4, and 5 had similar effects on cell growth in 2D culture condition
A. Alignment of the C-terminal sequences of TM4SF1, TM4SF4, and TM4SF5 showed differences in the sequences around their cytosolic tails. B. Schemes of the wild-type (WT) and deletion or chimeric mutants used in the study. C. mRNA levels of tm4sf1, tm4sf4, and tm4sf5 in different colon cancer cells. D. Expression levels of the constructs (protein in left panel and mRNA in right panel) in stable HCT-116 cells. Within the TM4SF1 backbone (e.g., WT TM4SF1 [1WT], C-terminus-deleted TM4SF1 [1ΔC], and a chimera with the TM4SF5 C-terminus linked to the other parts of TM4SF1 [1C5]), the expression levels were similar each other. As for the TM4SF4 and TM4SF5 backbone, their expression levels were also comparable within each backbone. E. Growth of stable cells was monitored (from day 1 to day 2 after seeding) using an MTT assay, as described in the Materials and Methods. Values shown are the mean ± standard deviation (SD). *, **, and *** denote statistically significant differences at p <0.05, 0.005, or 0001, respectively, and ‘ns’ indicates a nonsignificant difference at p ≥ 0.05, by the ANOVA with Tukey's post-tests. The data shown represent three independent experiments.
Figure 2
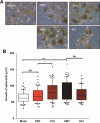
Figure 2. TM4SF5 and its C-terminus promoted sphere growth in 3D aqueous culture environment to a greater degree than TM4SF1
A. Cells (5,000 cells/condition) were cultured in Ultra-low-attachment 6-well plates for 7 days, before representative images were acquired. B. The diameter of spheres in the wells was determined using an Image J software, before their volume was calculated. Values shown are the mean ± SD values. *, **, and *** denote statistically significant differences at p <0.05, 0.005, or 0001, respectively, and ‘ns’ indicates a nonsignificant difference at p ≥ 0.05 by the ANOVA with Tukey's post-tests. The data shown represent three independent experiments.
Figure 3
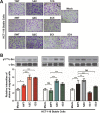
Figure 3. TM4SF1 and TM4SF5 but not TM4SF4 promoted enhanced transwell migration, and the TM4SF5 C-terminus could replace the pro-migratory effect of the TM4SF1 C-terminus
A. Cells incubated with 1% BSA-DMEM for 2 h were loaded (105 cells/condition) to the transwell chambers, the bottom sides of which were pre-coated with collagen I (10 μg/ml). After 10 h, cells that had migrated through the transwell chambers were stained with 5% crystal violet, and images were then acquired randomly; representative images are shown. B. The number of migrated cells from 10 random images per experimental condition were determined using an Image J software based on the intensity of staining. Values shown are the mean ± SD. Immunoblots for phospho-Tyr416 in c-Src and c-Src were performed using whole-cell lysates of the stable cells. *, **, and *** denote statistically significant differences at p <0.05, 0.005, or 0001, respectively, and ‘ns’ indicates a nonsignificant difference at p ≥ 0.05 by the ANOVA with Tukey's post-tests. The data shown represent three independent experiments.
Figure 4
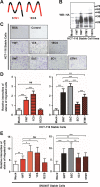
Figure 4. The TMs of TM4SF5, but not the EC2 alone, could promote transwell migration
A. The schematic illustration of chimeras in which the TMs or the ECLs were exchanged between TM4SF1 and TM4SF5. B. Stable cells were harvested to prepare whole-cell lysates before standard Western blotting was performed using anti-HA antibody. Expression levels of the WT and chimeric mutants of TM4SF1 and TM4SF5. C. Transwell migration assay using transwell inserts pre-coated with collagen I (10 μg/ml) was carried out for 10 h using stable HCT-116 cells (105 cells/condition), as explained in the legend for Figure 3. Images representative of 10 random images acquired per experimental condition are shown. D and E. Stable HCT-116 (D) or SNU407 (E) colon cancer cells (105 cells/condition) were analyzed using transwell chambers for 13 h, as described in the legend for Figure 3. Cells that had migrated under each experimental condition were stained, and the staining intensity for 10 random images per condition was measured using Image J software. Values shown are the mean ± SD values. *, **, and *** denote statistically significant differences at p <0.05, 0.005, or 0001, respectively, and ‘ns’ indicates a nonsignificant difference at p ≥ 0.05 by the ANOVA with Tukey's post-tests. The data shown represent three independent experiments.
Figure 5
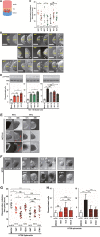
Figure 5. TM4SF5 and its C-terminus could positively replace the effects of TM4SF1 and TM4SF4 to promote invasive dissemination from spheroids embedded in 3D collagen I gels
A. Scheme of the ‘on-top’ 3D ECM-surrounded culture environment, in which the cells (red) were mixed with a lower concentration (yellow-pink) of collagen I gel (0.2 mg/ml) and overlaid on the bottom dense layer with collagen I gel at a higher concentration (blue, 2 mg/ml) that was previously solidified. B to E. Representative images of the starting (each left) and ending (each right) points of the live-imaged spheroids in each condition were shown (B and E). The two-tailed unpaired Student's t-test was used for the analysis in (B). * denotes statistically a significant difference at p <0.05, but ‘ns’ insignificantly at p ≥0.05. The dissemination initiation times (C) or numbers of cells disseminating (D) from the spheroids were measured during the live-imaging for 36 (C) or 24 (D) h and are presented in the graph as mean ± SD values. White arrow heads depict the disseminating cells (B). Immunoblotting for phospho-Tyr397 in FAK and FAK was performed by using the whole cell lysates prepared from the spheroids in 3D collagen I gels. PP2 or PP3 (10 μM) was added to the gels during the embedding processes, before 24 h live-imaging (E). F to H. Stable HT29 cells were also processed for spheroids for live imaging of spheroids as in (B). The starting (each left) and ending (each right) points of the dissemination process during the live imaging periods were presented (F). The initiation time points during live-imaging for 24 h (G) and numbers of cells disseminating from spheroids embedded in collagen I gels (H) were presented in the graphs as the mean ± SD values. The x/y values indicate that dissemination process was observed in x cases out of y spheroids cases we examined. *, **, and *** denote statistically significant differences at p <0.05, 0.005, or 0001, respectively, and ‘ns’ indicates a nonsignificant difference at p ≥ 0.05 by the ANOVA with Tukey's post-tests. The data shown represent three independent experiments.
Figure 6
Figure 6. The structural relay from the EC2 to the C-terminus of TM4SF5 was important for the TM4SF5-mediated dissemination
A. Spheroids were embedded into the 3D collagen I gels with DMSO or TSAHC (40 μM), before the 24 h live imaging. The starting (0 h) and ending (24 h) time points of imaging were shown. B. The dissemination initiation time of was determined. Data shown were the mean ± SD values. * denotes statistically a significant difference at p <0.05, and ‘ns’ indicates a nonsignificant difference at p ≥ 0.05 by the ANOVA with Tukey's post-tests. C. Whole-cell extracts were prepared from spheroids treated with DMSO or TSAHC (20 μM) for 24 h and grown in 3D collagen I environment. Relative phospho-Tyr416 levels in c-Src were determined using standard Western blotting, and the intensity of each band under each experimental conditions was measured and presented. The data shown represent three independent experiments. D. Hepatic SNU449T7 cells ectopically-expressing TM4SF5 were subcutaneously injected to mice and after the tumor volumes reached to 100 mm3, the mice were treated intraperitoneally with PP2 (a specific c-Src inhibitor, 3 mg/kg, n = 4) or PP3 (a negative control for PP2, 3 mg/kg, n = 4) every day for 10 days.

Similar articles

Cited by

References

    1. Yanez-Mo M, Barreiro O, Gordon-Alonso M, Sala-Valdes M, Sanchez-Madrid F. Tetraspanin-enriched microdomains: a functional unit in cell plasma membranes. Trends Cell Biol. 2009;19:434–446. - PubMed
    1. Detchokul S, Williams ED, Parker MW, Frauman AG. Tetraspanins as regulators of the tumour microenvironment: implications for metastasis and therapeutic strategies. Br J Pharmacol. 2014;171:5462–5490. - PMC - PubMed
    1. Charrin S, Jouannet S, Boucheix C, Rubinstein E. Tetraspanins at a glance. J Cell Sci. 2014;127(Pt 17):3641–3648. - PubMed
    1. Lee JW. Transmembrane 4 L Six Family Member 5 (TM4SF5)-Mediated Epithelial-Mesenchymal Transition in Liver Diseases. Int Rev Cell Mol Biol. 2015;319:141–163. - PubMed
    1. Shih SC, Zukauskas A, Li D, Liu G, Ang LH, Nagy JA, Brown LF, Dvorak HF. The L6 protein TM4SF1 is critical for endothelial cell function and tumor angiogenesis. Cancer Res. 2009;69:3272–3277. - PMC - PubMed

MeSH terms

LinkOut - more resources