. 2017 Jan 28;8(1):15.
doi: 10.1186/s13287-017-0484-7.

Two-photon FLIM of NAD(P)H and FAD in mesenchymal stem cells undergoing either osteogenic or chondrogenic differentiation

Affiliations

Two-photon FLIM of NAD(P)H and FAD in mesenchymal stem cells undergoing either osteogenic or chondrogenic differentiation

Aleksandra V Meleshina et al. Stem Cell Res Ther. .

Abstract

Background: Metabolic plasticity and the versatility of different lineages of stem cells as they satisfy their energy demands are not completely understood. In this study we investigated the metabolic changes in mesenchymal stem cells (MSCs) undergoing differentiation in two directions, osteogenic and chondrogenic, using two-photon fluorescence microscopy combined with FLIM.

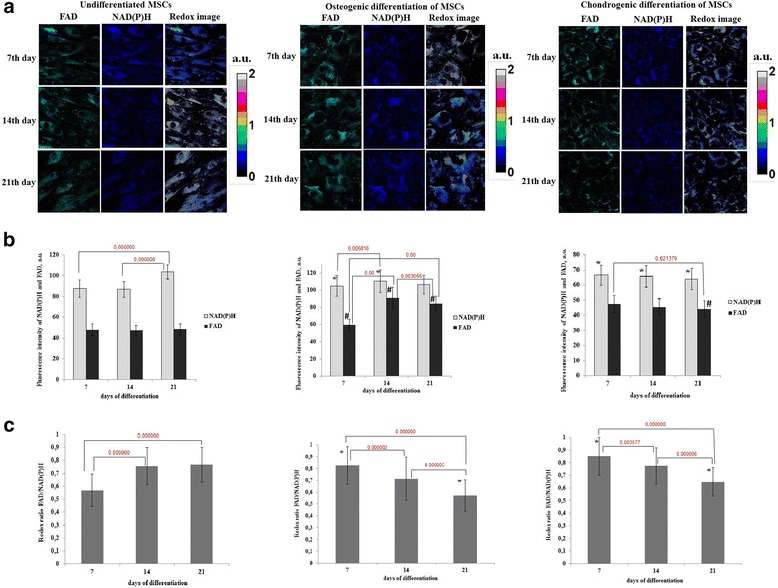
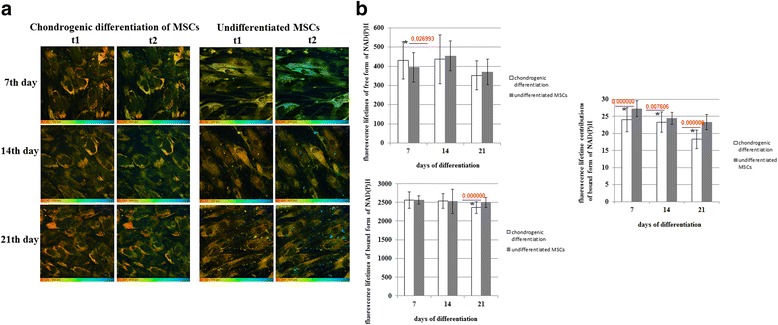
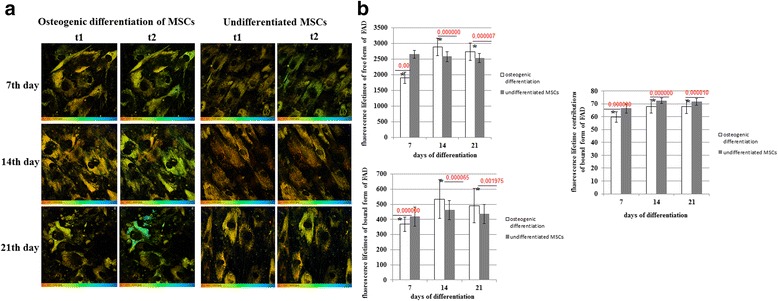
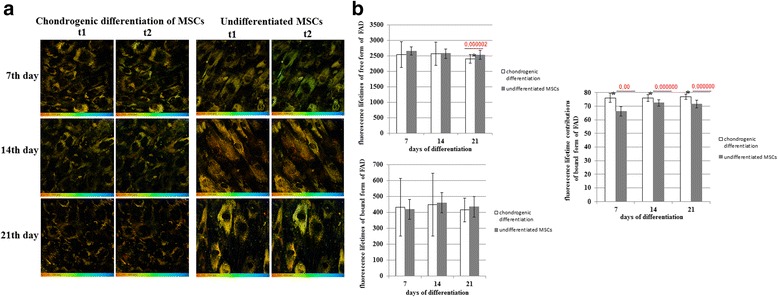
Methods: Differentiation was induced by incubating the human bone marrow MSCs in osteogenic or chondrogenic mediums. Cellular metabolism was examined on the basis of the fluorescence of the metabolic cofactors NAD(P)H and FAD. The optical redox ratio (FAD/NAD(P)H) and the fluorescence lifetimes of NAD(P)H and FAD were traced using two-photon fluorescence microscopy combined with FLIM. The cells were imaged before the induction of differentiation (day 0) and on days 7, 14, and 21 of osteogenic and chondrogenic differentiation.

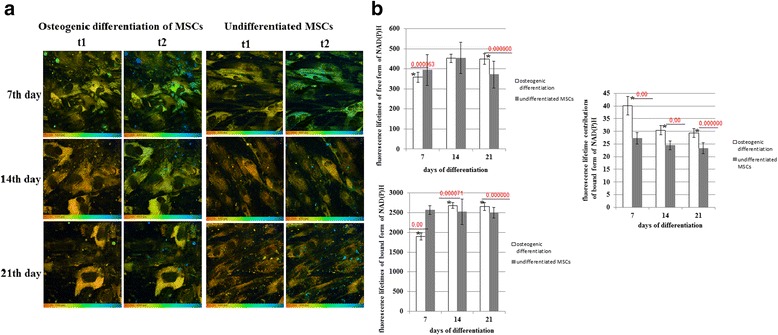
Results: Based on the data for the FAD/NAD(P)H redox ratio and on the fluorescence lifetimes of protein-bound NAD(P)H, we registered a metabolic shift toward a more glycolytic status in the process of MSC differentiation. The difference was that, in osteogenic differentiation, an increase in oxidative phosphorylation preceded the shift to the glycolytic status in the process of such MSC differentiation. The fluorescence lifetime characteristics of FAD indicated the stimulation of an unknown metabolic pathway, where protein-bound FAD participates.

Conclusions: In this study, probing of the metabolic status of MSCs during osteogenic and chondrogenic differentiation was implemented for the first time with the use of optical metabolic imaging of the two cofactors - NAD(P)H and FAD. Our data suggest that biosynthetic processes, associated, presumably, with the synthesis of collagen, drive energy metabolism in differentiating cells, and promote a metabolic shift from a more oxidative to a more glycolytic state.

Keywords: FAD; FLIM; Mesenchymal stem cells; Metabolic shift; NAD(P)H; Osteogenic and chondrogenic differentiation; Two-photon fluorescence microscopy.


Figures

Fig. 1
Fig. 1
Microscopic images of undifferentiated and differentiated MSCs in transmitted light. a Undifferentiated MSCs, incubated in standard growth medium b MSCs on day 21 of osteogenic differentiation (Alizarin Red S staining) c MSCs on day 21 of chondrogenic differentiation (Alcian blue staining). The image size is 1289 × 964 μm (1392 × 1041 pixels)
Fig. 2
Fig. 2
Overlapped two-photon excited autofluorescence (green) and SHG (red) images of undifferentiated MSCs, and MSCs during osteogenic and chondrogenic differentiation on day 21. The image size is 130 × 130 μm (512 × 512 pixels). MSCs mesenchymal stem cells
Fig. 3
Fig. 3
Redox ratio of FAD/NAD(P)H in differentiating MSCs. a Fluorescence and optical redox images of undifferentiated MSCs and MSCs during osteogenic and chondrogenic differentiation. Fluorescence of FAD is shown in green, fluorescence of NAD(P)H in blue. b Dynamics of the fluorescence intensity of NAD(P)H and FAD in undifferentiated MSCs and MSCs during osteogenic and chondrogenic differentiation, mean ± SD. *Statistically significant difference on NAD(P)H with undifferentiated MSCs on the same day; #statistically significant difference on FAD with undifferentiated MSCs on the same day c Dynamics of the ratio in undifferentiated MSCs and MSCs during osteogenic and chondrogenic differentiation, mean ± SD. *Statistically significant difference with undifferentiated MSCs on the same day. For NAD(P)H: excitation - 750 nm, detection - 455–500 nm; for FAD: excitation - 900 nm, detection - 500–550 nm. The image size is 213 × 213 μm (1024 × 1024 pixels). FAD oxidized form of flavin adenine dinucleotide, MSCs mesenchymal stem cells, NAD(P)H reduced nicotinamide adenine dinucleotide (phosphate)
Fig. 4
Fig. 4
FLIM of NAD(P)H in MSCs during osteogenic differentiation. a Pseudocolor-coded images of the free (t1) and protein-bound (t2) forms of NAD(P)H. Field of view 213*213 μm (512*512 pixels). b Dynamics of the fluorescence lifetimes of free and protein-bound forms of NAD(P)H and fluorescence lifetime contributions of the protein-bound forms of NAD(P)H in MSCs. Mean ± SD. *Statistically significant difference with undifferentiated MSCs on the same day. P values are shown. MSCs mesenchymal stem cells, NAD(P)H reduced nicotinamide adenine dinucleotide (phosphate)
Fig. 5
Fig. 5
FLIM of NAD(P)H in MSCs during chondrogenic differentiation. a Pseudocolor-coded images of the free (t1) and protein-bound (t2) forms of NAD(P)H. Field of view 213*213 μm (512*512 pixels). b Dynamics of the fluorescence lifetimes of free and protein-bound forms of NAD(P)H and fluorescence lifetime contributions of the protein-bound forms of NAD(P)H in MSCs. Mean ± SD. *Statistically significant difference with undifferentiated MSCs on the same day. P values are shown. MSCs mesenchymal stem cells, NAD(P)H reduced nicotinamide adenine dinucleotide (phosphate)
Fig. 6
Fig. 6
FLIM of FAD in MSCs during osteogenic differentiation. a Pseudocolor-coded images of the protein-bound (t1) and free (t2) forms of FAD. Field of view 213*213 μm (512*512 pixels). b Dynamics of the fluorescence lifetimes of free and protein-bound forms of FAD and fluorescence lifetime contributions of the protein-bound forms of FAD in MSCs. Mean ± SD. *Statistically significant difference with undifferentiated MSCs on the same day. P values are shown. FAD oxidized form of flavin adenine dinucleotide, MSCs mesenchymal stem cells
Fig. 7
Fig. 7
FLIM of FAD in MSCs during chondrogenic differentiation. a Pseudocolor-coded images of the protein-bound (t1) and free (t2) forms of FAD. Field of view 213*213 μm (512*512 pixels). b Dynamics of the fluorescence lifetimes of free and protein-bound forms of FAD and fluorescence lifetime contributions of the protein-bound forms of FAD in MSCs. mean ± SD. *Statistically significant difference with undifferentiated MSCs on the same day. P values are shown. FAD oxidized form of flavin adenine dinucleotide, MSCs mesenchymal stem cells

References

    1. Becker W. Advanced time-correlated single photon counting applications. 1. Switzerland: Springer International Publishing; 2015.
    1. Ghukasyan VV, Kao FJ. Monitoring cellular metabolism with fluorescence lifetime of reduced nicotinamide adenine dinucleotide. J Phys Chem C. 2009;113(27):11532–40. doi: 10.1021/jp810931u. - DOI
    1. Heikal AA. Intracellular coenzymes as natural biomarkers for metabolic activities and mitochondrial anomalies. Biomark Med. 2010;4(2):241–63. doi: 10.2217/bmm.10.1. - DOI - PMC - PubMed
    1. Clegg RM, Holub O, Gohlke C. Fluorescence lifetime-resolved imaging: measuring lifetimes in an image. Methods Enzymol. 2003;360:509–42. doi: 10.1016/S0076-6879(03)60126-6. - DOI - PubMed
    1. Becker W. Fluorescence lifetime imaging--techniques and applications. J Microsc. 2012;247(2):119–36. doi: 10.1111/j.1365-2818.2012.03618.x. - DOI - PubMed