. 2017 Apr 20;129(16):2280-2290.
doi: 10.1182/blood-2016-09-740670. Epub 2017 Jan 27.

Plasma kallikrein mediates brain hemorrhage and edema caused by tissue plasminogen activator therapy in mice after stroke

Affiliations

Plasma kallikrein mediates brain hemorrhage and edema caused by tissue plasminogen activator therapy in mice after stroke

Fabrício Simão et al. Blood. .

Abstract

Thrombolytic therapy using tissue plasminogen activator (tPA) in acute stroke is associated with increased risks of cerebral hemorrhagic transformation and angioedema. Although plasma kallikrein (PKal) has been implicated in contributing to both hematoma expansion and thrombosis in stroke, its role in the complications associated with the therapeutic use of tPA in stroke is not yet available. We investigated the effects of tPA on plasma prekallikrein (PPK) activation and the role of PKal on cerebral outcomes in a murine thrombotic stroke model treated with tPA. We show that tPA increases PKal activity in vitro in both murine and human plasma, via a factor XII (FXII)-dependent mechanism. Intravenous administration of tPA increased circulating PKal activity in mice. In mice with thrombotic occlusion of the middle cerebral artery, tPA administration increased brain hemorrhage transformation, infarct volume, and edema. These adverse effects of tPA were ameliorated in PPK (Klkb1)-deficient and FXII-deficient mice and in wild-type (WT) mice pretreated with a PKal inhibitor prior to tPA. tPA-induced brain hemisphere reperfusion after photothrombolic middle cerebral artery occlusion was increased in Klkb1-/- mice compared with WT mice. In addition, PKal inhibition reduced matrix metalloproteinase-9 activity in brain following stroke and tPA therapy. These data demonstrate that tPA activates PPK in plasma and PKal inhibition reduces cerebral complications associated with tPA-mediated thrombolysis in stroke.


Figures

Figure 1.
Figure 1.
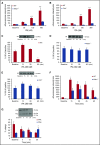
PKal is activated by tPA in human plasma. (A) Concentration-response curves of tPA in human plasma. Purified human tPA (0-360 nM) was incubated in human plasma for 10 minutes at room temperature. Kallikrein-like activity was determined by measuring changes in fluorescence at 410 nm because of hydrolysis of D-Pro-Phe-Arg-7-Amino-4-Trifluoromethylcoumarin. Data are expressed as fluorescence intensity and represent mean ± SEM of 3 independent experiments. **P < .01 vs vehicle. Insert: Dose response of inhibition of kallikrein-like activity by BPCCB (0.1-3 μM; n = 3 independent experiments). (B) Effects of tPA on kallikrein-like activity in normal, plasminogen-, FXII-, or prekallikrein-deficient plasma. Data are expressed as ∆ fluorescence intensity per minute and represent mean ± SEM of 3 independent experiments. **P < .01; ***P < .001. (C) Time course of PKal production by FXIIa. Purified human PPK (0.4 μM) was incubated with 0.5 μM purified human tPA or 0.5 μM purified human plasmin or 0.5 μM purified human FXIIa for time course. Analysis of the incubation mixture by western blot demonstrates PPK cleavage by FXIIa. (D) Time course of FXIIa production by plasmin and PKal. Purified human FXII (0.37 μM) was incubated with 0.5 μM purified human tPA or 0.5 μM purified human plasmin or 0.5 μM purified human PKal for time course. Analysis of the incubation mixture by western blot demonstrates FXII cleavage by plasmin and PKal. (E) Time course of FXIIa activity. Data are expressed as fluorescence intensity and represent mean ± SEM of 3 independent experiments.
Figure 2.
Figure 2.
Effects of tPA on PKal activity in mouse plasma. (A) Concentration-response curves of tPA in WT and Klkb1−/− mice plasma. Purified human tPA (0-360 nM) was incubated in mouse plasma in vitro for 10 minutes at room temperature. Kallikrein-like activity was measured as fluorescence at 410 nm because of hydrolysis of D-Pro-Phe-Arg-7-Amino-4-Trifluoromethylcoumarin. Data are expressed as ∆ fluorescence intensity per minute and represent mean ± SEM of 3 independent experiments. ***P < .001 vs baseline. (B) Concentration-response curves of tPA in WT and FXII−/− mice plasma. Purified human tPA (0-360 nM) was incubated in mouse plasma in vitro for 10 minutes at room temperature. Data are expressed as ∆ fluorescence intensity per minute and represent mean + SEM of 3 independent experiments. ***P < .001 vs baseline. (C) Bar graph displays the time course of HK in WT mouse plasma incubated with tPA (360 nM). Representative western blot image is shown on top of the bar graph. Data are presented as mean ± SEM, n = 4. *P < .05 vs baseline. (D) Bar graph displays the time course of HK in Klkb1−/− mouse plasma incubated with tPA (360 nM). Representative western blot image is shown on top of the bar graph. Data are presented as mean ± SEM, n = 4. (E) Bar graph displays the time course of HK in FXII−/− mouse plasma incubated with tPA (360 nM). Representative western blot image is shown on top of the bar graph. Data are presented as mean ± SEM, n = 4. (F) Time-response of PPK activation in mouse plasma after tPA injection. Mice were treated intravenously with tPA (10 mg/kg) and blood collected at 15, 30, 45, and 60 minutes after injection. Data are expressed as ∆ fluorescence intensity per minute and represent mean ± SEM of 4 independent experiments. *P < .05 vs baseline. (G) Bar graph displays the time course of PKal generation after tPA injection. Representative western blot image is shown on top of the bar graph. Data are presented as mean ± SEM, n = 4. *P < .05 vs baseline.
Figure 3.
Figure 3.
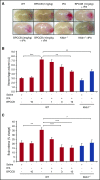
Effect of PKal on tPA-mediated intracerebral hemorrhage transformation after ischemic stroke in mice. (A) Representative coronal sections of brain mice at 24 hours after stroke. Red color indicate hemoglobin associated with hemorrhage transformation within the ischemic area in mice treated with tPA and the decreased hemorrhage associated with PKal inhibition on tPA-induced postischemic brain. At 2 hours after stroke onset, mice received tPA (10 mg/kg) either alone of following a 15 minutes pretreatment with BPCCB (1, 3, 10 mg/kg) or saline vehicle. Klkb1−/− mice were treated intravenously with saline or tPA (10 mg/kg). (B) Volumes of intracerebral hemorrhage were quantified with hemoglobin assay at 24 hours after stroke. Data are presented as mean ± SEM, n = 6-8. **P < .01; ***P < .001. (C) Quantitative analysis of brain edema at 24 hours after ischemic stroke. Data are presented as mean ± SEM, n = 7-8. *P < .05; **P < .01; ***P < .001. Numbers in x-axis labels for panels B and C indicate concentrations of BPCCB in milligrams per kilogram.
Figure 4.
Figure 4.
PKal inhibition reduces tPA-induced increases in infarct volume and MMP-9 activation after stroke. (A) Representative coronal sections of 2,3,5-triphenyltetrazolium chloride–stained brain sections of mice at 24 hours after ischemic stroke. At 2 hours after stroke onset, mice received tPA (10 mg/kg) either alone of following a 15 minutes pretreatment with BPCCB (1, 3, 10 mg/kg) or saline vehicle. Klkb1−/− mice were treated intravenously with saline or tPA (10 mg/kg). Ischemic infarctions (white color area) were detected in all groups; however, tPA alone showed a remarkably ischemic volume. (B) Quantitative analysis of infarct volume at 24 hours after ischemic stroke. *P < .05; **P < .01; ***P < .001. Data are presented as mean ± SEM, n = 5-8. Numbers in x-axis labels for panel B indicate concentrations of BPCCB in mg/kg. (C) Coadministration of PKal inhibitor BPCCB with tPA decreases MMP-9 activation in brain after stroke. Representative zymographic analysis of brain extracts from sham and stroke mice treated with vehicle, tPA (10 mg/kg), or BPCCB (10 mg/kg) after MCAO and analyzed at 24 hours after stroke. (D) Quantitative determination of zymographic gels for each treatment. Data are presented as mean ± SEM, n = 5. *P < .05; **P < .01.
Figure 5.
Figure 5.
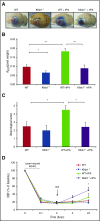
PPK deficiency reduced tPA-induced BBB leakage after ischemic stroke. (A) Representative images of Evans blue extravasations from WT and Klkb1−/− treated with saline or tPA (10 mg/kg) and euthanized at 24 hours after stroke. (B) Quantification of Evans blue fluorescent intensity for each group. Data are presented as mean ± SEM, n = 5-6. *P < .05; **P < .01. (C) Effects of PKal inhibition on tPA-induced neurological dysfunction after ischemic stroke. Neurological severity score was evaluated 24 hours after stroke in WT and Klkb1−/− mice treated with saline or tPA (10 mg/kg). Data are presented as mean ± SEM, n = 5-7. *P < .05. (D) PKal inhibition accelerates reperfusion during tPA treatment after stroke. Quantitative analysis of rCBF showed facilitated reperfusion in Klkb1−/− mice. Laser-Doppler flowmeter was used to monitor rCBF for up to 2 hours and at 24 hours after tPA treatment. Data are presented as mean ± SEM, n = 3-6. *P < .05 vs WT + tPA.
Figure 6.
Figure 6.
FXII deficiency reduces infarct volume and edema after tPA treatment in thrombotic stroke without increasing the risk of intracerebral hemorrhage. (A) Representative images of coronal sections of show cerebral hemorrhage 24 hours after stroke in mice treated with vehicle or tPA in WT and FXII−/− mice. At 2 hours after stroke onset, mice received tPA (10 mg/kg) or saline vehicle. (B) Volumes of intracerebral hemorrhage were quantified with hemoglobin assay at 24 hours after stroke. Data are presented as mean ± SEM, n = 8. **P < .01; ***P < .001. (C) Quantitative analysis of brain edema at 24 hours after ischemic stroke. Data are presented as mean ± SEM, n = 8. *P < .05. (D) Representative coronal sections of 2,3,5-triphenyltetrazolium chloride–stained brain sections of mice at 24 hours after ischemic stroke treated with vehicle or tPA in WT and FXII−/− mice. (E) Quantitative analysis of infarct volume at 24 hours after ischemic stroke. Data are presented as mean ± SEM, n = 8. *P < .05. (F) Effects of FXII inhibition on tPA-induced neurological dysfunction after ischemic stroke. Neurological severity score was evaluated 24 hours after stroke in WT and FXII−/− mice treated with saline or tPA (10 mg/kg). Data are presented as mean ± SEM, n = 5-8. *P < .05.
Figure 7.
Figure 7.
Schematic diagram illustrating the actions of exogenous tPA on KKS after stroke. Exogenous tPA activates plasminogen to plasmin that then activates FXII to FXIIa. Formed FXIIa activates PPK to PKal. Formed PKal contributes to stroke progression by increasing edema, intracerebral hemorrhage, BBB leakage, and infarct volume.

Comment in

Similar articles

Cited by

References

    1. Hacke W, Kaste M, Bluhmki E, et al. ; ECASS Investigators. Thrombolysis with alteplase 3 to 4.5 hours after acute ischemic stroke. N Engl J Med. 2008;359(13):1317-1329. - PubMed
    1. Sharma VK, Teoh HL, Wong LYH, Su J, Ong BKC, Chan BPL. Recanalization therapies in acute ischemic stroke: pharmacological agents, devices, and combinations. Stroke Res Treat. 2010;2010:672064. - PMC - PubMed
    1. Keep RF, Hua Y, Xi G. Intracerebral haemorrhage: mechanisms of injury and therapeutic targets. Lancet Neurol. 2012;11(8):720-731. - PMC - PubMed
    1. Hill MD, Lye T, Moss H, et al. . Hemi-orolingual angioedema and ACE inhibition after alteplase treatment of stroke. Neurology. 2003;60(9):1525-1527. - PubMed
    1. Nicole O, Docagne F, Ali C, et al. . The proteolytic activity of tissue-plasminogen activator enhances NMDA receptor-mediated signaling. Nat Med. 2001;7(1):59-64. - PubMed

Publication types

MeSH terms