

Modulation of mTOR signaling as a strategy for the treatment of Pompe disease
- PMID: 28130275
- PMCID: PMC5331267
- DOI: 10.15252/emmm.201606547
Modulation of mTOR signaling as a strategy for the treatment of Pompe disease
Abstract
Mechanistic target of rapamycin (mTOR) coordinates biosynthetic and catabolic processes in response to multiple extracellular and intracellular signals including growth factors and nutrients. This serine/threonine kinase has long been known as a critical regulator of muscle mass. The recent finding that the decision regarding its activation/inactivation takes place at the lysosome undeniably brings mTOR into the field of lysosomal storage diseases. In this study, we have examined the involvement of the mTOR pathway in the pathophysiology of a severe muscle wasting condition, Pompe disease, caused by excessive accumulation of lysosomal glycogen. Here, we report the dysregulation of mTOR signaling in the diseased muscle cells, and we focus on potential sites for therapeutic intervention. Reactivation of mTOR in the whole muscle of Pompe mice by TSC knockdown resulted in the reversal of atrophy and a striking removal of autophagic buildup. Of particular interest, we found that the aberrant mTOR signaling can be reversed by arginine. This finding can be translated into the clinic and may become a paradigm for targeted therapy in lysosomal, metabolic, and neuromuscular diseases.
Keywords: mTOR; Pompe disease; autophagy; lysosomal storage disorders; myopathy.
© 2017 The Authors. Published under the terms of the CC BY 4.0 license.
Figures
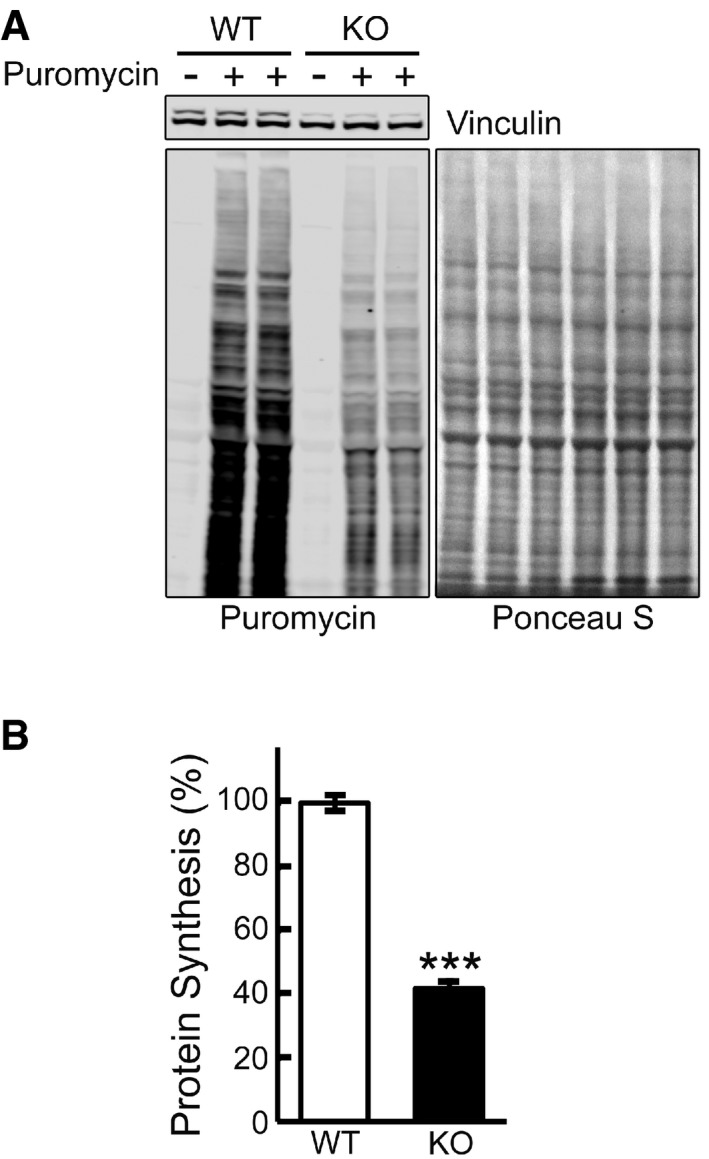
Representative image of Western blot analysis of WT and KO cells treated with puromycin (1 μM) for 30 min. Western blot with anti‐vinculin antibody and Ponceau S staining were used as loading controls.
Total intensity of puromycin‐labeled polypeptides was quantified. Student's t‐test was used for statistical analysis. Data are mean ± SE. ***P < 0.001 (P = 0.0009; n = 4).
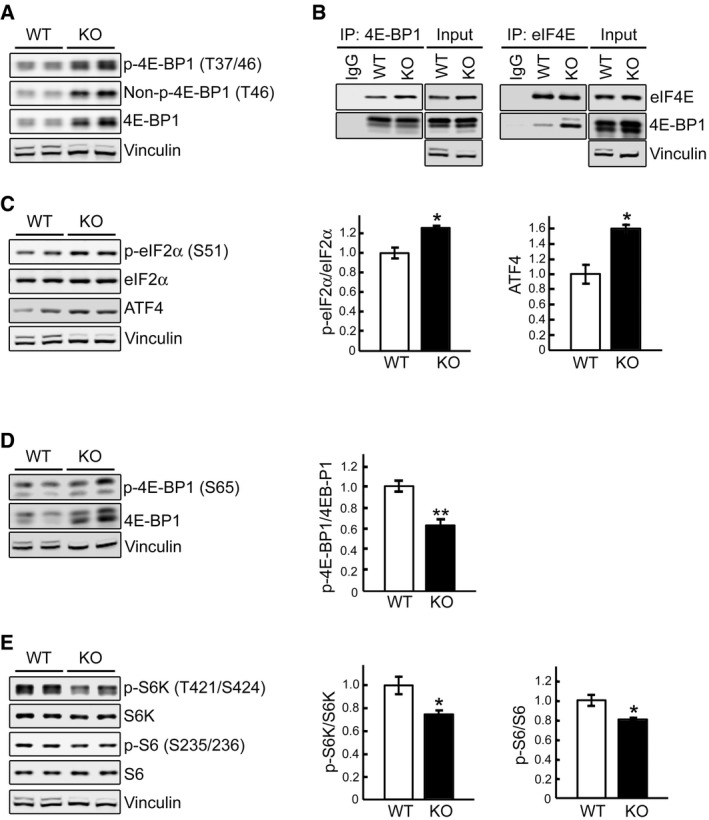
Representative Western blot of total lysates of WT and KO myotubes. All three forms of 4E‐BP1, phosphorylated (p‐4E‐BP1T37/46), non‐phosphorylated (Non‐p‐4E‐BP1T46), and total, are increased in KO cells.
WT and KO cell lysates were immunoprecipitated (IP) with either anti‐4E‐BP1 (left) or anti‐eIF4E (right); the immunoprecipitated proteins were then probed with eIF4E or 4E‐BP1, respectively. Increased eIF4E/4E‐BP1 binding is seen in KO cells. Immunoprecipitation with IgG was included as negative control.
Representative Western blot of total lysates of WT and KO myotubes with the indicated antibodies. The levels of eIF2αS51 and ATF4 are increased in KO cells; graphs represent mean ± SE of p‐eIF2α/eIF2α ratios (n = 3) and ATF4 (n = 3) levels. *P < 0.05, Student's t‐test.
Immunoblot analysis of WT and KO lysates showing an increase in both total and p‐4E‐BP1S65 and a decrease in p‐4E‐BP1S65/4E‐BP1 ratio in KO cells; graph represents mean ± SE (n = 6). **P < 0.01, Student's t‐test.
Immunoblot analysis of WT and KO lysates showing a decrease in the p‐S6K/S6K (n = 5) and p‐S6/S6 (n = 6) ratios in KO cells; graphs represent mean ± SE. *P < 0.05, Student's t‐test.
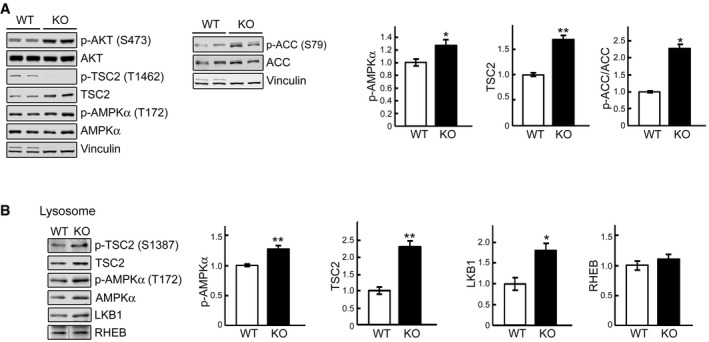
Immunoblot analysis of the phosphorylation levels of AKTS473, TSCT1462, AMPKαT172, and ACCS79 in WT and KO cell lysates. Graphs represent mean ± SE. n = 6 for p‐AMPKα; n = 3 for TSC2; n = 3 for p‐ACC/ACC. *P < 0.05, **P < 0.01, Student's t‐test. Vinculin was used as a loading control.
WT and KO myotubes were lysed and subjected to fractionation to obtain lysosome‐enriched fractions. The isolated fractions were then examined by Western blot showing increased levels of total and p‐TSC2S1387 , total and p‐AMPKαT172, and total LKB1 in KO cells. Graphs represent mean ± SE. n = 5 for each, p‐AMPKα and TSC2; n = 4 for LKB1. *P < 0.05, **P < 0.01, Student's t‐test. RHEB was used as a loading control. The blot for RHEB is a composite image; the samples were run on the same gel.
- A, B
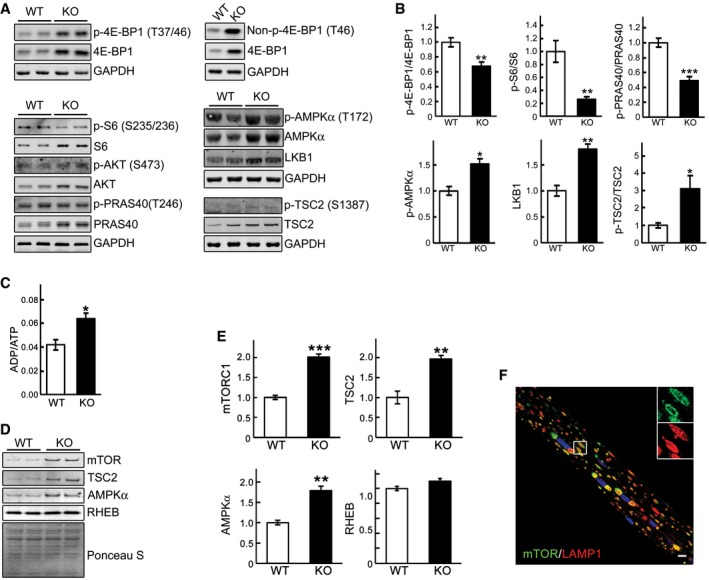
Western blot analysis of whole muscle lysates from WT and GAA‐KO mice with the indicated antibodies. Graphical presentation of the data is shown in (B). Data illustrate the mean ± SE. n = 6 for p‐4E‐BP1/4E‐BP1, p‐S6/S6, p‐PRAS40/PRAS40, and p‐TSC2/TSC2; n = 5 for p‐AMPKα; n = 3 for LKB1. *P < 0.05, **P < 0.01, ***P < 0.001, Student's t‐test. GAPDH was used as a loading control.
- C
An increase in ADP/ATP ratio in whole muscle of GAA‐KO mice. Data illustrate the mean ± SE. n = 3 for WT; n = 4 for KO. *P < 0.05, Student's t‐test.
- D, E
Muscle tissues derived from WT (n = 3) and GAA‐KO mice (n = 4) were homogenized in lysis buffer and subjected to fractionation to obtain lysosome‐enriched fractions. The isolated fractions were then examined by Western blot showing increased levels of total mTOR, TSC2, and AMPKα in GAA‐KO. Graphical presentation of the data is shown in (E). Graphs represent mean ± SE. **P < 0.01, ***P < 0.001, Student's t‐test. RHEB and Ponceau S staining were used to verify equal protein loading.
- F
Immunostaining of a single fiber from a GAA‐KO mouse with anti‐LAMP1 (red) and anti‐mTOR (green) antibodies showing extensive co‐localization of the two stains. Scale bar: 10 μm.
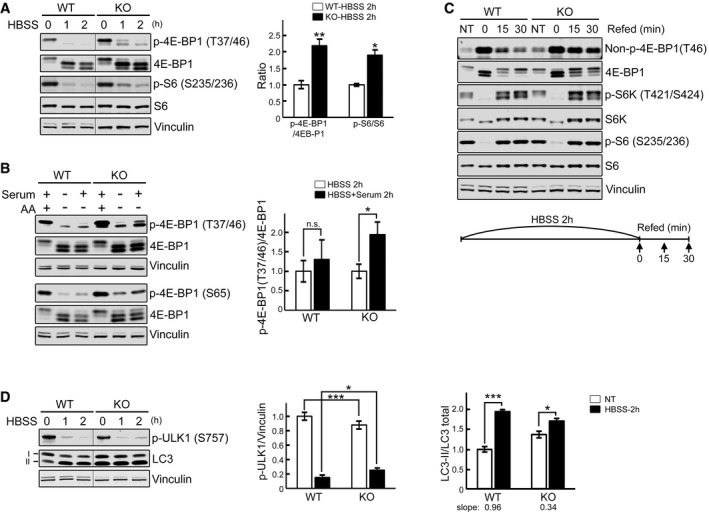
WT and KO myotubes were starved (HBSS) for 0, 1, and 2 h, lysed and subjected to immunoblot analysis with the indicated antibodies. The levels of p‐4E‐BP1T37/46 and p‐S6S235/236 in KO are higher compared to WT at 1 and 2 h of starvation. Graph shows an increase in p‐4E‐BP1T37/46/total (n = 5) and p‐S6S235/236/total (n = 3) ratios in KO compared to WT after 2 h starvation; the data represent mean ± SE. *P < 0.05, **P < 0.01, Student's t‐test. Vinculin was used as a loading control. The blots are composite images; the samples were run on the same gel.
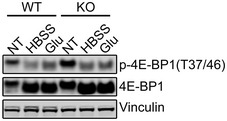
WT and KO myotubes were incubated in HBSS with or without dialyzed serum for 2 h, lysed, and subjected to immunoblot analysis with the indicated antibodies. Both p‐4E‐BP1T37/46 and p‐4E‐BP1S65 antibodies were used for the experiments. The degree of 4E‐BP1 dephosphorylation after amino acid starvation (AA) is different from that after HBSS in KO (*P < 0.05) but not in WT cells (n.s., not significant). Graph represents mean ± SE; Student's t‐test. n = 3 for each condition.
WT and KO myotubes were starved (HBSS) for 2 h, and then refed for 15 and 30 min using differentiation medium as shown schematically. Cell lysates were then subjected to immunoblot analysis with the indicated antibodies. Significant amounts of non‐phosphorylated and hypophosphorylated forms of 4E‐BP1 are still seen after 15 and 30 min of refeeding in KO cells; the levels of S6K and S6 in the KO were not different from those in controls following refeeding.
WT and KO myotubes were starved as in (A). The level of p‐ULK1S757 in KO is higher than in WT after 2 h starvation. The p‐ULK1/vinculin (n = 4) and LC3‐II/total (LC3‐I + LC3‐II; n = 3) ratios at 2 h after starvation were calculated. Data are mean ± SE; *P < 0.05, ***P < 0.001, Student's t‐test. The blots are composite images; the samples were run on the same gel.
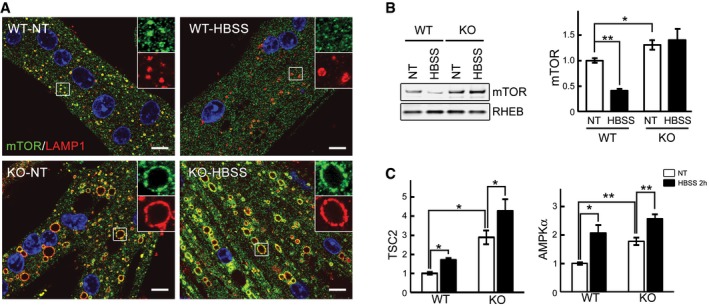
Immunostaining of WT and KO myotubes with anti‐LAMP1 (red) and anti‐mTOR (green) antibodies. Lysosomal localization of mTOR is observed in both WT and KO cells grown in differentiation medium (NT, not treated; fed). Mostly cytosolic localization of mTOR (away from lysosomes) is observed in WT cells after 2 h of starvation (HBSS), whereas the two stains still co‐localize in KO cells. Scale bar: 10 μm.
WT and KO myotubes were lysed and subjected to fractionation to obtain lysosome‐enriched fractions. The isolated fractions from fed (NT) and starved (HBSS; 2 h) cells were then examined by Western blot showing increased levels of mTOR in KO cells. RHEB was used as a loading control. Graphs represent mean ± SE; *P < 0.05, **P < 0.01, Student's t‐test. n = 4 for each condition.
WT and KO myotubes were treated as in (B). Graphs show relative amounts of TSC2 and AMPKα in the lysosomal fraction from WT and KO cells in nutrient‐rich condition (NT; open bars) and after 2 h of starvation (HBSS; black bars). Data are mean ± SE; *P < 0.05, **P < 0.01, Student's t‐test. n = 3 for WT; n = 4 for KO.
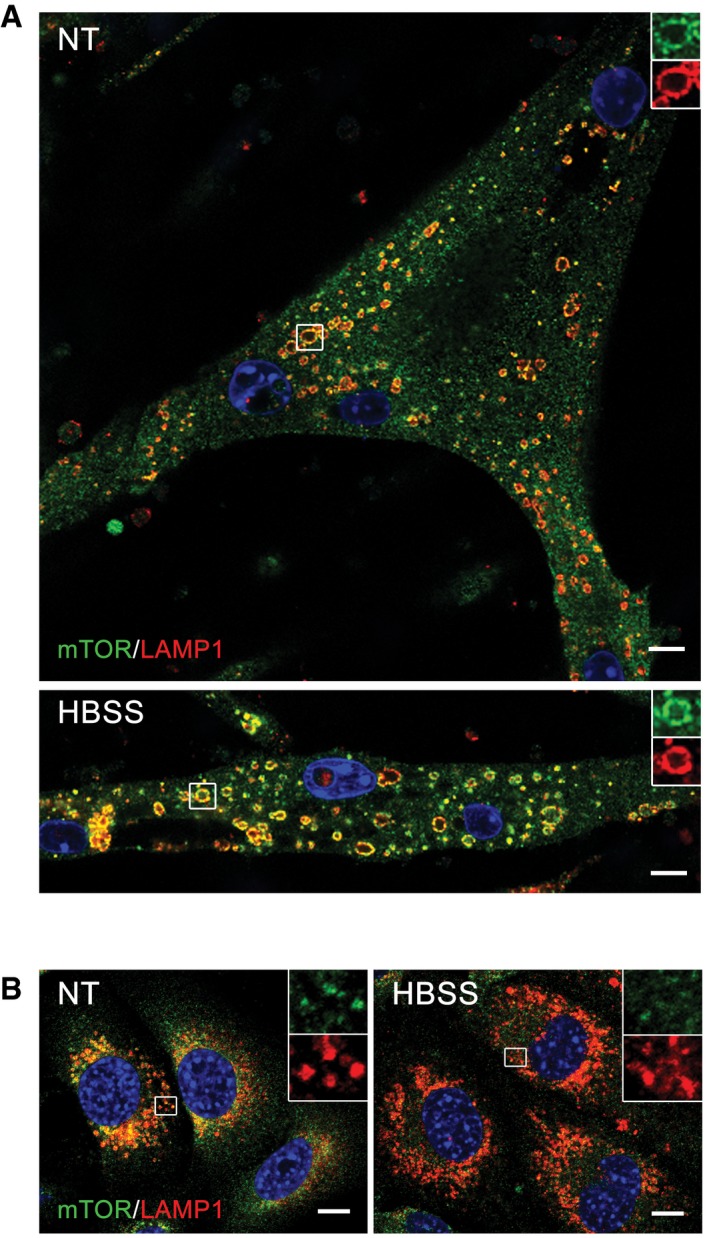
Lysosomal localization of mTOR after starvation (HBSS) in KO cells was confirmed by using a different immortalized KO cell line (clone RF1). The cells were grown in differentiation medium for 8 days, starved for 2 h, and fixed. The images show immunostaining of fed (NT) and starved (HBSS) KO cells with anti‐LAMP1 (red) and anti‐mTOR (green) antibodies. Scale bar: 10 μm.
Immunostaining of KO myoblasts grown in proliferation medium with anti‐LAMP1 (red) and anti‐mTOR (green) antibodies. Lysosomal localization of mTOR is observed in fully fed KO myoblasts (NT). Almost no co‐localization of the two stains is seen in KO myoblasts after 2 h of starvation (HBSS). The images show randomly selected fields of > 100 cells for each condition. Scale bar: 10 μm.
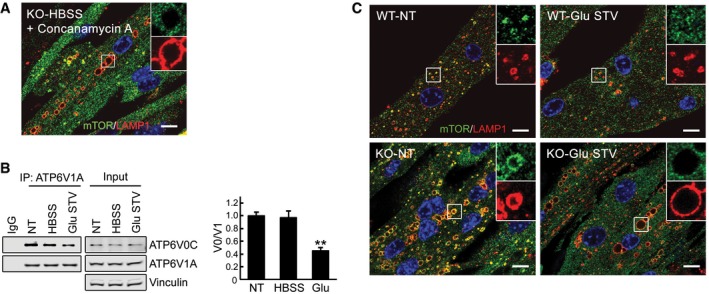
The failure to release mTOR from lysosomes in KO cells is rescued by concanamycin A, an inhibitor of V‐ATPase. KO myotubes were starved in the presence of the compound (1 μM), followed by fixation and immunostaining with anti‐LAMP1 and anti‐mTOR antibodies. The image shows mostly diffused cytosolic localization of the kinase. Scale bar: 10 μm.
Glucose starvation inactivates V‐ATPase by disassembly of its subunits. Immunoblots of anti‐ATP6V1A immunoprecipitates from KO myotubes with ATP6V0C antibodies. A reduced co‐precipitation of subunits V1A and V0C is observed after 2 h of glucose starvation (Glu STV), but not after a 2‐h HBSS exposure (HBSS). NT, not treated. Representative images of three independent experiments are shown. Graphs represent mean ± SE; **P < 0.01, Student's t‐test.
Immunostaining of WT and KO myotubes with anti‐LAMP1 (red) and anti‐mTOR (green) antibodies. Lysosomal localization of mTOR is observed in both WT and KO cells grown in differentiation medium (NT, not treated; see also Fig 6). Mostly cytosolic localization of mTOR is observed in both WT and KO cells after 2 h of glucose starvation. Scale bar: 10 μm.
- A, B
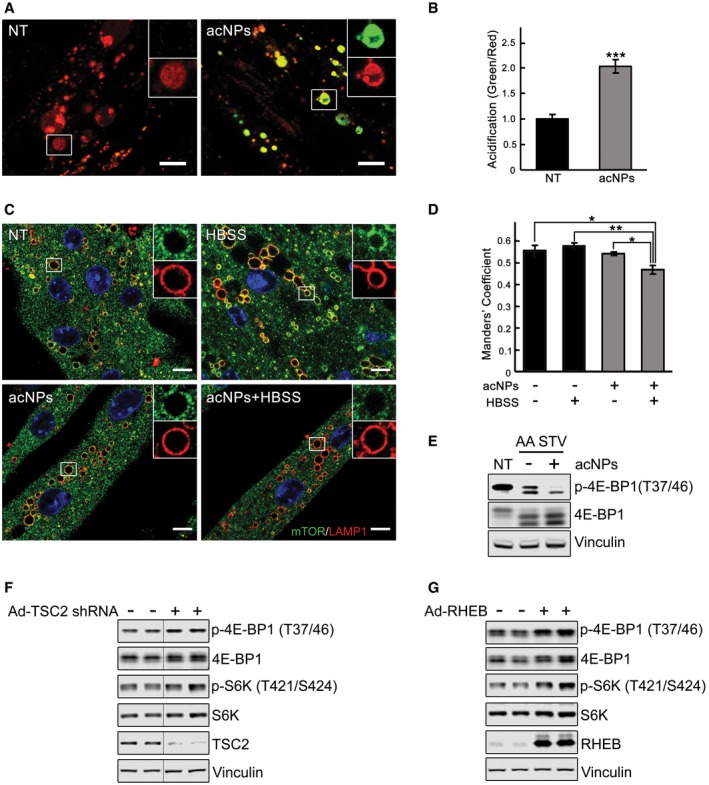
KO myotubes were incubated in the presence (acNPs; 50 μg/ml) or in the absence of acNPs (NT) for 18 h and exposed to UV‐light for 5 min; following 2 h of incubation in differentiation medium, the cells were loaded with LysoTracker Red and LysoSensor Green (30 min), washed, and visualized by confocal microscopy. Both dyes target lysosomes, but only LysoSensor Green becomes more fluorescent in acidic environments. The acNPs‐treated KO cells exhibit a much higher green fluorescence intensity than do untreated cells. Scale bar: 10 μm. The ratios of green/red fluorescence intensities (shown in B) were evaluated using ImageJ software; n = 16 myotubes for KO control; n = 20 myotubes for acNPs‐treated KO. Data are mean ± SE; ***P < 0.001, Student's t‐test.
- C, D
KO myotubes were incubated in the presence (acNPs) or in the absence of acNPs (NT) for 18 h, exposed to UV‐light for 5 min, and incubated for an additional 1 h in differentiation medium; the cells were then starved for 2 h (HBSS), followed by fixation and immunostaining with LAMP1 (red) and mTOR (green). The degree of co‐localization of the two stains (evaluated using ImageJ software; shown in D) is reduced in acNPs‐treated cells following starvation. Scale bar: 10 μm. At least five myotubes were analyzed for each condition. Data are mean ± SE; *P < 0.05, **P < 0.01, Student's t‐test.
- E
acNPs‐treated and non‐treated KO myotubes were incubated in HBSS with dialyzed serum for 2 h, lysed and subjected to immunoblot analysis with the indicated antibodies; the degree of dephosphorylation of 4E‐BP1 is more prominent in acNPs‐treated cells. Vinculin was used as a loading control.
- F, G
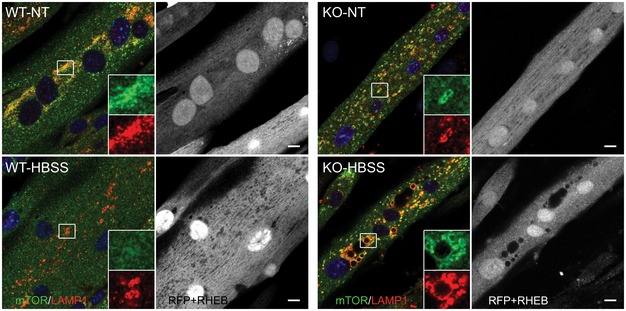
Immunoblot analysis showing the effects of TSC2 inhibition (F) and RHEB overexpression (G) on mTOR activity in KO myotubes. Increased phosphorylation of the two major downstream mTOR targets, 4E‐BP1 and S6K, is observed following the treatments. Vinculin was used as a loading control. Blots in (F) are composite images; the samples were run on the same gel.
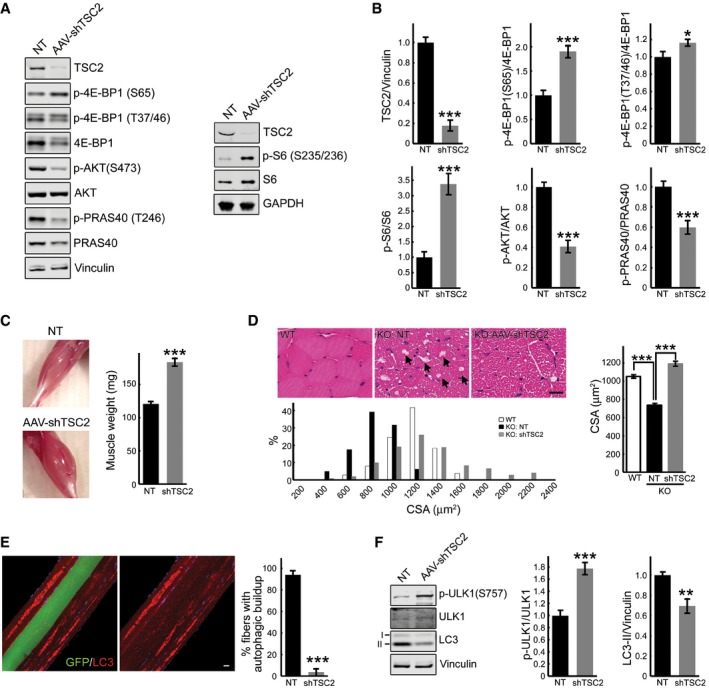
- A, B
Western blot analysis of whole muscle lysates from sham‐treated (NT) left gastrocnemius and AAV1‐shRNA‐TSC2 (AAV‐shTSC2)‐infected right gastrocnemius muscle from GAA‐KO mice (n = 7) with the indicated antibodies. Graphical presentation of the data is shown in (B). Data illustrate the mean ± SE; *P < 0.05, ***P < 0.001, Student's t‐test. All blots (except for S6; n = 3) are representative of seven independent experiments.
- C
Images show an increase in muscle mass in AAV‐shTSC2‐infected (bottom) muscle compared to sham‐treated (top) muscle. Intramuscular injections were performed in 3‐ to 4‐month‐old GAA‐KO mice; the animals were sacrificed 7–8 weeks after injections (n = 9). Data are mean ± SE; ***P < 0.001, Student's t‐test.
- D
H&E‐stained sections of WT, sham‐infected (KO: NT), and infected (KO: AAV‐shTSC2) GAA‐KO gastrocnemius muscle reveal an increase in cross‐sectional area (CSA) in the infected fibers, and a paucity of large vacuoles (arrows) typically present in the GAA‐KO muscle fibers. Scale bar: 20 μm. Histogram showing the distribution of CSAs of WT, sham‐treated, and infected GAA‐KO muscle; note that CSAs of a subset of the infected fibers (˜15%) are larger than those in the WT. n = 240 for each of the three conditions. Data are mean ± SE; ***P < 0.001, Student's t‐test.
- E
Immunostaining of isolated muscle fibers with autophagosomal marker LC3 (red); the fibers were derived from AAV1‐shTSC2‐infected gastrocnemius muscle of a GAA‐KO mouse. Of the four adjacent fibers, only one was infected (left panel; green); autophagic accumulations are seen in non‐infected, but not in the infected fiber (right panel). Note that the infected fiber is bigger in size. Scale bar: 20 μm. Data are mean ± SE; ***P < 0.001, Student's t‐test. n = 227 of non‐infected fibers; n = 139 of infected fibers.
- F
Western blot analysis of whole muscle lysates from sham‐treated (NT) left gastrocnemius and AAV‐shTSC2‐infected right gastrocnemius muscle from GAA‐KO mice (n = 7) with the indicated antibodies. An increase in p‐ULK1S757/total ratio (mTOR‐mediated phosphorylation) and a concomitant decrease in LC3‐II/vinculin ratio are seen in AAV‐shTSC2‐infected muscle. Data are mean ± SE; **P < 0.01, ***P < 0.001, Student's t‐test.
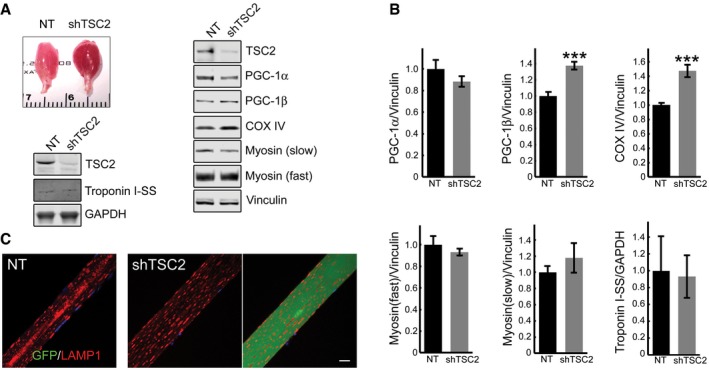
- A, B
Appearance of the infected muscle (reddish color). Immunoblot analysis of sham‐infected (NT) and infected (shTSC2) muscle with the indicated antibodies; an increase in the levels of PGC‐1β (n = 7) and COX IV (n = 7) is seen in the infected muscle. Graphical representation of the data from Western blots. Data are mean ± SE; Student's t‐test; ***P < 0.001. The difference in the levels of PGC‐1α (n = 7), myosin fast, myosin slow, and troponin (n = 4 each) between non‐infected and infected muscle is not significant.
- C
Immunostaining of sham‐infected (left panel) and infected (two right panels) fibers with LAMP1 (red); no major difference in the distribution of lysosomes is observed between the infected and sham‐infected fibers; the difference is in the absence of the autophagic area and the size of the infected fiber. Scale bar: 20 μm.
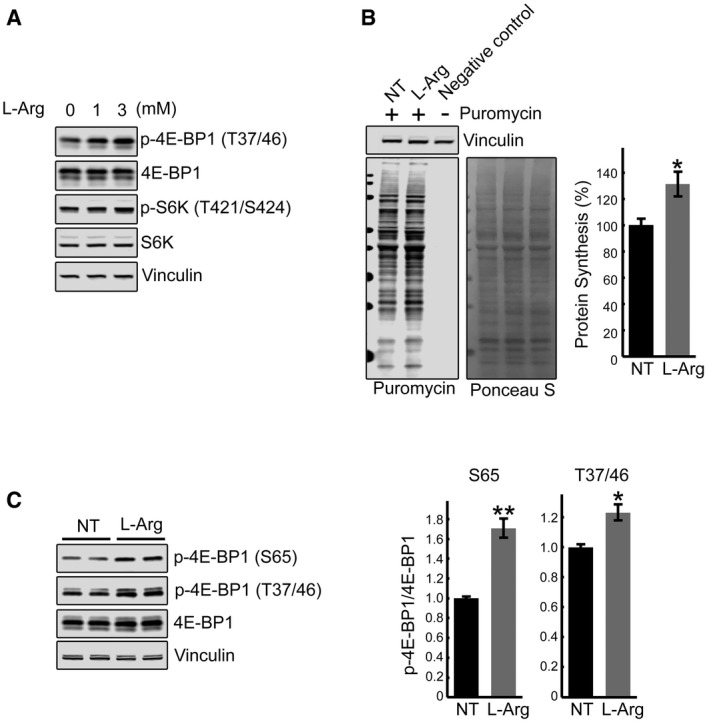
Immunoblot analysis showing the effects of arginine treatment on mTOR activity in KO myotubes. Increased phosphorylation of the two major downstream mTOR targets, 4E‐BP1 and S6K, is observed following the treatments.
SUnSET analysis was used to evaluate the incorporation of puromycin into nascent polypeptides. KO myotubes were treated with both
l ‐arginine (3 mM) and puromycin (1 μM) for 15 min. Western blot with anti‐vinculin antibody and Ponceau S staining were used as loading controls. Total intensity of puromycin‐labeled polypeptides was quantified. Data are mean ± SE of three independent experiments. *P < 0.05, Student's t‐test.GAA‐KO mice were treated with
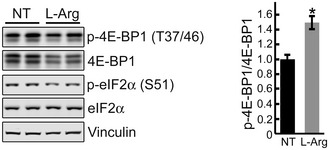
l ‐arginine (2.5% in drinking water) for 6 weeks. Western blot analysis of whole muscle lysates showing an increase in p‐4E‐BP1S65/total and p‐4E‐BP1T37/46/total ratios following dietary arginine supplementation. Graphs represent mean ± SE; *P < 0.05, **P < 0.01, Student's t‐test. n = 3 for the NT; n = 5 forl ‐Arg.
Similar articles
-
Therapeutic Benefit of Autophagy Modulation in Pompe Disease.Mol Ther. 2018 Jul 5;26(7):1783-1796. doi: 10.1016/j.ymthe.2018.04.025. Epub 2018 May 3. Mol Ther. 2018. PMID: 29804932 Free PMC article.
-
Akt inactivation induces endoplasmic reticulum stress-independent autophagy in fibroblasts from patients with Pompe disease.Mol Genet Metab. 2012 Nov;107(3):490-5. doi: 10.1016/j.ymgme.2012.09.011. Epub 2012 Sep 15. Mol Genet Metab. 2012. PMID: 23041259
-
Pompe Disease: From Basic Science to Therapy.Neurotherapeutics. 2018 Oct;15(4):928-942. doi: 10.1007/s13311-018-0655-y. Neurotherapeutics. 2018. PMID: 30117059 Free PMC article. Review.
-
Role of autophagy in the pathogenesis of Pompe disease.Acta Myol. 2007 Jul;26(1):45-8. Acta Myol. 2007. PMID: 17915569 Free PMC article. Review.
-
Activated mTOR signaling pathway in myofibers with inherited metabolic defect might be an evidence for mTOR inhibition therapies.Chin Med J (Engl). 2019 Apr 5;132(7):805-810. doi: 10.1097/CM9.0000000000000144. Chin Med J (Engl). 2019. PMID: 30897595 Free PMC article.
Cited by
-
Lysosomes Mediate Benefits of Intermittent Fasting in Cardiometabolic Disease: The Janitor Is the Undercover Boss.Compr Physiol. 2018 Sep 14;8(4):1639-1667. doi: 10.1002/cphy.c180005. Compr Physiol. 2018. PMID: 30215867 Free PMC article. Review.
-
Therapeutic Benefit of Autophagy Modulation in Pompe Disease.Mol Ther. 2018 Jul 5;26(7):1783-1796. doi: 10.1016/j.ymthe.2018.04.025. Epub 2018 May 3. Mol Ther. 2018. PMID: 29804932 Free PMC article.
-
Gut dysmotility in children with neurological impairment: the nutritional management.Front Neurol. 2023 May 5;14:1200101. doi: 10.3389/fneur.2023.1200101. eCollection 2023. Front Neurol. 2023. PMID: 37213895 Free PMC article. Review.
-
Lysosomes as dynamic regulators of cell and organismal homeostasis.Nat Rev Mol Cell Biol. 2020 Feb;21(2):101-118. doi: 10.1038/s41580-019-0185-4. Epub 2019 Nov 25. Nat Rev Mol Cell Biol. 2020. PMID: 31768005 Review.
-
Omics-Based Approaches for the Characterization of Pompe Disease Metabolic Phenotypes.Biology (Basel). 2023 Aug 23;12(9):1159. doi: 10.3390/biology12091159. Biology (Basel). 2023. PMID: 37759559 Free PMC article. Review.
References
-
- Andrzejewska Z, Nevo N, Thomas L, Chhuon C, Bailleux A, Chauvet V, Courtoy PJ, Chol M, Guerrera IC, Antignac C (2016) Cystinosin is a component of the vacuolar H+‐ATPase‐ragulator‐rag complex controlling mammalian target of rapamycin complex 1 signaling. J Am Soc Nephrol 27: 1678–1688 - PMC - PubMed
-
- de Araujo JA Jr, Falavigna G, Rogero MM, Pires IS, Pedrosa RG, Castro IA, Donato J Jr, Tirapegui J (2006) Effect of chronic supplementation with branched‐chain amino acids on the performance and hepatic and muscle glycogen content in trained rats. Life Sci 79: 1343–1348 - PubMed
-
- Ashe KM, Taylor KM, Chu Q, Meyers E, Ellis A, Jingozyan V, Klinger K, Finn PF, Cooper CG, Chuang WL et al (2010) Inhibition of glycogen biosynthesis via mTORC1 suppression as an adjunct therapy for Pompe disease. Mol Genet Metab 100: 309–315 - PubMed
-
- Averous J, Lambert‐Langlais S, Carraro V, Gourbeyre O, Parry L, B'Chir W, Muranishi Y, Jousse C, Bruhat A, Maurin AC et al (2014) Requirement for lysosomal localization of mTOR for its activation differs between leucine and other amino acids. Cell Signal 26: 1918–1927 - PubMed
MeSH terms
Substances
Grants and funding
LinkOut - more resources
Full Text Sources
Other Literature Sources
Miscellaneous
