. 2017 Apr 1;312(4):H645-H661.
doi: 10.1152/ajpheart.00564.2016. Epub 2017 Jan 27.

Silica nanoparticles induce cardiotoxicity interfering with energetic status and Ca2+ handling in adult rat cardiomyocytes

Affiliations

Silica nanoparticles induce cardiotoxicity interfering with energetic status and Ca2+ handling in adult rat cardiomyocytes

Carlos Enrique Guerrero-Beltrán et al. Am J Physiol Heart Circ Physiol. .

Abstract

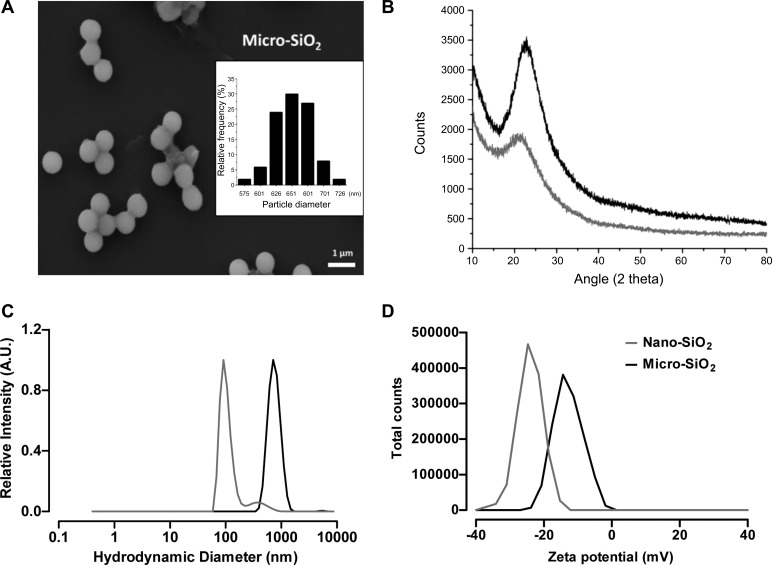
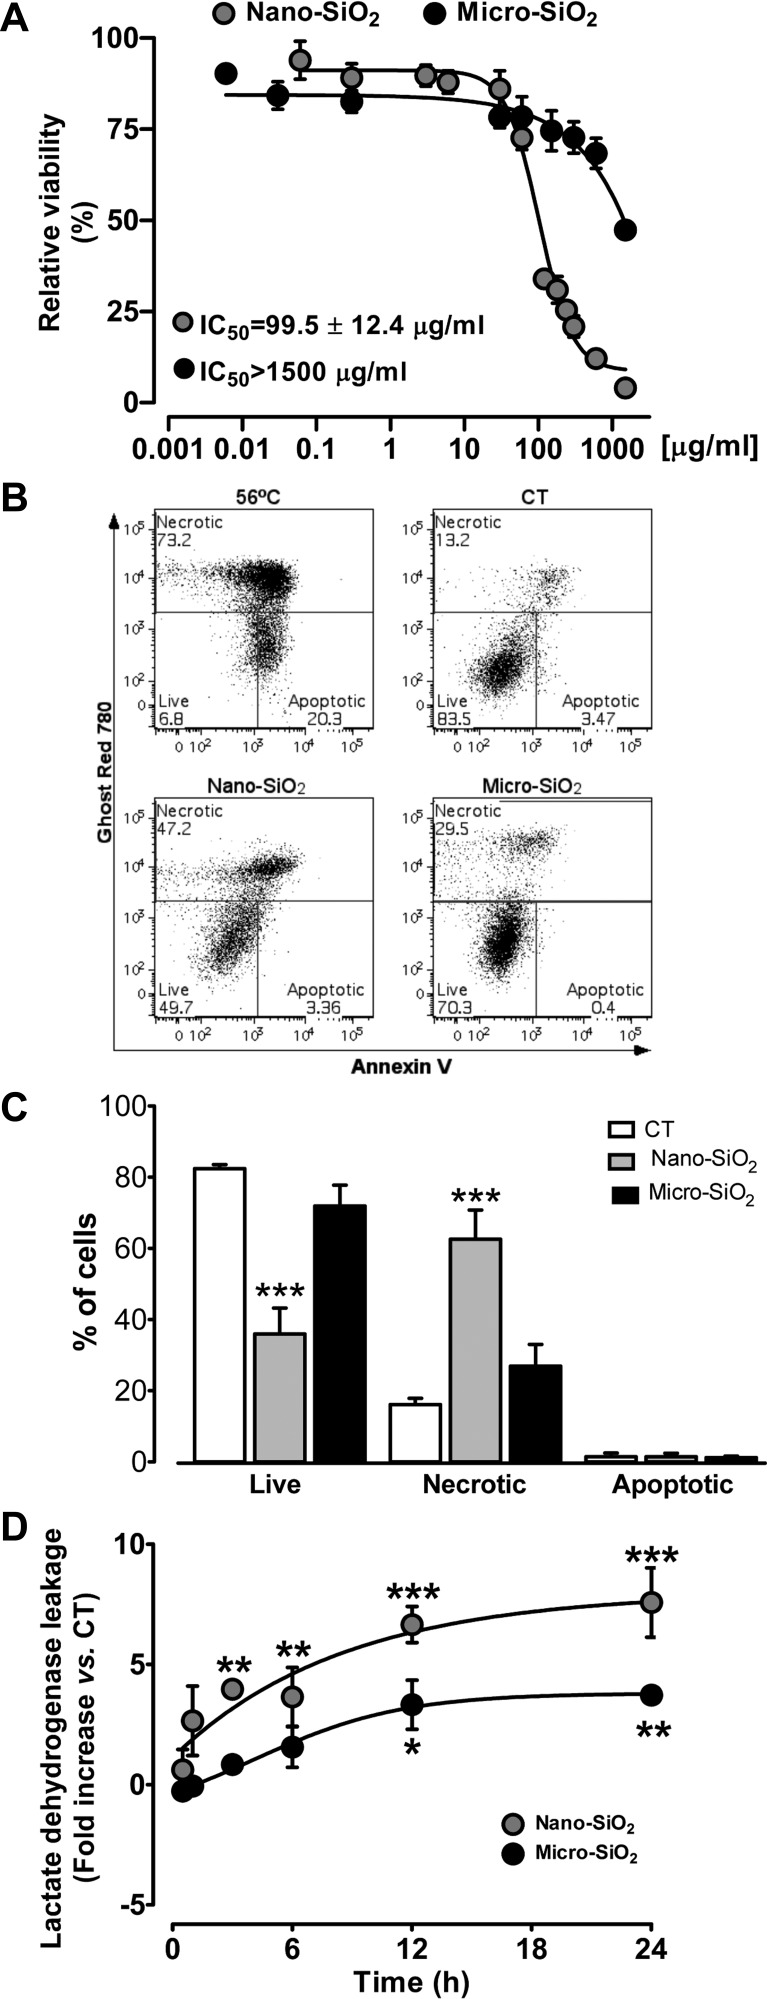
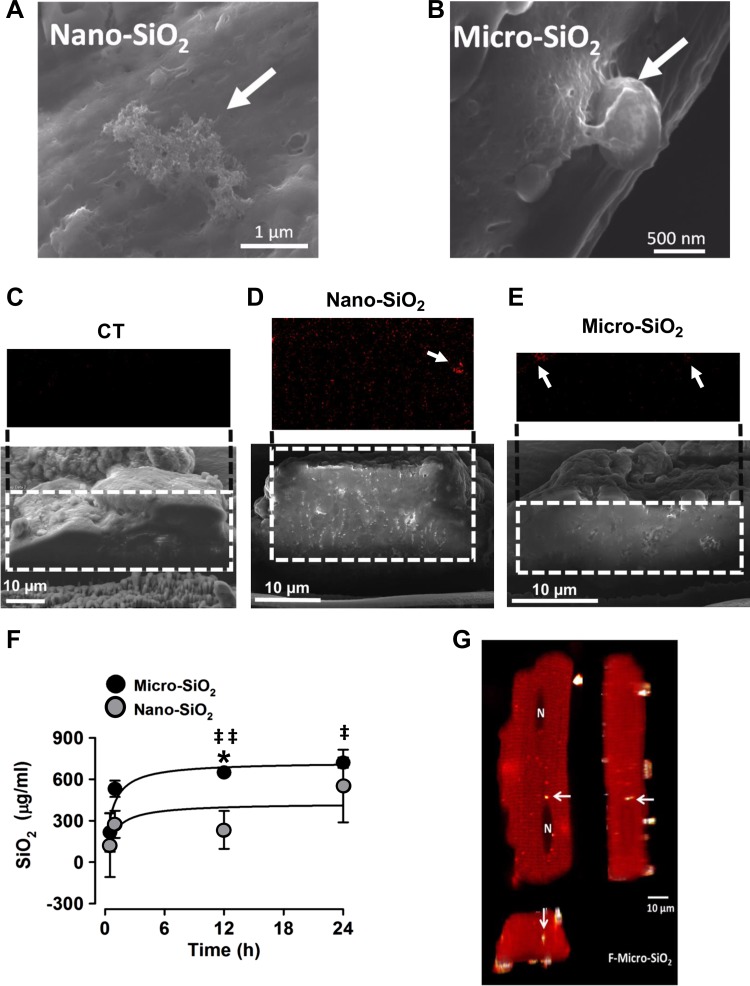
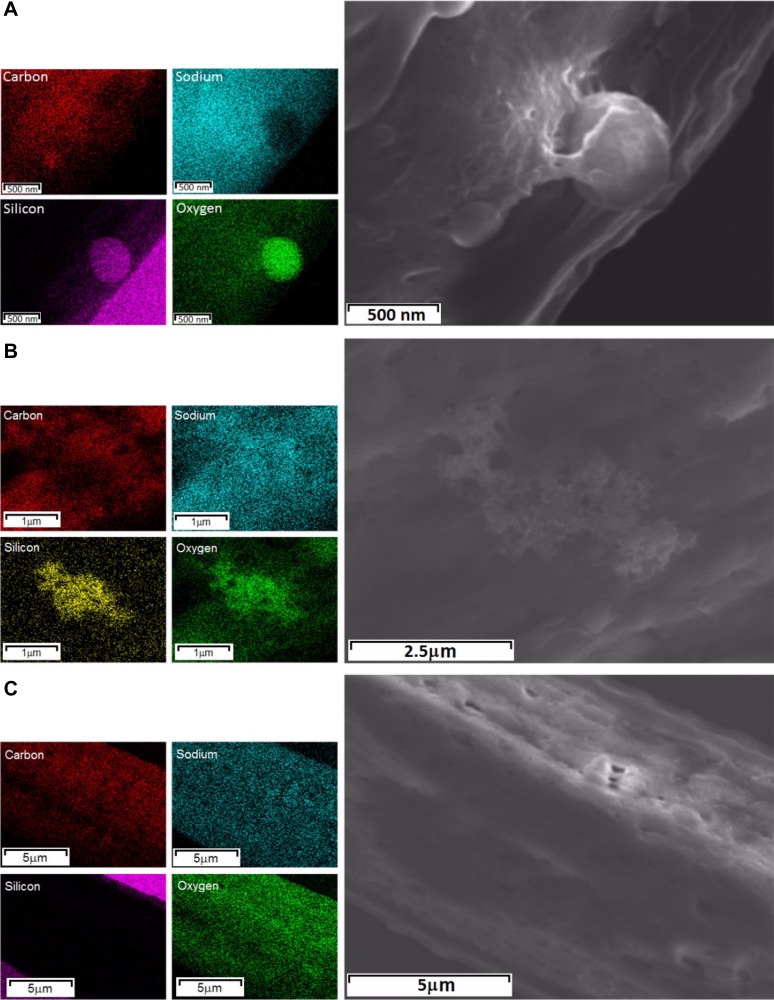
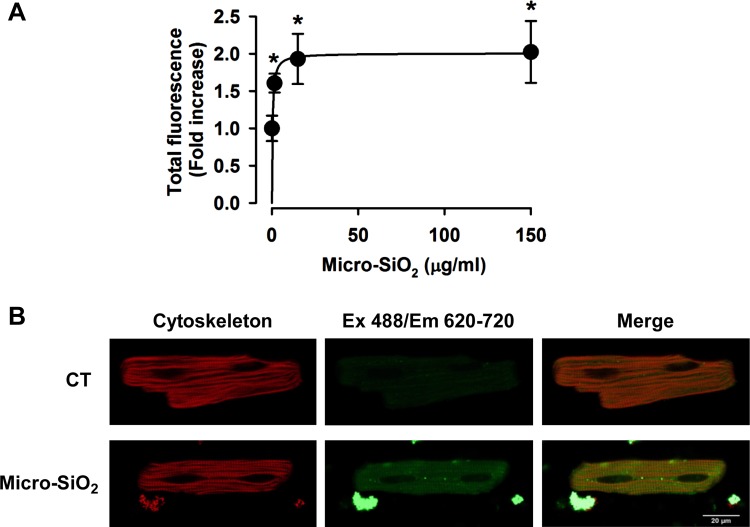
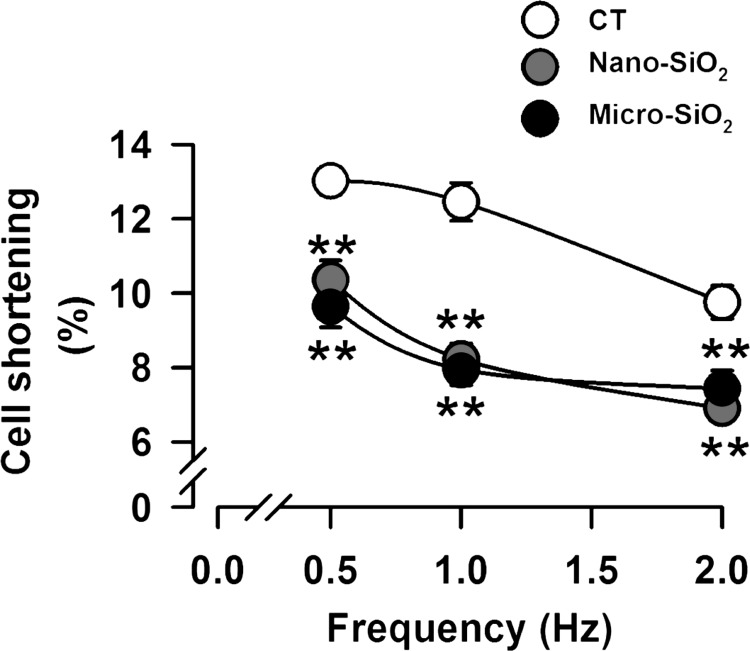
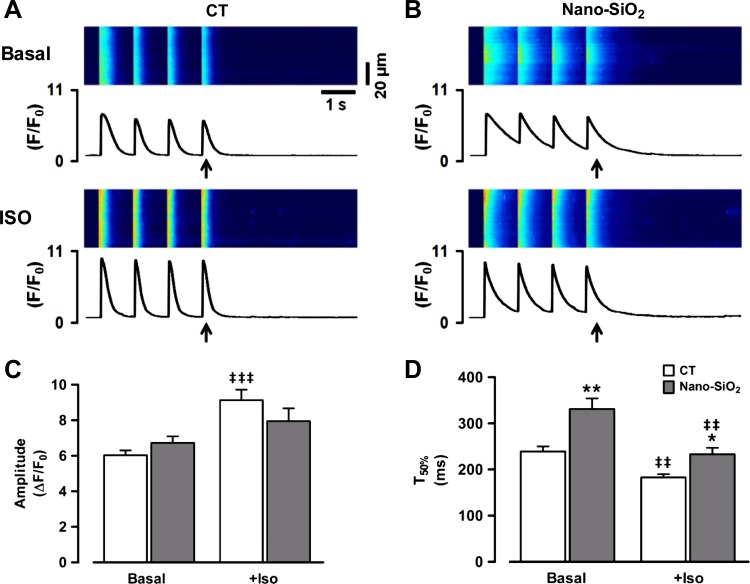
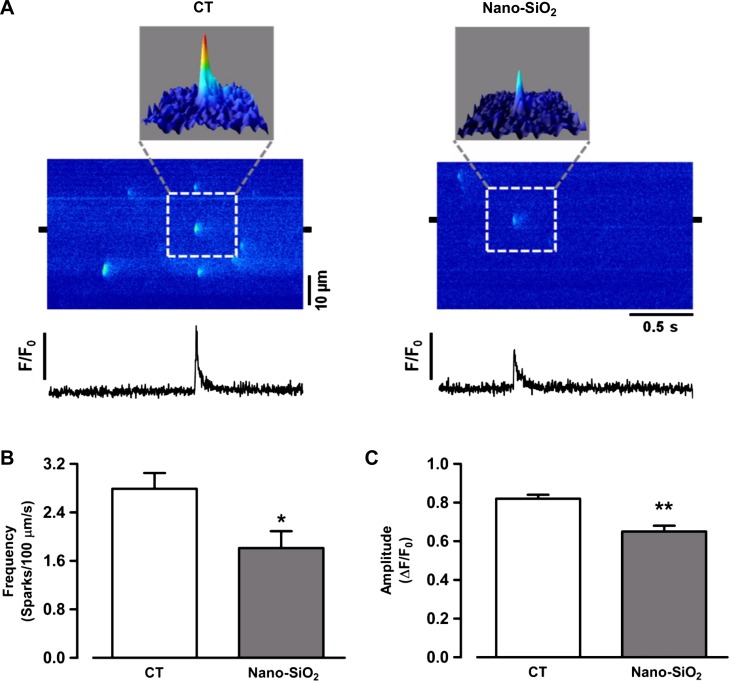
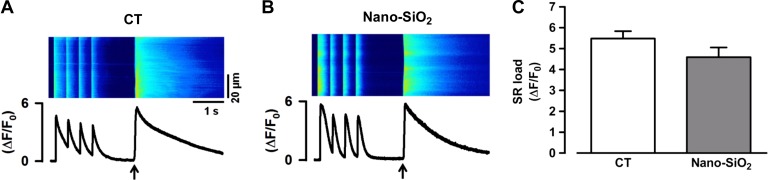
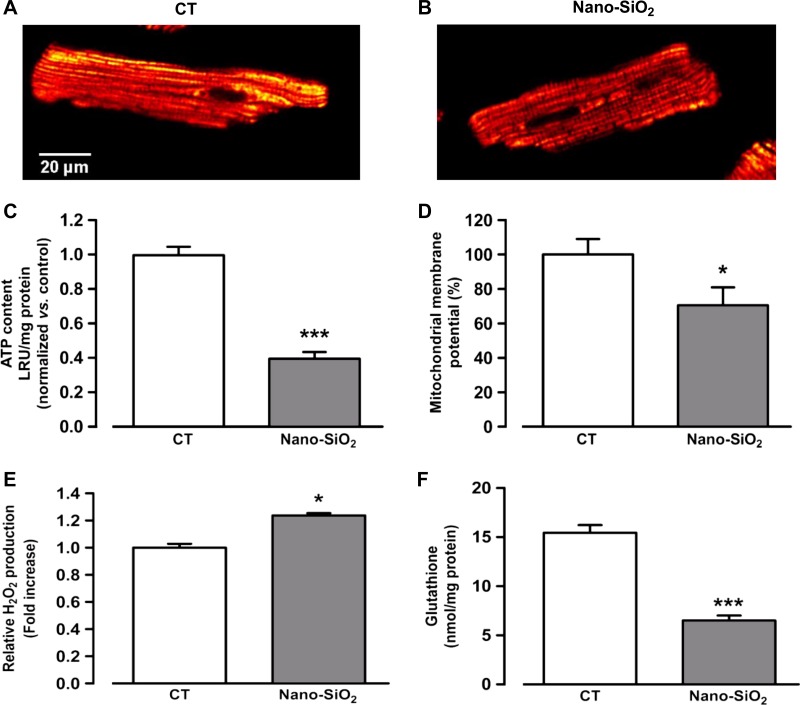
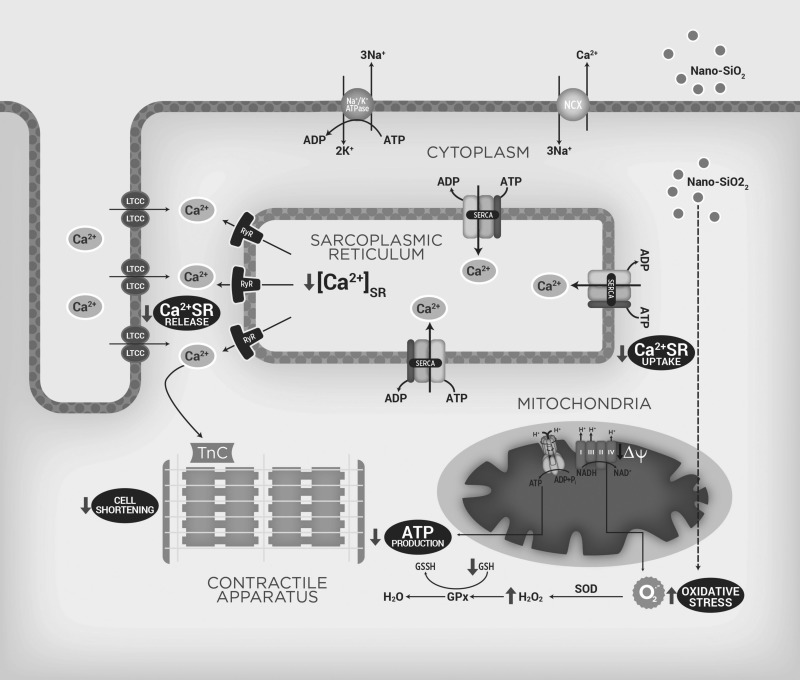
Recent evidence has shown that nanoparticles that have been used to improve or create new functional properties for common products may pose potential risks to human health. Silicon dioxide (SiO2) has emerged as a promising therapy vector for the heart. However, its potential toxicity and mechanisms of damage remain poorly understood. This study provides the first exploration of SiO2-induced toxicity in cultured cardiomyocytes exposed to 7- or 670-nm SiO2 particles. We evaluated the mechanism of cell death in isolated adult cardiomyocytes exposed to 24-h incubation. The SiO2 cell membrane association and internalization were analyzed. SiO2 showed a dose-dependent cytotoxic effect with a half-maximal inhibitory concentration for the 7 nm (99.5 ± 12.4 µg/ml) and 670 nm (>1,500 µg/ml) particles, which indicates size-dependent toxicity. We evaluated cardiomyocyte shortening and intracellular Ca2+ handling, which showed impaired contractility and intracellular Ca2+ transient amplitude during β-adrenergic stimulation in SiO2 treatment. The time to 50% Ca2+ decay increased 39%, and the Ca2+ spark frequency and amplitude decreased by 35 and 21%, respectively, which suggest a reduction in sarcoplasmic reticulum Ca2+-ATPase (SERCA) activity. Moreover, SiO2 treatment depolarized the mitochondrial membrane potential and decreased ATP production by 55%. Notable glutathione depletion and H2O2 generation were also observed. These data indicate that SiO2 increases oxidative stress, which leads to mitochondrial dysfunction and low energy status; these underlie reduced SERCA activity, shortened Ca2+ release, and reduced cell shortening. This mechanism of SiO2 cardiotoxicity potentially plays an important role in the pathophysiology mechanism of heart failure, arrhythmias, and sudden death.NEW & NOTEWORTHY Silica particles are used as novel nanotechnology-based vehicles for diagnostics and therapeutics for the heart. However, their potential hazardous effects remain unknown. Here, the cardiotoxicity of silica nanoparticles in rat myocytes has been described for the first time, showing an impairment of mitochondrial function that interfered directly with Ca2+ handling.

Keywords: Ca2+; cardiomyocyte; nanoparticle; silicon dioxide; toxicity.


Figures

Fig. 1.
Fig. 1.
Characterization of silica particles by scanning electron microscope (SEM), X-ray diffraction (XRD), dynamic light scattering (DLS), and ζ-potential. A: representative micro-SiO2 micrograph showing size and morphology. Insert shows size distribution of micro-SiO2 obtained by field emission gun (FEG)-SEM (n = 100 particles). B: XRD analysis with the composition of the talline domains of nano- and micro-SiO2. All samples show the characteristic diffraction pattern of amorphous silica presenting a broad peak (10–30°) with a maximum around 22°. C: the hydrodynamic sizes of nano- and micro-SiO2 particles in ultrapure water. D: the ζ-potentials of nano- and micro-SiO2 particles in ultrapure water. Black and gray curves correspond to micro-SiO2 and nano-SiO2, respectively, in each graphic.
Fig. 2.
Fig. 2.
Viability of adult cardiomyocytes after 24-h exposure of SiO2 particles and mechanism of cell death. A: nano-SiO2 and micro-SiO2 viability evaluated by Alamar blue viability test. B: representative dot plots from flow cytometry with AnnexinV-PE-Cy7/Ghost Red 780 cell death analysis. A positive control of apoptosis cell death (56°C for 10 min) is shown in comparison to control (CT), nano-SiO2, and micro-SiO2 treated groups at 99.5 µg/ml. C: the percentage of necrotic, live, and apoptotic cells was quantified and is shown in the bar graph. D: time-dependent cytotoxicity by lactate dehydrogenase leakage at 0–24 h, in cultured cardiomyocytes with 24-h incubation of nano-SiO2 and micro-SiO2 at its half-maximal inhibitory concentration (IC50) (99.5 µg/ml for nano-SiO2 and 1,500 µg/ml for micro-SiO2 particles). Values are means ± SE, n = 3–10; *P < 0.05; **P < 0.01; ***P < 0.001 vs. control.
Fig. 3.
Fig. 3.
SiO2 cellular association and internalization in adult rat cardiomyocytes. Representative SEM micrographs showing nano-SiO2 (A) and micro-SiO2 (B) individual and agglomerates/aggregates association to the cellular membrane. Representative SEM–energy-dispersive X-ray spectroscopy (EDS) transversal cut images of untreated (C), Nano-SiO2 (D), and Micro-SiO2 (E) particle internalization after 24 h of incubation (99.5 μg/ml). F: quantification of internalized SiO2 particles by particle-induced X-ray emission, as a function of time (for nano-SiO2 99.5 μg/ml and micro-SiO2 1,500 μg/ml). G: representative confocal microscopy image of the F-micro-SiO2 shown as x, y and z-stacks. The cytoskeleton is shown in red and the brighter dots correspond to F-micro-SiO2 particles. The arrows indicate the SiO2 particles in the cell. The symbol N (in G) marks the nucleus location in the cell. Values are means ± SD; a t-test was used as statistical analysis between nano- and micro-SiO2. Values are means ± SE, n = 3–5. *P < 0.05 vs. nano; ‡P < 0.05 vs. basal (time 0).
Fig. 4.
Fig. 4.
Cardiomyocytes surface showing silica particles by energy-dispersive X-ray spectroscopy (EDS). Right: FEG-SEM images of micro-SiO2 (A) and nano-SiO2 (B) individual and agglomerates/aggregates association to the cellular membrane and an adult rat cardiomyocyte as a control sample (C). Left: the respective four EDS images of elemental maps for carbon (red), sodium (cyan), silicon (magenta/yellow), and oxygen (green).
Fig. 5.
Fig. 5.
Micro-SiO2 internalization in adult myocytes. A: semiquantitative increase in fluorescence in a dose-dependent manner of F-micro-SiO2 particles. B: representative images from ventricular myocytes at the control (CT) condition and 150 µg/ml F-micro-SiO2 concentration. The cytoskeleton is shown in red and F-micro-SiO2 in green. Values are means ± SE, n = 4–6. *P < 0.05 vs. CT.
Fig. 6.
Fig. 6.
Cell shortening and Ca2+ handling in cardiomyocytes treated with nano- and micro-SiO2 particles. The percentage of cell shortening before (CT) and after a 24-h treatment of nano-SiO2 and micro-SiO2 at its IC50. Values are means ± SE, n = 15. **P < 0.001 vs. CT.
Fig. 7.
Fig. 7.
Calcium transient characterization at basal condition and after β-adrenergic stimulation. A and B: representative images from field-stimulated control and nano-SiO2-treated myocytes under basal conditions and after isoproterenol (ISO) perfusion, the arrow indicates the analyzed transient for semiquantitative results. C: peak Ca2+ transient amplitude. D: time to 50% of decay (T50%). Values are means ± SE. CT: n = 22–33 cells/3 animals; nano-SiO2: n = 19–34 cells/3 animals. *P < 0.05 vs. CT; **P < 0.001 vs. CT; ‡‡P < 0.001 vs. basal; ‡‡‡P < 0.0001 vs. basal.
Fig. 8.
Fig. 8.
Calcium sparks characterization in isolated myocytes. A: line scan images from control conditions (left) and after 24-h incubation with Nano-SiO2 (right). Surface plots can be seen above line scan images. Line profiles from selected 2-µm regions (black marks in line scan images) can be seen on images. Pooled data describing spark frequency (B) and amplitude (C). Values are means ± SE, n = 39 cells/3 animals/CT; 33 cells/3 animals/nano-SiO2). *P < 0.05 vs. CT; **P < 0.001 vs. CT.
Fig. 9.
Fig. 9.
Calcium content in the sarcoplasmic reticulum. Representative images from caffeine-induced Ca2+ transients from control (CT) (A) and nano-SiO2-treated cardiomyocytes (B). Black arrow indicates caffeine application (10 mM). C: pooled data for peak Ca2+ transient amplitude [sarcoplasmic reticulum (SR) load; n = 25 cells/3 animals/CT; 24 cells/3 animals/Nano-SiO2].
Fig. 10.
Fig. 10.
Mitochondrial membrane potential, ATP content, reactive oxygen species (ROS) production, and glutathione depletion. Representative images from control (CT) (A) and nano-SiO2-treated cardiomyocytes (B) loaded with TMRE by confocal microscopy. ATP content (luminescence relative units, LRU) (C) and relative fluorescence from mitochondrial membrane potential (%) (D) from CT and nano-SiO2-treated cardiomyocytes. H2O2 production (E) and glutathione content (F) in cultured cardiomyocytes with 24-h incubation of nano-SiO2 at its IC50. Values are means ± SE, n = 10–11 cells (aD); n = 3 (E and F); *P < 0.05 vs. CT; ***P < 0.0001 vs. CT.
Fig. 11.
Fig. 11.
Proposed mechanism of SiO2-induced cardiotoxicity. Scheme of the suggested mechanism by which nano-SiO2 particles induces cardiotoxicity interfering with energetic status and Ca2+ handling in cardiomyocytes. GSH/GSSG, reduced/oxidized glutathione; NCLX, Na+/Ca2+ exchanger; O2·−, superoxide radical; LTCC, L-type calcium channels; SR, sarcoplasmic reticulum; RyR2, ryanodine receptors; TnC, troponin C.

References

    1. Al-Rasheed NM, Faddah LM, Mohamed AM, Abdel Baky NA, Al-Rasheed NM, Mohammad RA. Potential impact of quercetin and idebenone against immuno-inflammatory and oxidative renal damage induced in rats by titanium dioxide nanoparticles toxicity. J Oleo Sci 62: 961–971, 2013. doi: 10.5650/jos.62.961. - DOI - PubMed
    1. Arvizo RR, Miranda OR, Moyano DF, Walden CA, Giri K, Bhattacharya R, Robertson JD, Rotello VM, Reid JM, Mukherjee P. Modulating pharmacokinetics, tumor uptake and biodistribution by engineered nanoparticles. PLoS One 6: e24374, 2011. doi: 10.1371/journal.pone.0024374. - DOI - PMC - PubMed
    1. Balderas-Villalobos J, Molina-Muñoz T, Mailloux-Salinas P, Bravo G, Carvajal K, Gómez-Viquez NL. Oxidative stress in cardiomyocytes contributes to decreased SERCA2a activity in rats with metabolic syndrome. Am J Physiol Heart Circ Physiol 305: H1344–H1353, 2013. doi: 10.1152/ajpheart.00211.2013. - DOI - PubMed
    1. Bers DM. Cardiac excitation-contraction coupling. Nature 415: 198–205, 2002. doi: 10.1038/415198a. - DOI - PubMed
    1. Blanco E, Hsiao A, Ruiz-Esparza GU, Landry MG, Meric-Bernstam F, Ferrari M. Molecular-targeted nanotherapies in cancer: enabling treatment specificity. Mol Oncol 5: 492–503, 2011. doi: 10.1016/j.molonc.2011.10.005. - DOI - PMC - PubMed

MeSH terms

LinkOut - more resources