. 2017 Mar 10;292(10):4034-4043.
doi: 10.1074/jbc.M116.772152. Epub 2017 Jan 27.

Coupling of Insulin Secretion and Display of a Granule-resident Zinc Transporter ZnT8 on the Surface of Pancreatic Beta Cells

Affiliations

Coupling of Insulin Secretion and Display of a Granule-resident Zinc Transporter ZnT8 on the Surface of Pancreatic Beta Cells

Qiong Huang et al. J Biol Chem. .

Abstract

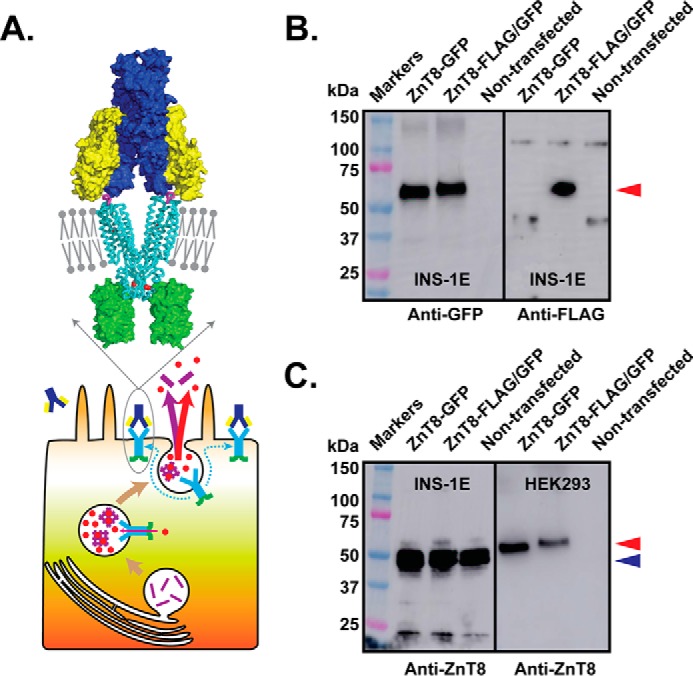
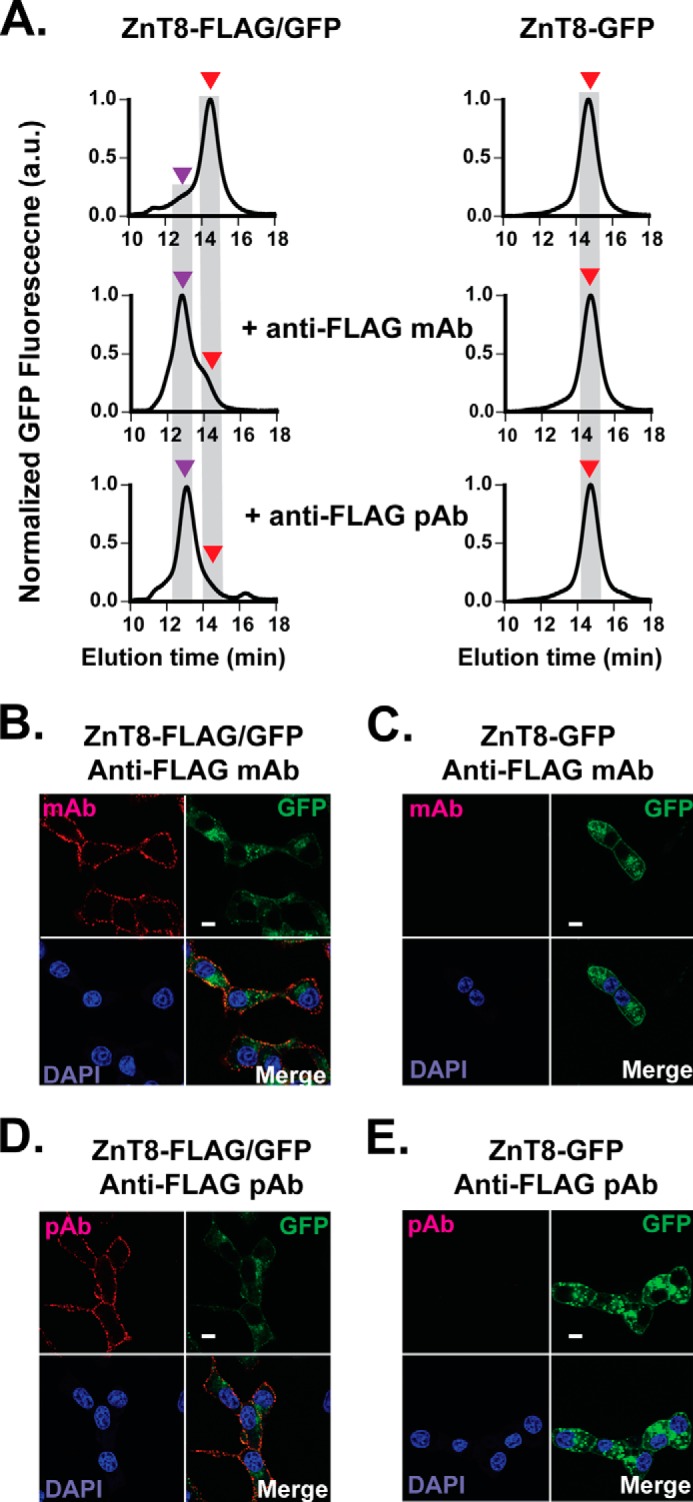
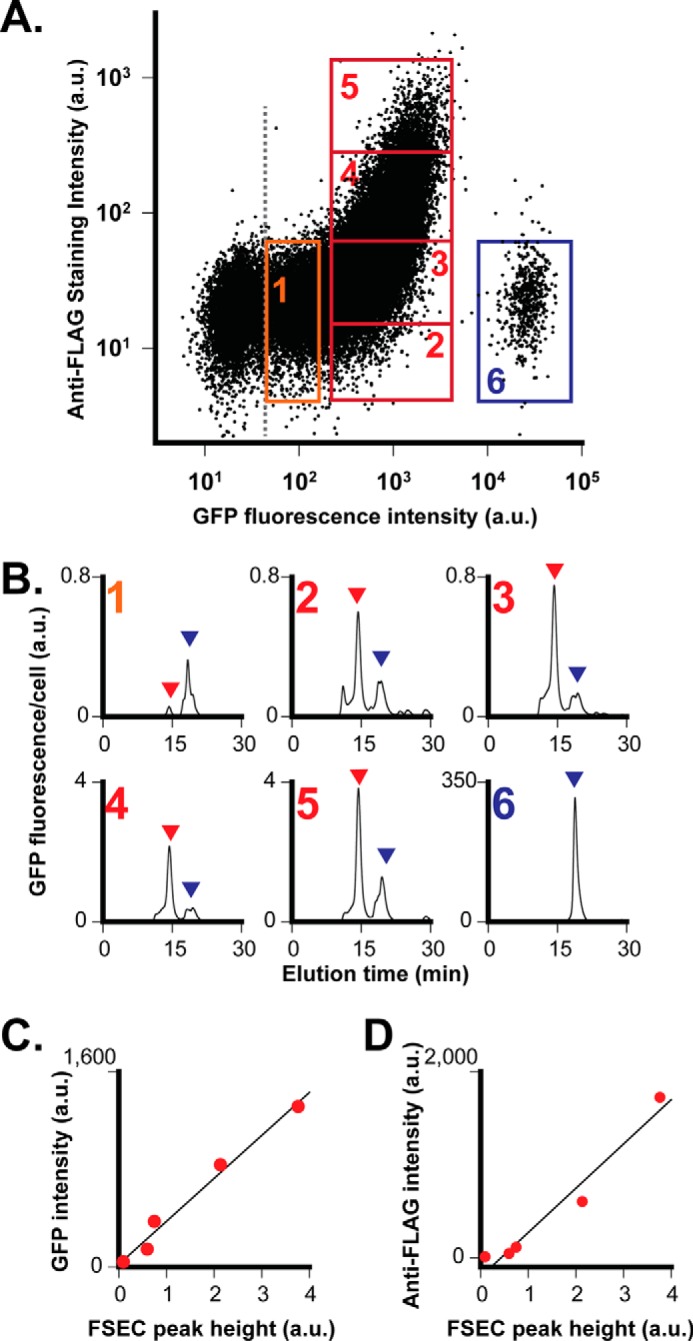
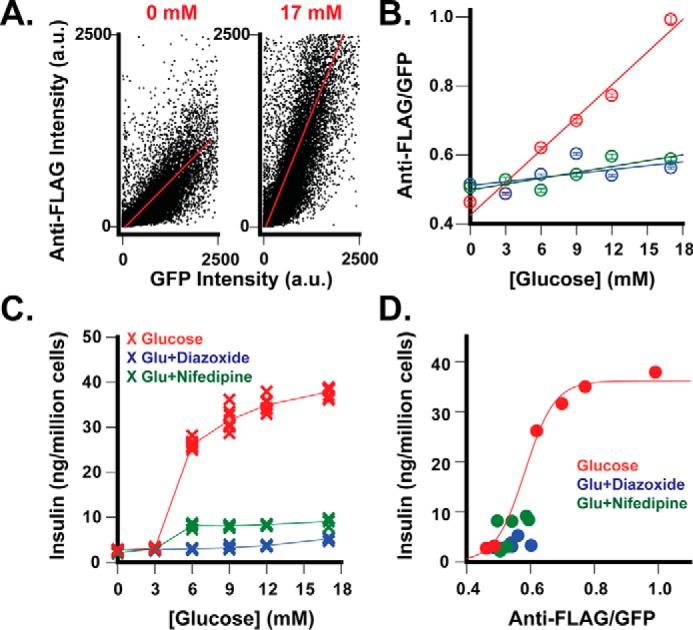
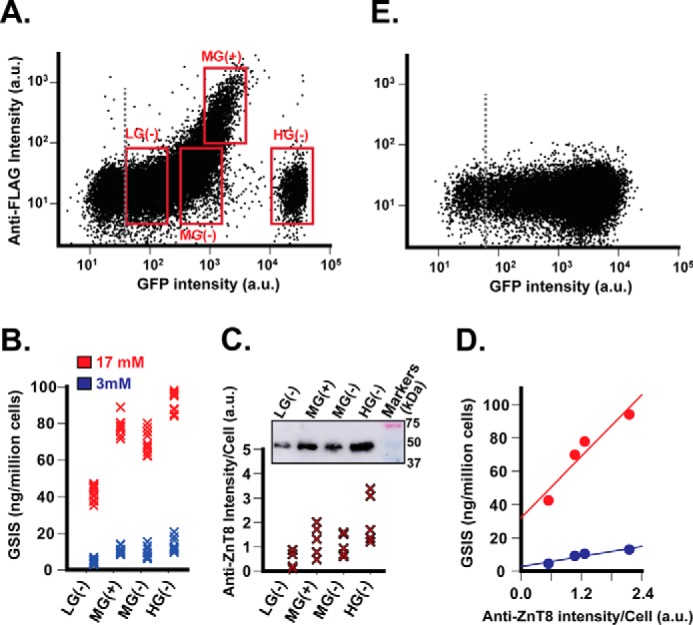
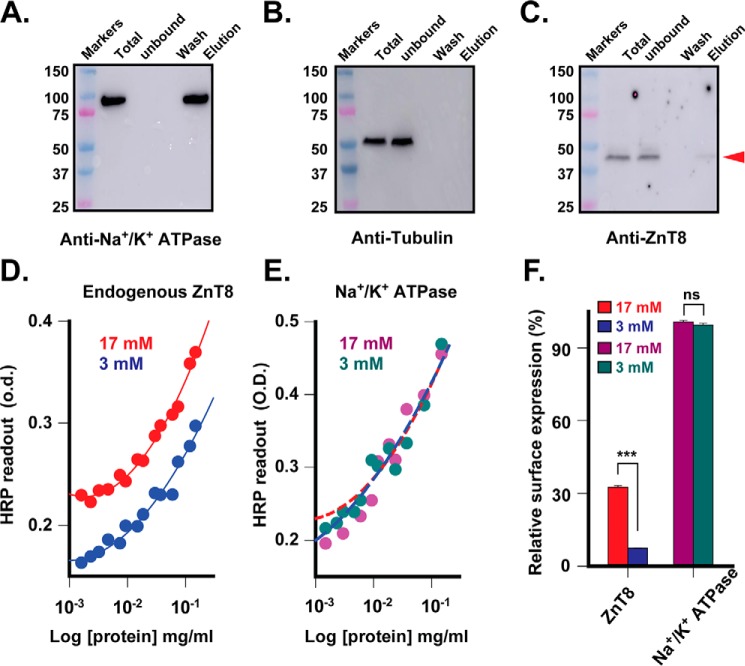
The islet-specific zinc transporter ZnT8 mediates zinc enrichment in the insulin secretory granules of the pancreatic beta cell. This granular zinc transporter is also a major self-antigen found in type 1 diabetes patients. It is not clear whether ZnT8 can be displayed on the cell surface and how insulin secretion may regulate the level of ZnT8 exposure to extracellular immune surveillance. Here we report specific antibody binding to the extracellular surface of rat insulinoma INS-1E cells that stably expressed a tagged human zinc transporter ZnT8. Flow cytometry analysis after fluorescent antibody labeling revealed strong correlations among the levels of ZnT8 expression, its display on the cell surface, and glucose-stimulated insulin secretion (GSIS). Glucose stimulation increased the surface display of endogenous ZnT8 from a basal level to 32.5% of the housekeeping Na+/K+ ATPase on the cell surface, thereby providing direct evidence for a GSIS-dependent surface exposure of the ZnT8 self-antigen. Moreover, the variation in tagged-ZnT8 expression and surface labeling enabled sorting of heterogeneous beta cells to subpopulations that exhibited marked differences in GSIS with parallel changes in endogenous ZnT8 expression. The abundant surface display of endogenous ZnT8 and its coupling to GSIS demonstrated the potential of ZnT8 as a surface biomarker for tracking and isolating functional beta cells in mixed cell populations.

Keywords: antigen; autoimmunity; biomarker; cell sorting; cell surface protein; insulin secretion; pancreatic islet; transporter; type 1 diabetes; zinc.


Conflict of interest statement

The authors declare that they have no conflicts of interest with the contents of this article

Figures

FIGURE 1.
FIGURE 1.
Stable expression of tagged-ZnT8. A, schematic diagram of the ZnT8 surface display after exocytosis of insulin secretory granules of a pancreatic beta cell with an enlarged view of a structural model of a ZnT8 homodimer (cyan ribbon) in the plasma membrane (gray bars and balls) in complex with a immunoglobin composed of two identical light chains (yellow) and heavy chains (blue) in surface representation. A pair of FLAG tags (magenta sticks) on the extracellular surface of ZnT8 mediates antibody binding. Red spheres are zinc ions, and green surfaces represent GFP tags. Cyan arrows in the beta cell indicate lateral diffusion of ZnT8 from the insulin granule to the surface membrane, red arrows indicate zinc transport or secretion, the magenta arrow indicates insulin secretion, and magenta bars indicate insulin molecules. B, anti-GFP and anti-FLAG Western blotting analysis of stably transfected INS-1E cells expressing ZnT8-GFP or ZnT8-FLAG/GFP and non-transfected INS-1E cells as indicated. A red arrow indicates positions of tagged ZnT8 between the 50–75-kDa markers. C, anti-ZnT8 Western blotting analysis of INS-1E (left panel) and HEK293 cells (right panel). Each panel consists of three lanes corresponding to stably transfected cells expressing ZnT8-GFP or ZnT8-FLAG/GFP and a non-transfected negative control as indicated. A blue arrow indicates the position of endogenous ZnT8 below the 50-kDa marker. A small protein band shift is noted between ZnT8-GFP and ZnT8-FLAG/GFP due to the FLAG-tag insertion.
FIGURE 2.
FIGURE 2.
Stable ZnT8-antibody complex and specific cell surface antibody labeling. A, GFP-FSEC profiles of ZnT8-FLAG/GFP (left panel) and ZnT8-GFP (right panel) before and after the addition of anti-FLAG mAb or anti-FLAG pAb as labeled. Red and purple arrows indicate the peak positions of unbound ZnT8-FLAG/GFP and ZnT8-FLAG/GFP-antibody complex, respectively. B–E, representative immunofluorescence confocal images of stably transfected INS-1E cells expressing ZnT8-FLAG/GFP (B and D) or ZnT8-GFP (C and E). Red, cell surface staining by anti-FLAG mAb or anti-FLAG pAb. Green, GFP fluorescence. Blue, DAPI staining. Red-green-blue or green-blue, image merge. Scale bar, 15 μm. a.u., arbitrary units.
FIGURE 3.
FIGURE 3.
Flow cytometry and FSEC analysis of stably transfected INS-1E cells. A, bivariate flow cytometric analysis of cellular GFP intensity versus cell surface anti-FLAG staining intensity in a dot-plot format. Live stably transfected INS-1E cells expressing ZnT8-FLAG/GFP were labeled with anti-FLAG pAb and then gated for sorting into six subpopulations using window settings as numbered. An additional GFP gate (gray dash line) was applied to exclude GFP-negative cells. B, FSEC analysis of sorted populations as numbered in A. Red and blue arrows indicate ZnT8-FLAG/GFP and GFP peaks, respectively. The GFP fluorescence was normalized to the number of cells in each gated population. C, linear correlation between the peak height of ZnT8-FLAG/GFP from B and mean GFP intensity within the corresponding gate from A. The solid line represents a linear regression of five data points (r = 0.98). D, linear correlation between the peak height of ZnT8-FLAG/GFP from B and mean anti-FLAG staining intensity from A. The solid line represents a linear regression of five data points (r = 0.96). a.u., arbitrary units.
FIGURE 4.
FIGURE 4.
GSIS-dependent ZnT8-FLAG/GFP surface display. A, representative data of flow cytometric analysis of mid-GFP cells corresponding to gated populations 2–5 in Fig. 3A. The dot-plot shows an overall quasilinear relationship between cellular GFP intensity and cell surface anti-FLAG staining at 0 or 17 mm glucose as indicated. The solid red lines represent linear regressions of all counting events in dot-plots (r = 0.63–0.75). B, glucose-stimulated surface display of ZnT8-FLAG/GFP. The anti-FLAG/GFP ratio is plotted as a function of the glucose concentration. Red, glucose alone; blue, glucose plus 200 μm diazoxide; green, glucose plus 20 μm nifedipine. Data are the means ± S.E. from linear regression of over 10,000 counting events from 1 representative dataset of 4–8 independent experiments. Solid lines represent linear regression of the data points (r = 0.98). C, glucose-stimulated insulin secretion. Insulin secretion from replicated cells used for flow cytometric analysis was measured in the absence (red) or presence of diazoxide (blue) or nifedipine (green) and plotted as a function of the glucose concentration. Data were merged from 4–8 independent experiments. D, correlation between ZnT8-FLAG/GFP surface display and GSIS. The solid line represents a sigmoidal fit using corresponding data points in B and C as x- and y-variable, respectively (r = 0.99). a.u., arbitrary units.
FIGURE 5.
FIGURE 5.
Sorting insulin hypersecreting cells. A, flow cytometric gates for cell fractionation. Stably transfected INS-1E cells expressing ZnT8-FLAG/GFP were gated with four window settings as marked in the dot-plot and sorted into low (LG(−)), middle (MG(+)), MG(−), and high (HG(−)) fractions as indicated. B, insulin secretion of the sorted cell populations in response to glucose stimulation at 3 (blue) or 17 mm (red). C, endogenous ZnT8 expression in the corresponding sorted cell populations. The cellular ZnT8 level was estimated by anti-ZnT8 immunoblotting normalized to the cell count. Data were merged from five independent experiments. D, correlation between endogenous ZnT8 expression and GSIS phenotype. Solid lines represent linear regressions of corresponding data points from C and B as x and y variables, respectively. E, dot-plot of stably transfected INS-1E cells expressing ZnT8-GFP with anti-FLAG labeling. a.u., arbitrary units.
FIGURE 6.
FIGURE 6.
GSIS-dependent surface display of endogenous ZnT8. A–C, anti-Na+/K+ ATPase, anti-tubulin, and anti-ZnT8 Western blotting analysis of surface biotinylation of live INS-1E cells. Biotinylated proteins were captured by streptavidin-coated magnetic beads, washed, and then eluted for immunoblotting analysis using a respective primary antibody as indicated. The red arrow indicates endogenous ZnT8. D, ELISA readouts of surface displayed ZnT8 on INS-1E cells that were exposed to 3 (blue) or 17 mm (red) glucose. Solid lines are standard curves generated by least squares fits of serial dilution data points to a second order logarithmic equation. E, quantification of surface-displayed ZnT8. Anti-Na+/K+ ATPase ELISA readouts are shown for serial dilutions of the identical cell lysate used in D. Magenta or dark cyan circles are anti-Na+/K+ ATPase readouts measured with 17 or 3 mm glucose. Dashed lines are least square fits of anti-ZnT8 standard curves in D to the anti-Na+/K+ ATPase data points using the -fold difference between biotinylated ZnT8 and Na+/K+ ATPase as a fitting parameter. Red or blue dash lines show the fit of 17 or 3 mm glucose data points. F, glucose-stimulated ZnT8 surface display. The values of relative surface expression were obtained from E in reference to the average level of the housekeeping Na+/K+ ATPase. Bars are the means ± S.E. from least-squares fitting (ns, p > 0.1; ***, p < 0.001).

References

    1. Rorsman P., Eliasson L., Renström E., Gromada J., Barg S., and Göpel S. (2000) The cell physiology of biphasic insulin secretion. News Physiol. Sci. 15, 72–77 - PubMed
    1. Eizirik D. L., Colli M. L., and Ortis F. (2009) The role of inflammation in insulitis and beta cell loss in type 1 diabetes. Nat. Rev. Endocrinol. 5, 219–226 - PubMed
    1. Dunn M. F. (2005) Zinc-ligand interactions modulate assembly and stability of the insulin hexamer: a review. Biometals 18, 295–303 - PubMed
    1. Dodson G., and Steiner D. (1998) The role of assembly in insulin's biosynthesis. Curr. Opin. Struct. Biol. 8, 189–194 - PubMed
    1. Fu Y., Tian W., Pratt E. B., Dirling L. B., Shyng S. L., Meshul C. K., and Cohen D. M. (2009) Down-regulation of ZnT8 expression in INS-1 rat pancreatic beta cells reduces insulin content and glucose-inducible insulin secretion. PLoS ONE 4, e5679. - PMC - PubMed

MeSH terms