. 2017 Mar 1;198(5):2133-2146.
doi: 10.4049/jimmunol.1601293. Epub 2017 Jan 27.

Myeloid ATG16L1 Facilitates Host-Bacteria Interactions in Maintaining Intestinal Homeostasis

Affiliations

Myeloid ATG16L1 Facilitates Host-Bacteria Interactions in Maintaining Intestinal Homeostasis

Hong Zhang et al. J Immunol. .

Abstract

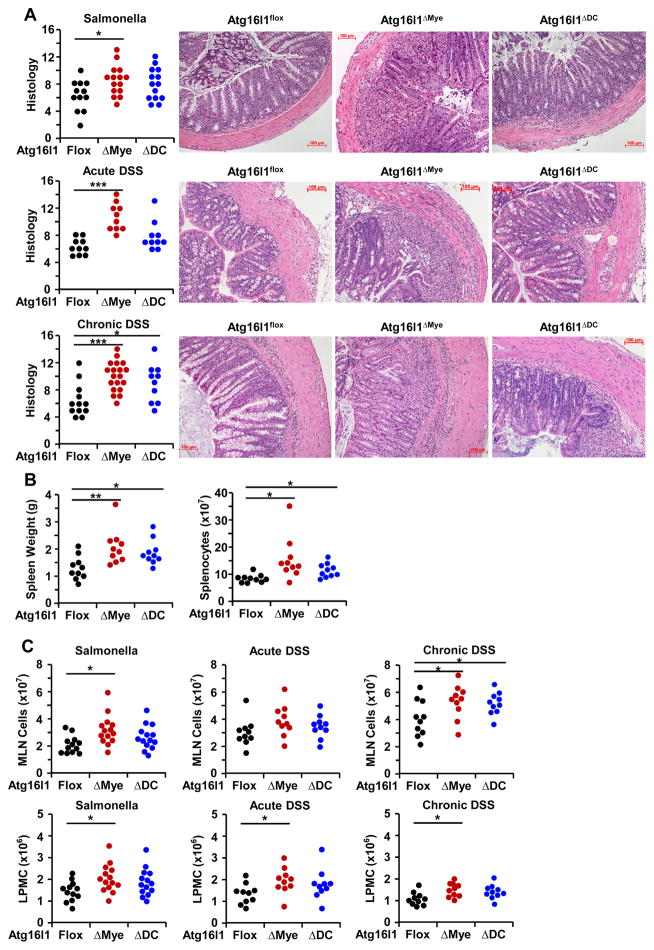
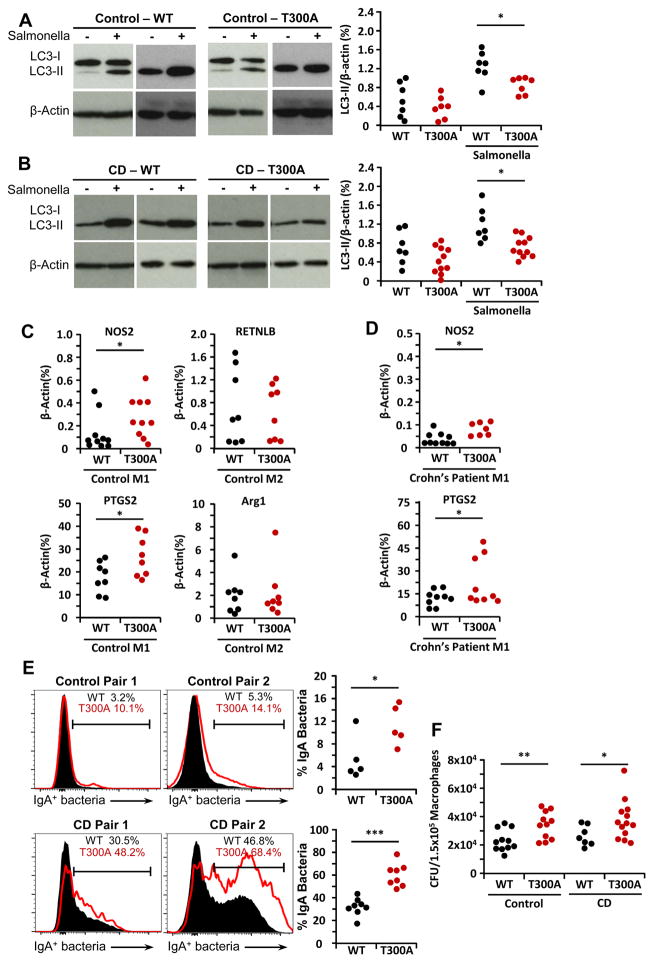
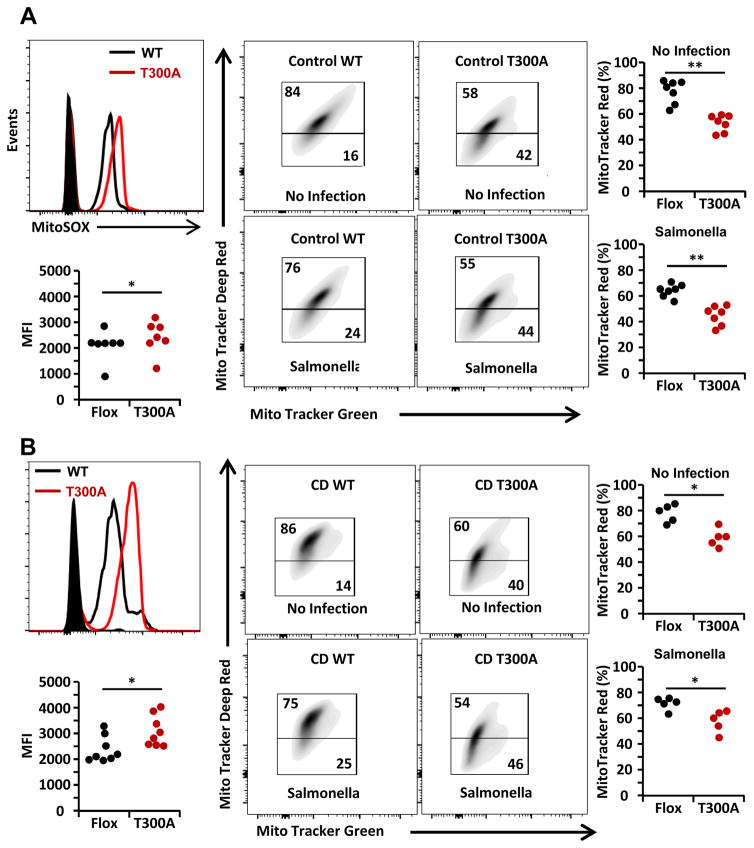
Intact ATG16L1 plays an essential role in Paneth cell function and intestinal homeostasis. However, the functional consequences of ATG16L1 deficiency in myeloid cells, particularly macrophages, are not fully characterized. We generated mice with Atg16l1 deficiency in myeloid and dendritic cells and showed that mice with myeloid Atg16l1 deficiency had exacerbated colitis in two acute and one chronic model of colitis with increased proinflammatory to anti-inflammatory macrophage ratios, production of proinflammatory cytokines, and numbers of IgA-coated intestinal microbes. Mechanistic analyses using primary murine macrophages showed that Atg16l1 deficiency led to increased reactive oxygen species production, impaired mitophagy, reduced microbial killing, impaired processing of MHC class II Ags, and altered intracellular trafficking to the lysosomal compartments. Increased production of reactive oxygen species and reduced microbial killing may be general features of the myeloid compartment, as they were also observed in Atg16l1-deficient primary murine neutrophils. A missense polymorphism (Thr300Ala) in the essential autophagy gene ATG16L1 is associated with Crohn disease (CD). Previous studies showed that this polymorphism leads to enhanced cleavage of ATG16L1 T300A protein and thus reduced autophagy. Similar findings were shown in primary human macrophages from controls and a population of CD patients carrying the Atg16l1 T300A risk variant and who were controlled for NOD2 CD-associated variants. This study revealed that ATG16L1 deficiency led to alterations in macrophage function that contribute to the severity of CD.


Conflict of interest statement

The authors have declared that no conflict of interest exists.

Figures

Figure 1
Figure 1
Atg16l1 deficiency in murine myeloid cells exacerbated acute and chronic colitis. (A) Schematic of Atg16l1 gene targeting. (B) RT-PCR of Atg16l1 mRNA in mouse bone marrow-derived macrophages (BMM) and bone marrow-derived dendritic cells (BMDC). Each filled circle represents an independent experiment and data are expressed as percent of β-actin expression. (C) Representative immunoblot of Atg16l1, LC3 and β-actin from 3 independent experiments. (D) Representative H&E stained mid-colon sections from 6 month old mice at 100x magnification is shown and data from multiple mice are quantitated (n=7–8 per group). (E) Disease activity index of Salmonella infection model (n=12–15 per group), acute DSS (n=10 per group), and chronic DSS (n=10–19 per group) were quantitated and are shown. Scale bar represents 100 μm. *P<0.05, **P<0.01, ***P<0.001.
Figure 2
Figure 2
Splenomegaly and increased cellular infiltrate in mice with Atg16l1 deficiency in myeloid cells. (A) Representative H&E stained mid-colon sections at 100x magnification are shown and histologic inflammation scores are quantitated. Scale bar represents 100 μm. (B) Spleen weight in grams (g) and splenocyte number were quantitated from chronic DSS induced colitis in wildtype (Flox) mice or from mice with Atg16l1 deficiency in myeloid cells (ΔMye) and dendritic cells (ΔDC). (C) Cell recovery from mesenteric lymph nodes (MLN) and lamina propria mononuclear cells (LPMC) were quantitated and are shown. Each filled circle representes data from an individual mouse. *P<0.05, **P<0.01.
Figure 3
Figure 3
Increased production of Il-1β and TNFα with Atg16l1 deficiency in myeloid cells. MHCII+CD11b+F4/80+ macrophages (A) and MHCII+CD11b+CD11c+ dendritic cells (B) were stained for intracellular Il-1β and TNFα expression and quantitated for Salmonella infection (right panel), acute DSS (middle panel) and chronic DSS (right panel). Isolated mononuclear cells from MLN and LPMC from the 3 murine colitis models were cultured for 3 days and the levels of secreted Il-1β in MLN (C) and LPMC (D) as well as TNFα in MLN (E) and LPMC (F) were assessed by ELISA. Each filled circle for MLN represents the value obtained from a single mouse. Each filled circle for LPMC represents the value obtained from an independent experiment using pooled samples from 2 mice. *P<0.05, **P<0.01, ***P<0.001.
Figure 4
Figure 4
Increased number of pro-inflammatory macrophages with Atg16l1 deficiency. Macrophage subsets in LPMC were assessed as pro-inflammatory (P2) and anti-inflammatory (P3/4) macrophages in 2 month old non-colitic mice and in the 3 colitis models. Representative flow cytometry plots of gated CD45+CD11b+CD64+CD103 cells are shown (A) and quantitated (B). (C) RT-PCR of mRNA for pro-inflammatory macrophage markers (Nos2, Ptgs2) and regulatory macrophage markers (Retnla, Arg1) were measured from LPMC macrophages isolated from 2 month old non-colitic mice and represented as percent of β-actin reference gene expression. (D) RT-PCR of mRNA for Nos2 and Ptgs2 were determined in bone marrow-derived macrophages (BMM) cultured in M1 polarizing conditions and mRNA for Retnla and Arg1 were determined in BMM cultured in M2 polarizing conditions. Each filled circle represents an independent experiment using pooled LPMC from 2 mice of the same genotype for (B) and from a single mouse in (C, D). *P<0.05, **P<0.01, ***P<0.001.
Figure 5
Figure 5
Impaired clearance and altered cellular trafficking of S. typhimurium in Atg16l1 deficient BMM. WT and Atg16l1ΔMye BMM were infected with S. typhimurium and surviving intracellular bacteria were quantified (A), representative TEM images of WT (n=17) and Atg16l1-deficient (n=25) BMM infected with S. typhimurium are shown (B), and vesicles containing multiple Salmonella are quantitated (C). White arrows indicate vesicles containing S. typhimurium. Scale bar = 2 μm. Each filled circle represents an independent experiment (A) or from a single macrophage (C). (D) Representative FAC plot of intracellular Salmonella (left panel), quantitated as percent (middle panel) and MFI (right panel) are shown (n=5 independent experiments). Representative confocal image of WT or Atg16l1-deficient BMM stained with anti-Salmonella (green stain, top panels) and anti-Lamp1, -Rab5, -Rab7 (violet stain, middle panels) are shown (E) and quantitated (F). Co-localized images where green stain overlaps with purple stain are marked by white arrows (merged white stain, bottom panels). Scale bar = 20 μm. Each filled circle represents data acquired from an individual BMM from 3 independent experiments. (G) Quantification of S. typhimurium in either double-membrane versus single-membrane vesicles obtained from TEM in each BMM are shown as mean ± SD. *P<0.05, **P<0.01, ***P<0.001.
Figure 6
Figure 6
Atg16l1 deficiency increased ROS production and altered mitochondria homeostasis. (A) Relative ROS production as measured by luminol-dependent chemiluminescence was determined over 60 minutes for WT (Atg16l1flox) and Atg16l1 deficient (Atg16l1ΔMye) BMM treated with S. typhimurium or zymosan (filled diamond and solid line) and at baseline (filled diamond). Data of 8 independent experiments with similar results are shown. (B) Phospho-p40phox and β-actin levels in WT and Atg16l1-deficient BMM at baseline and with S. typhimurium infection were determined by immunoblotting. (C) Representative TEM image of WT and Atg16l1-deficient BMM are shown. Scale bar = 2 μm. White arrowheads indicate mitochondria, and mitochondria per BMM and are quantitated. (D) Representative flow cytometry plot of WT and Atg16l1-deficient BMM left unstained (filled) or labeled with MitoSox (unfilled line) are shown and MFI is quantitated. (E) Representative flow cytometry plot of WT or Atg16l1-deficient BMM with and without S. typhimurium infection and stained with MitoTracker Deep Red and MitoTracker Green were shown. Each filled circle represents an independent experiment from a single mouse. *P<0.05.
Figure 7
Figure 7
Atg16l1 is required for optimal antigen processing by macrophages for MHCII antigen presentation. Representative flow cytometry plots of proliferating OT-II CD4+ T cells labeled with CellTrace stimulated with BMM treated with whole Ova protein (A) or Ova peptide 323–339 (B) are shown. Decreased CellTrace fluorescence intensity indicated proliferation. Each filled circle represents an independent experiment. *P<0.05.
Figure 8
Figure 8
Reduced autophagy and pro-inflammatory macrophage polarization with the human CD risk ANP ATG16L1 T300A. Representative immunoblot of LC3 and β-actin from non-IBD control (A) and CD patients (B) who were homozygous for risk or non-risk ATG16L1 T300A alleles are shown and quantitated as percent of β-actin reference expression. Nos2 and Ptgs2 mRNA levels were measured by RT-PCR in peripheral blood derived macrophages (PBM) cultured in M1-polarizing conditions, and mRNA for Retnla and Arg1 were measured in PBM cultured in M2-polarizing conditions. mRNA expression is expressed as percent of β-actin reference expression for non IBD controls (C) and CD patients (D). Representative flow cytometry plots of fecal bacteria stained with anti-IgA antibody from non-IBD controls and from CD patients are shown and quantitated. Each experiment was done in pairs with an individual of each genotype for ATG16L1. (F) PBM from risk or non-risk ATG16L1 T300A variant subjects were infected with S. typhimurium, and surviving intracellular bacteria were quantified. Each filled circle is representative of an independent experiment from a human subject. *P<0.05, **P<0.01, ***P<0.001.
Figure 9
Figure 9. Altered intracellular trafficking in PBM with CD risk ATG16L1 T300A variant
(A) Representative flow cytometry plots (n=4 independent experiments from 4 subjects per group) of PBM from risk and non-risk ATG16L1 T300A homozygotes that were uninfected (dotted line) or infected with S. typhimurium and stained with anti-Salmonella antibody (solid line) are shown. Representative TEM image of PBM from homozygotes risk and non-risk for CD-associated ATG16L1 T300A variant infected with S. typhimurium is shown (B) and quantitated for number of intracellular vesicles that contain more than 1 Salmonella (C) and for the number of single- and double-membrane vesicles that contain bacteria (D). Each filled circle represent an independent experiment from at least 6 subjects per group. Scale bar in TEM = 2 μm. (E) Representative confocal microscopy image of PBM from subjects with risk or non-risk ATG16L1 T300A variants infected with S. typhimurium and stained with anti-Salmonella (green stain) and anti-Lamp1 (violet stain) at 630× magnification are shown. Co-localized regions where green stain overlaps with purple stain are marked by white arrows (merged white stain) and represented by percent of co-localization. Scale bar in confocal images = 20 μm. Each filled circle in (C–E) represents a value obtained from a PBM from at least 6 subjects per group.
Figure 10
Figure 10
CD risk ATG16L1 T300A increased ROS production and mitochondria number. (A) Relative ROS production, as measured by luminol-dependent chemiluminescence, was determined for risk or non-risk for ATG16L1 T300A variant PBM treated with S. typhimurium or zymosan (filled diamond and solid line) and at baseline (filled diamond). Representative data from at least 6 independent experiments (from 6 human subjects in each group) with similar results are shown. (B) Representative TEM image of non-risk (n=12 PBM) or risk ATG16L1 T300A variant (n=12 PBM examined) PBM. At least 5 subjects per group were used. White arrowheads point to mitochondria, and mitochondria per BMM are quantitated. White scale bar in TEM images denotes 2 mm. *P<0.05, **P<0.01.
Figure 11
Figure 11
CD risk ATG16L1 T300A alters mitochondria phenotype. Representative flow cytometry plot of risk or non-risk ATG16L1 T300A PBM that is either unstained (filled) or stained with MitoSox (unfilled line) are shown for non-IBD control (A, left panels) and CD patients (B, left panels). Representative flow cytometry plot of non-risk and risk ATG16L1 T300A variant PBM with and without S. typhimurium infection and stained with MitoTracker Deep Red and MitoTracker Green is shown and quantitated for non-IBD control (A, middle and right panels) and CD patients (B, middle and right panels). Each filled circle represents an independent experiment from a human subject. *P<0.05, **P<0.01.

References

    1. Franke A, McGovern DP, Barrett JC, Wang K, Radford-Smith GL, Ahmad T, Lees CW, Balschun T, Lee J, Roberts R, Anderson CA, Bis JC, Bumpstead S, Ellinghaus D, Festen EM, Georges M, Green T, Haritunians T, Jostins L, Latiano A, Mathew CG, Montgomery GW, Prescott NJ, Raychaudhuri S, Rotter JI, Schumm P, Sharma Y, Simms LA, Taylor KD, Whiteman D, Wijmenga C, Baldassano RN, Barclay M, Bayless TM, Brand S, Buning C, Cohen A, Colombel JF, Cottone M, Stronati L, Denson T, De Vos M, D’Inca R, Dubinsky M, Edwards C, Florin T, Franchimont D, Gearry R, Glas J, Van Gossum A, Guthery SL, Halfvarson J, Verspaget HW, Hugot JP, Karban A, Laukens D, Lawrance I, Lemann M, Levine A, Libioulle C, Louis E, Mowat C, Newman W, Panes J, Phillips A, Proctor DD, Regueiro M, Russell R, Rutgeerts P, Sanderson J, Sans M, Seibold F, Steinhart AH, Stokkers PC, Torkvist L, Kullak-Ublick G, Wilson D, Walters T, Targan SR, Brant SR, Rioux JD, D’Amato M, Weersma RK, Kugathasan S, Griffiths AM, Mansfield JC, Vermeire S, Duerr RH, Silverberg MS, Satsangi J, Schreiber S, Cho JH, Annese V, Hakonarson H, Daly MJ, Parkes M. Genome-wide meta-analysis increases to 71 the number of confirmed Crohn’s disease susceptibility loci. Nature genetics. 2010;42:1118–1125. - PMC - PubMed
    1. Jostins L, Ripke S, Weersma RK, Duerr RH, McGovern DP, Hui KY, Lee JC, Schumm LP, Sharma Y, Anderson CA, Essers J, Mitrovic M, Ning K, Cleynen I, Theatre E, Spain SL, Raychaudhuri S, Goyette P, Wei Z, Abraham C, Achkar JP, Ahmad T, Amininejad L, Ananthakrishnan AN, Andersen V, Andrews JM, Baidoo L, Balschun T, Bampton PA, Bitton A, Boucher G, Brand S, Buning C, Cohain A, Cichon S, D’Amato M, De Jong D, Devaney KL, Dubinsky M, Edwards C, Ellinghaus D, Ferguson LR, Franchimont D, Fransen K, Gearry R, Georges M, Gieger C, Glas J, Haritunians T, Hart A, Hawkey C, Hedl M, Hu X, Karlsen TH, Kupcinskas L, Kugathasan S, Latiano A, Laukens D, Lawrance IC, Lees CW, Louis E, Mahy G, Mansfield J, Morgan AR, Mowat C, Newman W, Palmieri O, Ponsioen CY, Potocnik U, Prescott NJ, Regueiro M, Rotter JI, Russell RK, Sanderson JD, Sans M, Satsangi J, Schreiber S, Simms LA, Sventoraityte J, Targan SR, Taylor KD, Tremelling M, Verspaget HW, De Vos M, Wijmenga C, Wilson DC, Winkelmann J, Xavier RJ, Zeissig S, Zhang B, Zhang CK, Zhao H, Silverberg MS, Annese V, Hakonarson H, Brant SR, Radford-Smith G, Mathew CG, Rioux JD, Schadt EE, Daly MJ, Franke A, Parkes M, Vermeire S, Barrett JC, Cho JH I. B. D. G. C. International. Host-microbe interactions have shaped the genetic architecture of inflammatory bowel disease. Nature. 2012;491:119–124. - PMC - PubMed
    1. Liu JZ, van Sommeren S, Huang H, Ng SC, Alberts R, Takahashi A, Ripke S, Lee JC, Jostins L, Shah T, Abedian S, Cheon JH, Cho J, Daryani NE, Franke L, Fuyuno Y, Hart A, Juyal RC, Juyal G, Kim WH, Morris AP, Poustchi H, Newman WG, Midha V, Orchard TR, Vahedi H, Sood A, Sung JJ, Malekzadeh R, Westra HJ, Yamazaki K, Yang SK, Barrett JC, Franke A, Alizadeh BZ, Parkes M, KTB, Daly MJ, Kubo M, Anderson CA, Weersma RK C. International Multiple Sclerosis Genetics, I. B. D. G. C. International. Association analyses identify 38 susceptibility loci for inflammatory bowel disease and highlight shared genetic risk across populations. Nature genetics. 2015;47:979–986. - PMC - PubMed
    1. Hampe J, Franke A, Rosenstiel P, Till A, Teuber M, Huse K, Albrecht M, Mayr G, De La Vega FM, Briggs J, Gunther S, Prescott NJ, Onnie CM, Hasler R, Sipos B, Folsch UR, Lengauer T, Platzer M, Mathew CG, Krawczak M, Schreiber S. A genome-wide association scan of nonsynonymous SNPs identifies a susceptibility variant for Crohn disease in ATG16L1. Nature genetics. 2007;39:207–211. - PubMed
    1. He C, Klionsky DJ. Regulation mechanisms and signaling pathways of autophagy. Annual review of genetics. 2009;43:67–93. - PMC - PubMed

Publication types

MeSH terms

Substances