

Effects of social adversity and HIV on subcortical shape and neurocognitive function
- PMID: 28130744
- PMCID: PMC5529267
- DOI: 10.1007/s11682-017-9676-0
Effects of social adversity and HIV on subcortical shape and neurocognitive function
Abstract
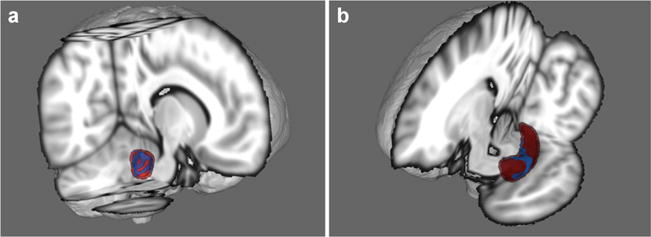
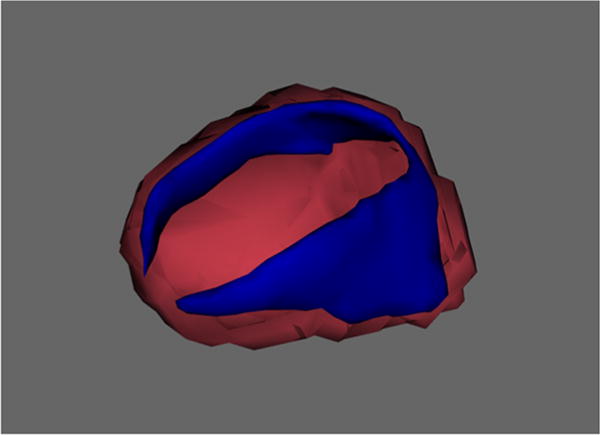
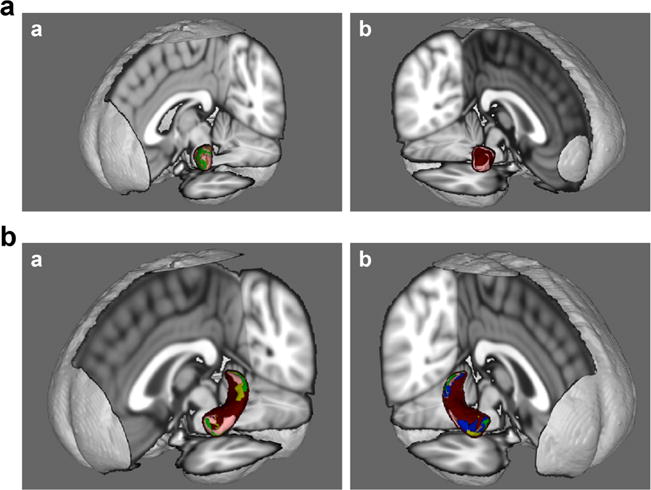
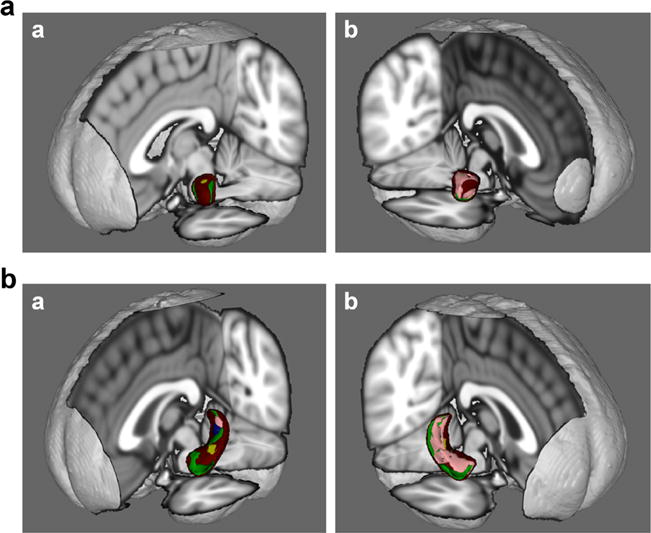
The purpose of the current study was to examine the independent and interactive effects of social adversity (SA) and HIV infection on subcortical shape alterations and cognitive functions. Participants included HIV+ (n = 70) and HIV- (n = 23) individuals who underwent MRI, neurocognitive and clinical assessment, in addition to completing questionnaires from which responses were used to create an SA score. Bilateral amygdalae and hippocampi were extracted from T1-weighted images. Parametric statistical analyses were used to compare the radial distance of the structure surface to a median curve to determine the presence of localized shape differences as a function of HIV, SA and their interaction. Next, multiple regression was used to examine the interactive association between HIV and SA with cognitive performance data. An HIV*SA interactive effect was found on the shape of the right amygdala and left hippocampus. Specifically, HIV-infected participants (but not HIV-uninfected controls) who evidenced higher levels of SA displayed an inward deformation of the surface consistent with reduced volume of these structures. We found interactive effects of HIV and SA on learning/memory performance. These results suggest that HIV+ individuals may be more vulnerable to neurological and cognitive changes in the hippocampus and amygdala as a function of SA than HIV- individuals, and that SA indicators of childhood SES and perceived racial discrimination are important components of adversity that are associated with cognitive performance.
Keywords: Adversity; Amygdala; Cognition; Hippocampus; Human immunodeficiency virus; Structural neuroimaging.
Conflict of interest statement
Dr. Taylor Kuhn declares that he has no conflict of interest.
Ms. Zanjbeel Mahmood declares that she has no conflict of interest.
Dr. Robert Bilder declares that he has no conflict of interest.
Mr. Timothy Williamson declares that he has no conflict of interest.
Dr. Elyse Singer declares that she has no conflict of interest.
Dr. Alyssa Arentoft declares no conflict of interest.
Figures
References
-
- Adler NE, Boyce T, Chesney MA, Cohen S, Folkman S, et al. Socioeconomic status and health: the challenge of the gradient. American Psychologist. 1994;49:15–24. - PubMed
-
- Allison P. When can you safely ignore multicollinearity? Statistical Horizons. Last modified September. 2012;10:2012.
-
- Alvarez-Uria G, Naik PK, Pakam R, Midde M. Early HIV viral load determination after initiating first-line antiretroviral therapy for indentifying patients with high risk of developing virological failure: data from a cohort study in a resource-limited setting. Tropical Medicine & International Health. 2012;17:1152–1155. doi: 10.1111/j.1365-3156.2012.02982.x. - DOI - PubMed
Publication types
MeSH terms
Grants and funding
LinkOut - more resources
Full Text Sources
Other Literature Sources
Medical
