. 2017 Jan 28:6:e23329.
doi: 10.7554/eLife.23329.

Node of Ranvier length as a potential regulator of myelinated axon conduction speed

Affiliations

Node of Ranvier length as a potential regulator of myelinated axon conduction speed

I Lorena Arancibia-Cárcamo et al. Elife. .

Abstract

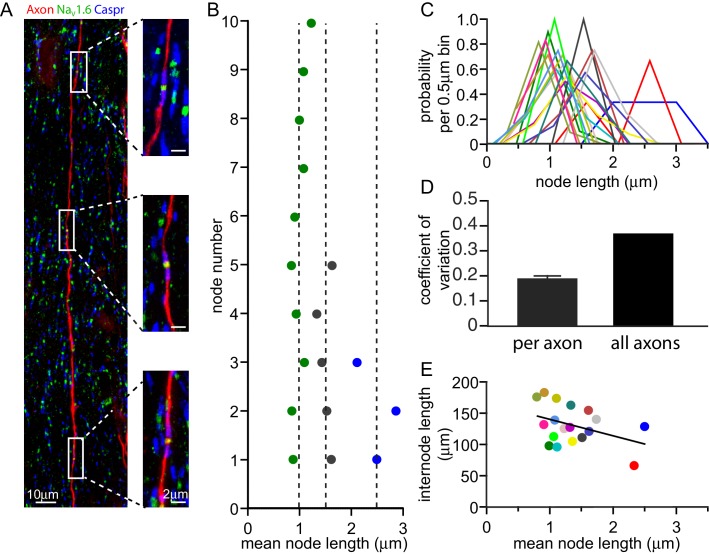
Myelination speeds conduction of the nerve impulse, enhancing cognitive power. Changes of white matter structure contribute to learning, and are often assumed to reflect an altered number of myelin wraps. We now show that, in rat optic nerve and cerebral cortical axons, the node of Ranvier length varies over a 4.4-fold and 8.7-fold range respectively and that variation of the node length is much less along axons than between axons. Modelling predicts that these node length differences will alter conduction speed by ~20%, similar to the changes produced by altering the number of myelin wraps or the internode length. For a given change of conduction speed, the membrane area change needed at the node is >270-fold less than that needed in the myelin sheath. Thus, axon-specific adjustment of node of Ranvier length is potentially an energy-efficient and rapid mechanism for tuning the arrival time of information in the CNS.

Keywords: axon; conduction speed; myelin; neuroscience; node of Ranvier; rat.


Conflict of interest statement

The authors declare that no competing interests exist.

Figures

Figure 1.
Figure 1.. Heterogeneity of Ranvier node lengths in the optic nerve and cerebral cortex.
(A) Confocal image of a single optic nerve node of Ranvier showing the node labelled with antibody to NaV1.6 (green) and paranodes labelled for Caspr (red). (B) Intensity profile of Caspr staining for the node in A. Node length was measured as the distance between the half maximum intensity for each paranode. (C, D) Confocal images of nodes in the optic nerve (C) and layer V of the cortex (D) highlighting the different range of node of Ranvier sizes in these areas. (E) Mean ± s.e.m. of the node lengths measured in optic nerve (ON, red) and layer V of the cortex (blue). (F, G) Distribution of node lengths from data in E for optic nerve (F) and cortex (G). (H) Node diameter as a function of node length in the optic nerve (red) and in grey matter of the cerebral cortex (blue). Slope of regression lines in H are not significantly different from zero (p=0.14 (optic nerve) and p=0.42 (cortex)). (I) NaV1.6 immunolabel intensity (summed over each node) as a function of node length in cerebral cortex (each point is one node). NaV1.6 labelling is correlated with node length (slope of regression line is significantly greater than zero, p=1.2×10⁻¹⁵). DOI: http://dx.doi.org/10.7554/eLife.23329.003
Figure 1—figure supplement 1.
Figure 1—figure supplement 1.. Heterogeneity of Ranvier node lengths in the optic nerve.
Top: EM picture of node of Ranvier in the adult optic nerve, showing surrounding oligodendrocytes (paranodal loops false-coloured green), an astrocyte (pink) and the node length. In practice node length was measured from the total thickness of the transverse sections across the nerve that were between the surrounding oligodendrocytes. Bottom: Node length as a function of node diameter in the optic nerve for 46 nodes measured by EM. Slope of regression line is not significantly different from zero (p=0.46). DOI: http://dx.doi.org/10.7554/eLife.23329.004
Figure 2.
Figure 2.. Node of Ranvier lengths are correlated along an axon.
(A) Composite confocal image of a single axon in the corpus callosum iontophoretically labelled with tetramethylrhodamine dextran (red). Three consecutive nodes of Ranvier are highlighted and shown in high resolution images. Nodes of Ranvier are identified as NaV1.6 positive clusters (green) flanked by Caspr positive paranodes (blue). (B) Successive node lengths along three example axons with different mean node lengths. The mean node length for each axon is plotted as a dashed line. (C) Distributions of node lengths of 18 individual axons (in 0.5 µm bins, centered on the median node length for each axon) show that the variability along each axon is much less than the variability between axons. (D) Mean coefficient of variation for node lengths along 18 individual axons and the overall coefficient of variation for all axons examined. (E) Mean internode length for each axon plotted against the mean node length for that axon. Each axon is represented by a different colour, and that colour is maintained for panels B, C and E. Regression line slope is not significantly different from zero (p=0.1). DOI: http://dx.doi.org/10.7554/eLife.23329.005
Figure 3.
Figure 3.. Predicted effect on conduction speed of different node lengths.
(A–F) Calculated conduction speed as a function of node length for axons in (A) the optic nerve and (B–F) the cortical grey matter. For panels A–F, simulations were carried out assuming either that the density of ion channels at the node is constant as the node length is changed (solid lines), or that the number of ion channels is kept constant (dashed lines) at the value assumed for the mean node length. (C–D) Simulations for cortex as in B but examining the effect of altering internode length (INL, given by each curve). (E–F) Calculated dependence of conduction speed of cortical axons on internode length for different assumed node lengths (NL). The observed range of each abscissa parameter is indicated on the graphs. (G). Change in membrane area needed, in the myelin sheath (myelin wrap) or node of Ranvier (node length, NL), to change the conduction speed by 8.6% in optic nerve or 10.5% in cortical axons, when nodal ion channel density is held constant (note logarithmic scale). DOI: http://dx.doi.org/10.7554/eLife.23329.007

References

    1. Agrawal D, Hawk R, Avila RL, Inouye H, Kirschner DA. Internodal myelination during development quantitated using X-ray diffraction. Journal of Structural Biology. 2009;168:521–526. doi: 10.1016/j.jsb.2009.06.019. - DOI - PubMed
    1. Arancibia-Carcamo IL, Attwell D. The node of ranvier in CNS pathology. Acta Neuropathologica. 2014;128:161–175. doi: 10.1007/s00401-014-1305-z. - DOI - PMC - PubMed
    1. Bakiri Y, Káradóttir R, Cossell L, Attwell D. Morphological and electrical properties of oligodendrocytes in the white matter of the corpus callosum and cerebellum. The Journal of Physiology. 2011;589:559–573. doi: 10.1113/jphysiol.2010.201376. - DOI - PMC - PubMed
    1. Bengtsson SL, Nagy Z, Skare S, Forsman L, Forssberg H, Ullén F. Extensive piano practicing has regionally specific effects on white matter development. Nature Neuroscience. 2005;8:1148–1150. doi: 10.1038/nn1516. - DOI - PubMed
    1. Berthold CH, Rydmark M. Anatomy of the paranode-node-paranode region in the cat. Experientia. 1983;39:964–976. doi: 10.1007/BF01989761.. - DOI - PubMed

Publication types