

Trends in premature mortality in the USA by sex, race, and ethnicity from 1999 to 2014: an analysis of death certificate data
- PMID: 28131493
- PMCID: PMC5388357
- DOI: 10.1016/S0140-6736(17)30187-3
Trends in premature mortality in the USA by sex, race, and ethnicity from 1999 to 2014: an analysis of death certificate data
Abstract
Background: Reduction of premature mortality is a UN Sustainable Development Goal. Unlike other high-income countries, age-adjusted mortality in the USA plateaued in 2010 and increased slightly in 2015, possibly because of rising premature mortality. We aimed to analyse trends in mortality in the USA between 1999 and 2014 in people aged 25-64 years by age group, sex, and race and ethnicity, and to identify specific causes of death underlying the temporal trends.
Methods: For this analysis, we used cause-of-death and demographic data from death certificates from the US National Center for Health Statistics, and population estimates from the US Census Bureau. We estimated annual percentage changes in mortality using age-period-cohort models. Age-standardised excess deaths were estimated for 2000 to 2014 as observed deaths minus expected deaths (estimated from 1999 mortality rates).
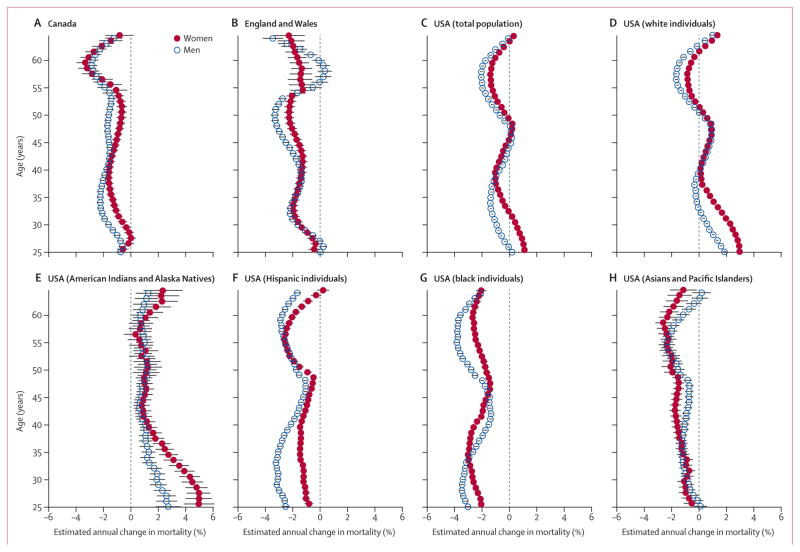
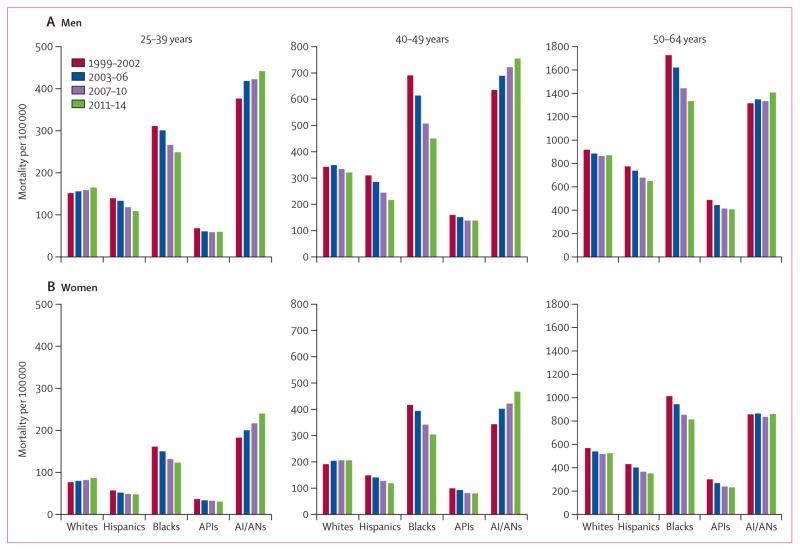
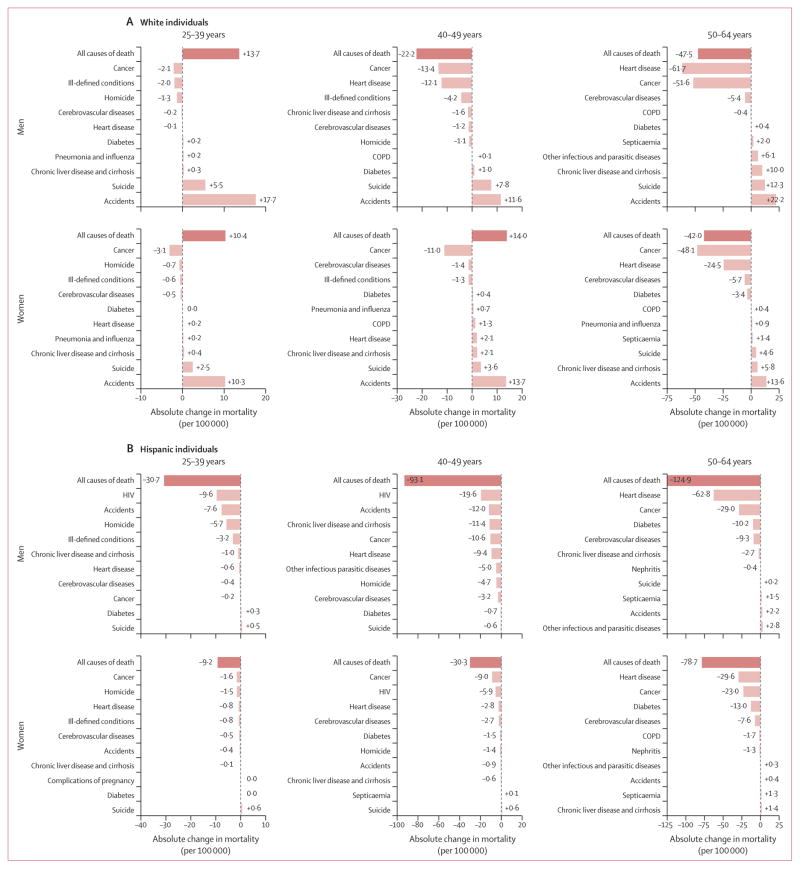
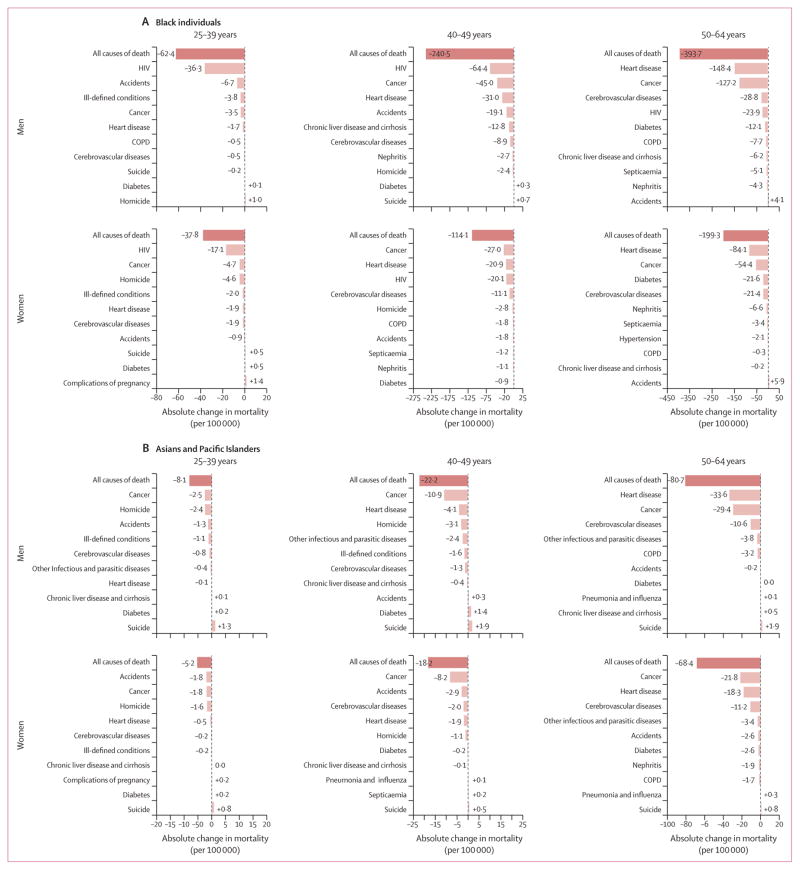
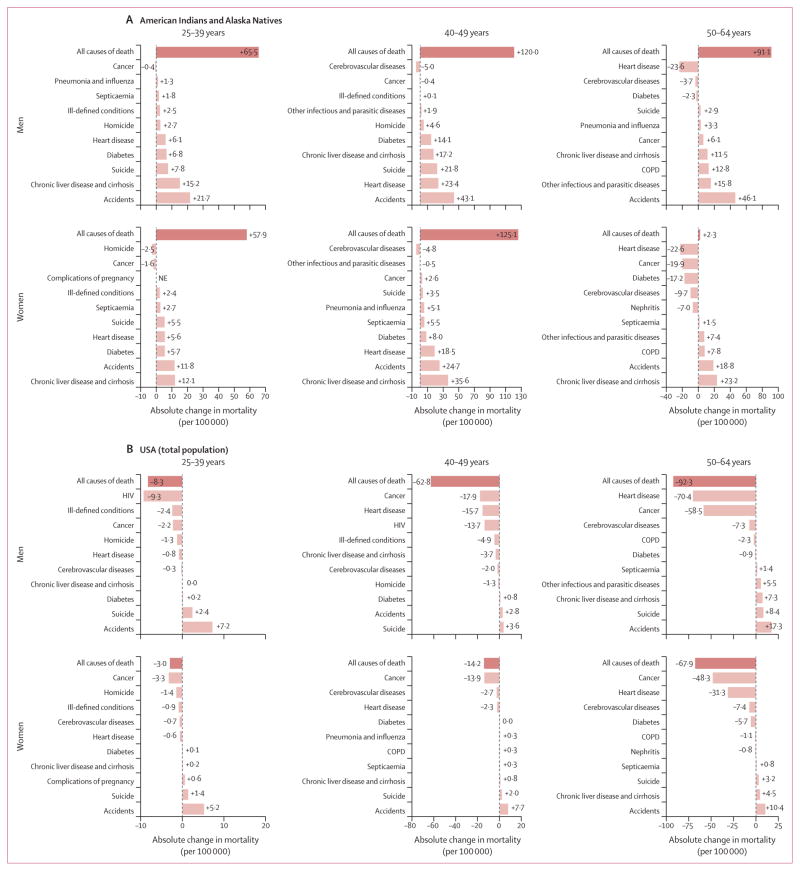
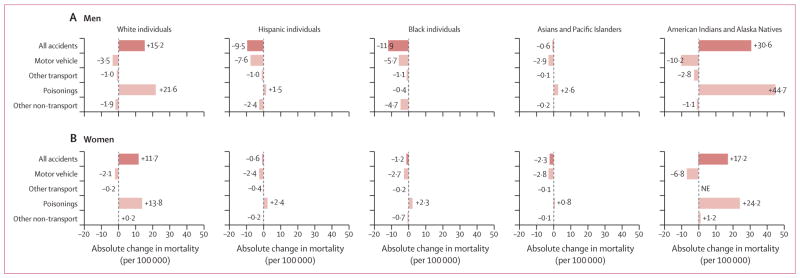
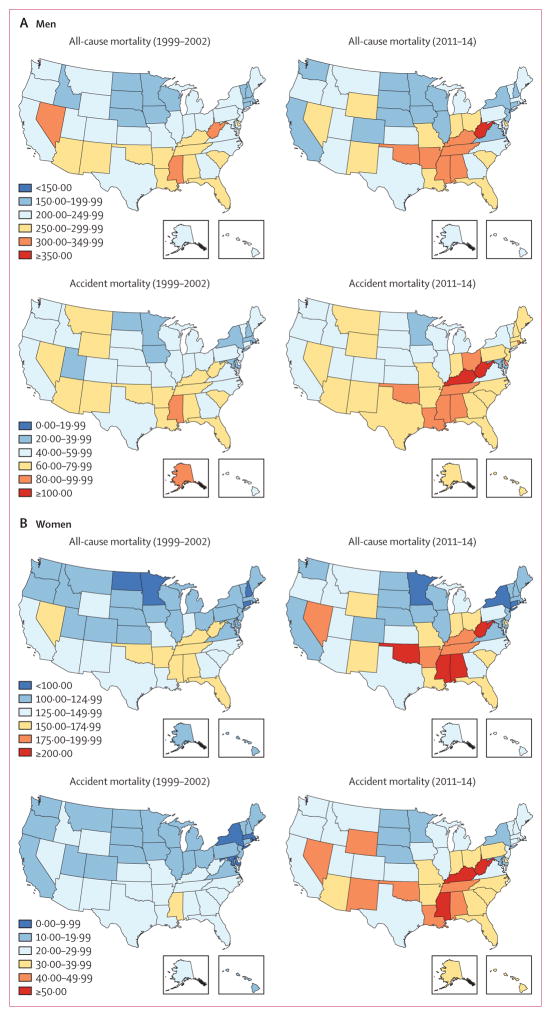
Findings: Between 1999 and 2014, premature mortality increased in white individuals and in American Indians and Alaska Natives. Increases were highest in women and those aged 25-30 years. Among 30-year-olds, annual mortality increases were 2·3% (95% CI 2·1-2·4) for white women, 0·6% (0·5-0·7) for white men, and 4·3% (3·5-5·0) and 1·9% (1·3-2·5), respectively, for American Indian and Alaska Native women and men. These increases were mainly attributable to accidental deaths (primarily drug poisonings), chronic liver disease and cirrhosis, and suicide. Among individuals aged 25-49 years, an estimated 111 000 excess premature deaths occurred in white individuals and 6600 in American Indians and Alaska Natives during 2000-14. By contrast, premature mortality decreased substantially across all age groups in Hispanic individuals (up to 3·2% per year), black individuals (up to 3·9% per year), and Asians and Pacific Islanders (up to 2·6% per year), mainly because of declines in HIV, cancer, and heart disease deaths, resulting in an estimated 112 000 fewer deaths in Hispanic individuals, 311 000 fewer deaths in black individuals, and 34 000 fewer deaths in Asians and Pacific Islanders aged 25-64 years. During 2011-14, American Indians and Alaska Natives had the highest premature mortality, followed by black individuals.
Interpretation: Important public health successes, including HIV treatment and smoking cessation, have contributed to declining premature mortality in Hispanic individuals, black individuals, and Asians and Pacific Islanders. However, this progress has largely been negated in young and middle-aged (25-49 years) white individuals, and American Indians and Alaska Natives, primarily because of potentially avoidable causes such as drug poisonings, suicide, and chronic liver disease and cirrhosis. The magnitude of annual mortality increases in the USA is extremely unusual in high-income countries, and a rapid public health response is needed to avert further premature deaths.
Funding: US National Cancer Institute Intramural Research Program.
Copyright © 2017 Elsevier Ltd. All rights reserved.
Conflict of interest statement
We declare no competing interests.
Figures
Comment in
-
Macro-level perspective to reverse recent mortality increases.Lancet. 2017 Mar 11;389(10073):991-992. doi: 10.1016/S0140-6736(17)30186-1. Epub 2017 Jan 26. Lancet. 2017. PMID: 28131492 No abstract available.
-
Premature deaths in the USA: repeal has no appeal.Lancet. 2017 Jan 28;389(10067):332. doi: 10.1016/S0140-6736(17)30196-4. Lancet. 2017. PMID: 28137679 No abstract available.
-
White individuals' risk of premature mortality in context.Lancet. 2017 Apr 8;389(10077):1393. doi: 10.1016/S0140-6736(17)30887-5. Lancet. 2017. PMID: 28402815 No abstract available.
References
-
- Norheim OF, Jha P, Admasu K, et al. Avoiding 40% of the premature deaths in each country, 2010–30: review of national mortality trends to help quantify the UN sustainable development goal for health. Lancet. 2015;385:239–52. - PubMed
-
- Ma J, Ward EM, Siegel RL, Jemal A. Temporal trends in mortality in the United States, 1969–2013. JAMA. 2015;314:1731–39. - PubMed
-
- Ahmad FB. National Vital Statistics System, Vital Statistics Rapid Release Program 2016. Atlanta, GA: National Center for Health Statistics; 2016. Quarterly provisional estimates for selected indicators of mortality, 2014-Quarter 1, 2016.
-
- Kochanek KD, Murphy SL, Xu J, Tejada-Vera B. Deaths: final data for 2014. Natl Vital Stat Rep. 2016;65:1–122. - PubMed
MeSH terms
Grants and funding
LinkOut - more resources
Full Text Sources
Other Literature Sources
