. 2017 Apr 1:149:404-414.
doi: 10.1016/j.neuroimage.2017.01.034. Epub 2017 Jan 25.

A new generation of magnetoencephalography: Room temperature measurements using optically-pumped magnetometers

Affiliations

A new generation of magnetoencephalography: Room temperature measurements using optically-pumped magnetometers

Elena Boto et al. Neuroimage. .

Abstract

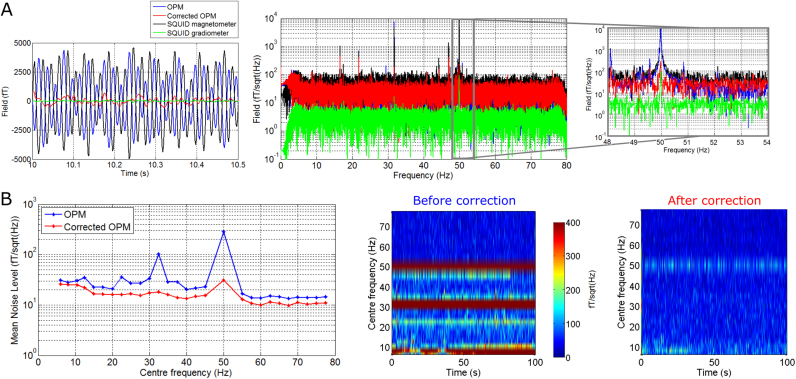
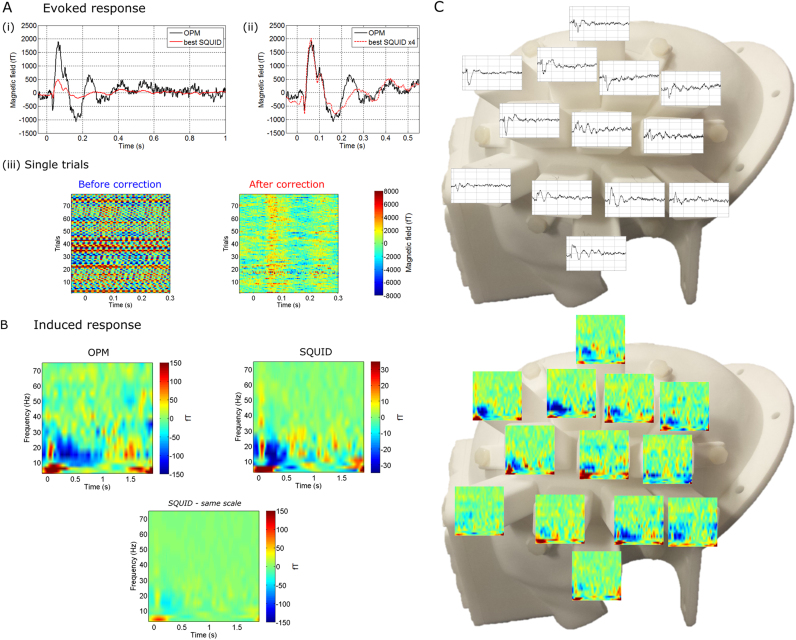
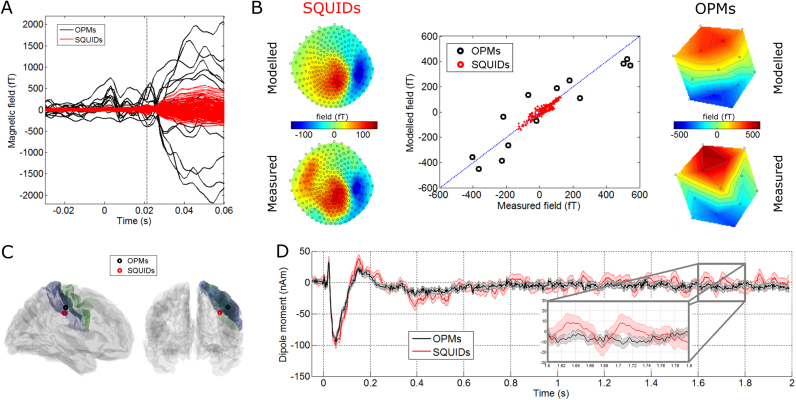
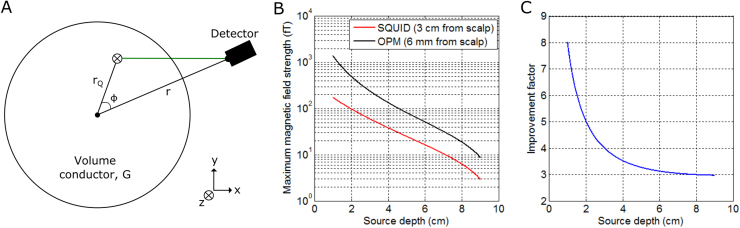
Advances in the field of quantum sensing mean that magnetic field sensors, operating at room temperature, are now able to achieve sensitivity similar to that of cryogenically cooled devices (SQUIDs). This means that room temperature magnetoencephalography (MEG), with a greatly increased flexibility of sensor placement can now be considered. Further, these new sensors can be placed directly on the scalp surface giving, theoretically, a large increase in the magnitude of the measured signal. Here, we present recordings made using a single optically-pumped magnetometer (OPM) in combination with a 3D-printed head-cast designed to accurately locate and orient the sensor relative to brain anatomy. Since our OPM is configured as a magnetometer it is highly sensitive to environmental interference. However, we show that this problem can be ameliorated via the use of simultaneous reference sensor recordings. Using median nerve stimulation, we show that the OPM can detect both evoked (phase-locked) and induced (non-phase-locked oscillatory) changes when placed over sensory cortex, with signals ~4 times larger than equivalent SQUID measurements. Using source modelling, we show that our system allows localisation of the evoked response to somatosensory cortex. Further, source-space modelling shows that, with 13 sequential OPM measurements, source-space signal-to-noise ratio (SNR) is comparable to that from a 271-channel SQUID system. Our results highlight the opportunity presented by OPMs to generate uncooled, potentially low-cost, high SNR MEG systems.


Figures

Fig. 1
Fig. 1
The OPM sensor. A) The QuSpin OPM sensor, next to a UK pound coin, which has a semiconductor laser and gas cell mounted in a housing of 14×21×80 mm3. The field sensing area is at 6.5 mm from the end of the housing. B) Schematic showing the basic operation. 1: 795 nm laser. 2: Collimating lens. 3: Linear polariser. 4: Circular polariser. 5: Light beam. 6: Reflecting prisms. 7: Vapour cell. 8: Photodiode. (Coils not shown). The amplitude of the two components of the magnetic field that are perpendicular to the beam can be simultaneously measured via assessment of changes in light intensity at the photo-diode.
Fig. 2
Fig. 2
Head-cast design and fabrication: A) Single sagittal slice from the anatomical MRI. B) Outer head surface extracted from MRI. C) CAD model of the head-cast with slots designed to house the OPM sensors over sensorimotor cortex. Slot positions are based on a-priori prediction of the spatial topography of scalp field pattern, derived from previous SQUID measurements in the same subject. D) 3D-printed head-cast on subject. E) Subject in situ with the OPM attached. Note that the head-cast is not only fixed rigidly to the subject's scalp, but is also fixed relative to the MSR, thus eliminating any sensor motion relative to the subject, and subject motion relative to the MSR.
Fig. 3
Fig. 3
Synthesised Gradiometry (empty room noise). A) Magnetic fields plotted in time (left) and frequency (right), measured in an empty room. Red and blue traces show the OPM data with and without gradiometer correction respectively. The black trace shows a SQUID magnetometer and the green trace shows a SQUID gradiometer. Note that 97% of variance in the OPM signal was explained by the simultaneously measured SQUID reference sensors and their temporal derivatives. Here, gradiometry was applied to the full (100 s) time window and full (2–80 Hz) bandwidth. B) Left hand side shows a noise amplitude spectrum when gradiometer correction is applied to individual frequency bands. Uncorrected (blue) and corrected (red) OPM mean noise levels across 28 bands are shown. Centre and right panels show time-frequency spectra in fT/√Hz, before and after gradiometer correction.
Fig. 4
Fig. 4
Comparison of the magnitudes and (spatial, spectral and temporal) morphologies of the evoked and induced responses, measured using the OPM and the SQUID. A) (i) Measurements of the evoked response (in fT) for both the OPM (black) and SQUID (red). (ii) shows the same data as in (i) but with the SQUID time course multiplied by four to allow direct comparison of temporal morphology. (iii) Single trial evoked responses measured using OPM with (right) and without (left) gradiometer correction. Note that single trial responses are seen clearly. B) Time-frequency spectrograms showing the 0–80 Hz oscillatory signature of median nerve stimulation. Upper left hand panel shows OPM, upper right hand panel shows SQUID, and lower panel shows SQUID plotted on the same colour scale as the OPM, for comparison. C) The scalp level spatial topographies of the evoked and induced responses, overlaid onto the head-cast.
Fig. 5
Fig. 5
Source localisation of the evoked response: A) Averaged time courses of OPM data (black) recorded at the 13 different sensor locations across the head-cast, and SQUID data (red) corresponding to the 271 SQUID channels. Note the electrical stimulus artefact at t=0 and the evoked response peak at t=20 ms. B) Left and right panels show the scalp spatial topography (for the SQUIDs and OPMs, respectively) of the measured (bottom) and modelled (top) fields. The centre plot shows correlation between the modelled and measured fields for the OPMs (black) and SQUIDs (red). C) Two views of the N20 evoked response location. Note that the motor strip is shown in green and the sensory strip in blue. The peak localises to right primary sensory (S1) region as expected. The black marker shows localisation using the OPM system and the red marker shows equivalent localisation using the SQUID system. D) Reconstructed dipole time courses using the OPM (black) and SQUID (red) data.
Fig. A1
Fig. A1
Assessing signal magnitude as a function of source depth: A) Schematic of a simple analytical model. B) Magnitude of the measured radial magnetic field as a function of source depth for SQUID (red) and OPM (black). C) The measured improvement (ratio of fields measured by OPM and SQUID) as a function of depth.

References

    1. Alem O., Benison A.M., Barth D.S., Kitching J., Knappe S. Magnetoencephalography of epilepsy with a microfabricated atomic magnetrode. J. Neurosci. 2014;34:14324–14327. - PMC - PubMed
    1. Boto E., Bowtell R., Krüger P., Fromhold T.M., Morris P.G., Meyer S.S., Barnes G.R., Brookes M.J. On the potential of a new generation of magnetometers for MEG: a beamformer simulation study. PLoS One. 2016;11:e0157655. - PMC - PubMed
    1. Brookes M.J., Vrba J., Robinson S.E., Stevenson C.M., Peters A.M., Barnes G.R., Hillebrand A., Morris P.G. Optimising experimental design for MEG beamformer imaging. NeuroImage. 2008;39:1788–1802. - PubMed
    1. Brookes M.J., Zumer J.M., Stevenson C.M., Hale J.R., Barnes G.R., Vrba J., Morris P.G. Investigating spatial specificity and data averaging in MEG. NeuroImage. 2010;49:525–538. - PMC - PubMed
    1. Cheyne D.O. MEG studies of sensorimotor rhythms: a review. Exp. Neurol. 2013;245:27–39. - PubMed

Publication types