. 2017 May 5;45(8):4479-4492.
doi: 10.1093/nar/gkx055.

Long non-coding RNAs transcribed by ERV-9 LTR retrotransposon act in cis to modulate long-range LTR enhancer function

Affiliations

Long non-coding RNAs transcribed by ERV-9 LTR retrotransposon act in cis to modulate long-range LTR enhancer function

Tianxiang Hu et al. Nucleic Acids Res. .

Abstract

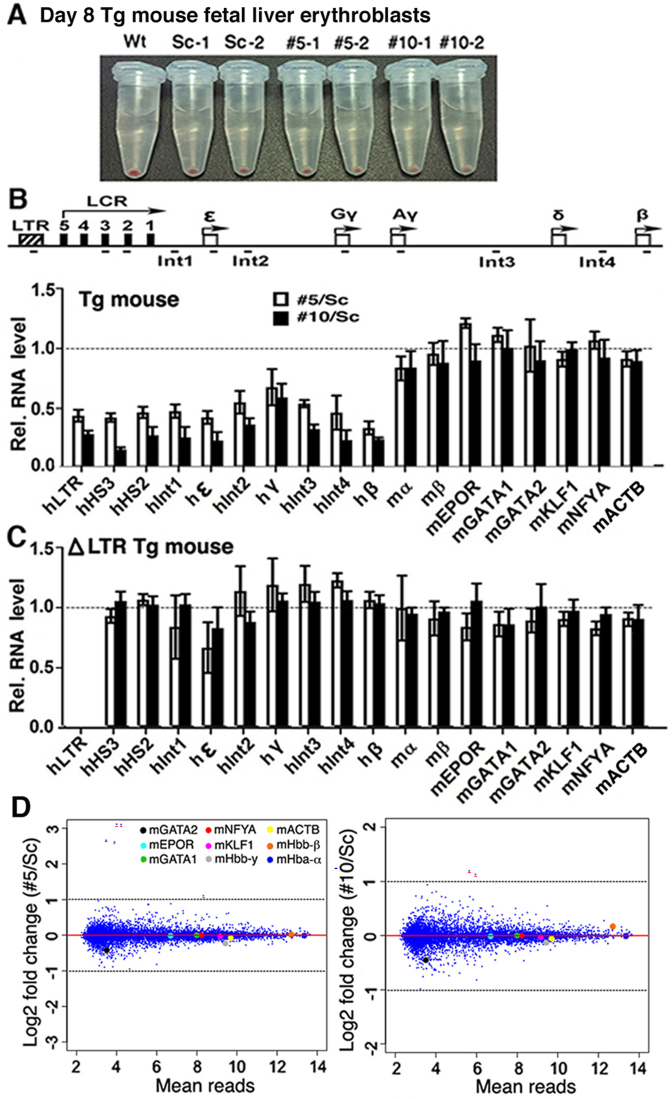
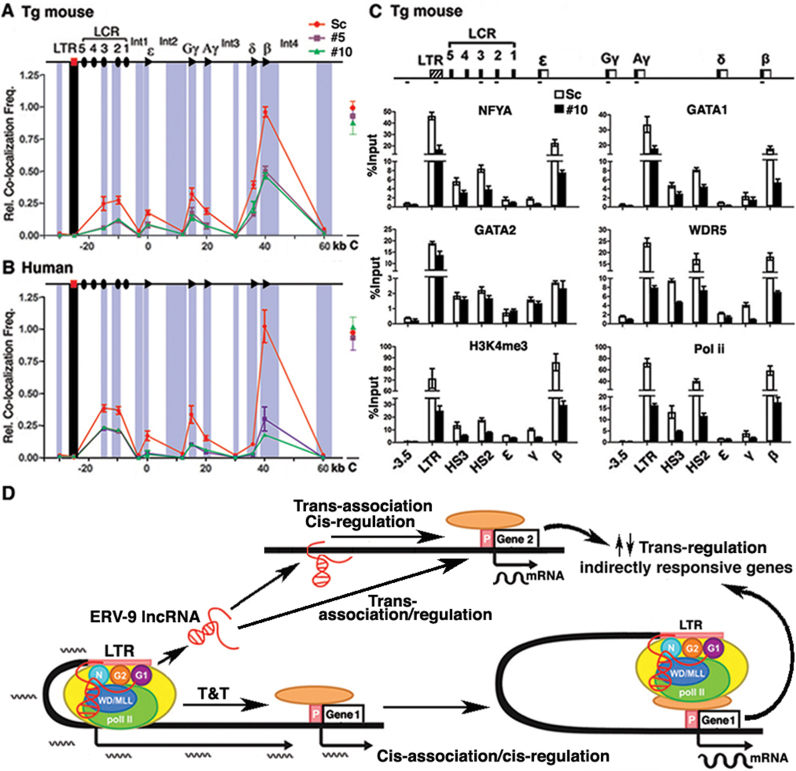
LTR retrotransposons are repetitive DNA elements comprising ∼10% of the human genome. However, LTR sequences are disproportionately present in human long, non-coding RNAs (lncRNAs). Whether and how the LTR lncRNAs serve biological functions are largely unknown. Here we show that in primary human erythroblasts, lncRNAs transcribed from the LTR retrotransposons of ERV-9 human endogenous retrovirus activated transcription of key erythroid genes and modulated ex vivo erythropoiesis. To dissect the functional mechanism of ERV-9 lncRNAs, we performed genome-wide RNA and ChIRP analyses before and after global knockdown or locus-specific deletion of ERV-9 lncRNAs in human erythroblasts carrying ∼4000 copies of the ERV-9 LTRs and in transgenic mouse erythroblasts carrying a single copy of the primate-specific ERV-9 LTR in the 100 kb human β-globin gene locus. We found that ERV-9 lncRNAs acted in cis to stabilize assembly of the ERV-9 LTR enhancer complex and facilitate long-range LTR enhancer function in activating transcription of downstream, cis-linked globin genes. Our findings suggested that LTR lncRNAs transcribed from many of the 4000 copies of ERV-9 LTR retrotransposons acted by a similar cis mechanism to modulate LTR enhancer function in activating transcription of downstream genes critical to cellular processes including erythropoiesis.


Figures

Figure 1.
Figure 1.
Depletion of ERV-9 lncRNAs suppressed transcription of key erythroid genes and impaired ex vivo erythropoiesis. (A) Top: map of the human β-globin gene locus. Hatched box: ERV-9 LTR; angled arrows: direction of transcription of ERV-9 LTR lncRNAs, LCR (locus control region) and globin genes. E: LTR enhancer; P: LTR promoter. Boxes 1, 2, 3 and 4: enhancer subunits 1–4 (see Supplementary Figure S1). (B) Culture scheme of D13 erythroblasts from human CD34+ stem/progenitor cells. (C) Images of Day 13 erythroblasts transduced in duplicates with scrambled, #10 and #5 shRNAs; 0, non-transduced D13 erythroblasts. (D) Day 13 cells transduced by scrambled and #10 shRNAs analyzed by FACS with early hematopoietic stem cell markers CD34 and CD45 and erythroid markers, transferrin receptor (CD71) and glycophorin A (CD235a). (E) qRT-PCR. LTRs (genome): genome-wide ERV-9 LTR RNAs; LTR (β-locus): β-globin ERV-9 lncRNAs. #5/Sc and #10/Sc: RNA levels of genes in D13 cells transduced with #5 or #10 shRNAs relative to those of the genes in cells transduced with scrambled shRNA, which were set at 1, as marked by the dotted horizontal line. Relative RNA levels were mean ± SEM of three RNA samples isolated from three independently transduced Day 13 cells.
Figure 2.
Figure 2.
Transcriptome analysis of transduced Day 13 erythroblasts by whole genome RNA-seq. (A) first panel: scatter-plot: number of ERV-9 LTRs whose RNA levels were up- (in green) or downregulated (in red) by >2-fold due to ERV-9 lncRNA KD by #10 shRNA. FPKM: fragments per kilobase per million reads. Row of dots at bottom: ERV-9 lncRNAs, whose FPKMs were reduced to 0 by shRNA KD. Second panel: scatter-plot: Genes whose RNA levels were up- (in green) or downregulated (in red) by >2× due to #10 shRNA. Third panel: volcano plot of data in second panel. Genes to the left and right of the double vertical lines were respectively down- and upregulated by >2×. Genes above the horizontal line had >2× changes with P-values ≤0.05. Fourth panel: hematopoietic and erythroid genes whose #5/Sc log fold changes (Y-axis) were plotted versus #10/Sc log fold changes (X- axis). Genes in blue in the upper right and lower left quadrants were up- or downregulated by both #5 and 10 shRNAs; genes in red in the upper left and lower right quadrants were differently up- or downregulated by the shRNAs and were off-targets of the shRNAs (Supplementasry File S1). (B) Transcription profiles of human β-globin locus in Day 13 erythroblasts transduced with Sc, #5 and #10 shRNAs. Coordinates in megabases (Mb) were from tip of the short arm of chromosome 11. φβ: pseudo β-globin gene. (C) Box plots of normalized RNA sequence reads of key erythroid genes. Top and bottom of boxes: first and third quartiles of the FPKM values; whiskers: minimum and maximum FPKM values; horizontal bars, medium FPKM values. K and M: RPKM in thousands and millions respectively. P-values shown above the boxes were from paired, one tailed t-tests; for the other boxes: P-values were <2e-4 and not shown.
Figure 3.
Figure 3.
Depletion of ERV-9 lncRNA suppressed transcription of the human globin transgenic locus but not of mouse genes in Day 8 Tg FL erythroblasts. (A) Images of transduced Day 8 Tg FL erythroblasts. Annotations: same as Figure 1C; Wt, non-transduced Day 8 FL erythroblasts of wild-type mouse. (B and C) qRT-PCR of RNAs from Day 8 Tg FL erythroblasts (line #7) and ΔLTR (line #7). Bars under map: locations of PCR primer pairs. Prefixes h and m: human or mouse genes. Normalization of RT-PCR products were as in Figure 1D. Relative RNA levels, #5/Sc and #10/sc, were mean±SEM of three independently transduced cells. qRT-PCRs of an independent Tg line #16 (see Supplementary Figure S3B). (D) RNA analysis by microarrays. Y axis: Log2 fold change (fc) of #5/Sc and #10/Sc. X axis: mean sequence reads of each gene from reads of the gene in #5-, #10- & Sc- transduced Day 8 cells; numbers were exponents on a base of 2. Colored dots: log2 fold change of key mouse erythroid genes. The 5 and 2 genes with log2 fc>1 marked by red bars were upregulated due to off-target effects, as they were different genes with diverse mean sequence reads and were not commonly up-regulated by both shRNAs.
Figure 4.
Figure 4.
Occupancy profiles of ERV-9 lncRNAs in Tg mouse and human erythroblasts. (A) Locations of ChIRP probes and of primer pairs for ChIRP-qPCRs. −3.5: DNA site at 3.5 kb 5΄ of the ERV-9 LTR. (B) Yield of ERV-9 lncRNA pulled down by ChIRP in Day 8 Tg FL erythroblasts. Amount of ERV-9 lncRNAs in input chromatin was set at 100%. Results were averages of two independent assays. (C) ChIRP-qPCR of pulled down chromatin DNA in Day 8 Tg FL erythroblasts. Level of PCR product from input DNA was set at 100. Values were mean±SEM of three independent assays. (D) Levels of ERV-9 lncRNA occupancies throughout the mouse genome and the human β-globin transgenic locus in 1 kb tiling of 100 kb DNA segments in Tg spleen erythroblasts (line #7). Log2_fold enrichment (fe) = log2 FPKM of DNA pulled down by the merged Odd and Even probes/FPKM of the same DNA segment in Input DNA. Vertical lines: log2_fe of human β-globin and mouse α- and β-globin gene loci. (E and F) ERV-9 lncRNA occupancy profiles at the human and mouse β-globin loci locus in Tg spleen erythroblasts and at human β-globin and NFYA locus in D13 human erythroblasts. Y axis: Normalized sequence reads of chromatin DNAs pulled down by the merged Odd and Even probes. (see http://ccc.gru.edu/tuan/erv9.chirpseq; ID: dorothytuan; password: tuanchoihu).
Figure 5.
Figure 5.
Locus-specific deletion of ERV-9 LTR/lncRNAs: ERV-9 lncRNAs transcribed from β-globin ERV-9 LTR associated and regulated in cis the transcription of downstream globin genes; ERV-9 lncRNAs also associated in trans and regulated either in cis or in trans the transcription of some unlinked genes. (A) Strategy for locus-specific deletion of ERV-9 LTR from β-globin gene locus by CRISPR-cas9 to generate clonal ΔLTR lines (see ‘Materials and Methods’ section). (B) Confirmation of ΔLTR clonal lines containing homozygous deletion of the ERV-9 LTR from β-globin gene locus by Sanger sequencing of PCR amplified DNA fragments spanning the ERV-9 LTR in Wt and ΔLTR clonal lines aligned with the sequence of the donor template. (C) qRT-PCR analysis of total cellular RNAs isolated from ΔLTR clonal lines #2, 6 and 8. Dotted line: RNA levels in Wt K562 cells serving as reference and set at 1. Values were mean of triplicate RT-PCR reactions. (D) Genome-wide RNA analysis by microarrays: Scatter plots of genes up- and downregulated by deletion of ERV-9 LTR and lncRNAs from β-globin locus: (clone #8, not shown). Dotted horizontal lines: Log2 fold change of +1 or −1, marking up- or downregulation by 2×. Colored dots: key erythroid genes. Other designations: same as Figure 3D. (E) Venn diagrams of commonly up- and downregulated genes in the 3 ΔLTR clones: 2 of 8 commonly upregulated genes and 10 of 14 commonly downregulated genes—3 globin genes and 7 other genes–have cis-linked ERV-9 LTRs within 300 kb of the genes (Supplementary Table S2). (F) Microarrays analysis of key erythroid genes in the 3 ΔLTR clones: Y axis: mean RNA levels of #2, 6 and 8 LTR deletion clones relative to those of Wt K562 cells, which were set at 1 as marked by the dotted horizontal line.
Figure 6.
Figure 6.
Depletion of ERV-9 lncRNAs destabilized assembly of the ERV-9 LTR enhancer complex and reduced looping frequencies of the LTR enhancer with the downstream gene locus; model of ERV-9 lncRNA function. (A) and (B) 3C assays of Day 8 Tg FL erythroblasts (line #7) and Day 13 human erythroblasts. Vertical colored bars: DNA fragments generated by Ase I cleavage; black bar: Ase I fragment spanning ERV-9 LTR, 3C anchor fragment. Looping frequency between the ERV-9 LTR and β-globin gene was set at 1; values were mean±SEM of three independent 3C assays. (C) Control co-localization frequency of mouse HS2-mouse β-globin gene in Tg erythroblasts and of human β-actin locus, first exon-last exon in human erythroblasts. C: ERV-9 lncRNA KD reduced occupancies of TFs on the ERV-9 LTR and the LCR and globin genes in Day 8 Tg erythroblasts (line #7). Bars under map: locations of ChIP-qPCR primer pairs. ChIP values were averages of two independent assays. (D) Model of ERV-9 lncRNA function: Lower graph: cis-association and cis-regulation. ERV-9 lncRNA transcribed from the ERV-9 LTR interacted with NF-Y (N), GATA-1 (G1), WDR5/MLL2 (WD/MLL) and pol II to assemble the LTR enhancer complex (Yellow oval) and tethered the LTR complex to downstream DNA sites and by a cis T&T mechanism through the intergenic DNAs to ultimately loop with the target gene. Squiggles: intergenic RNAs transcribed by the LTR enhancer complex and mRNA transcribed by the promoter complex (orange oval) of the cis-linked gene. Top graph: trans-association and trans- or cis-regulation. ERV-9 lncRNA dissociated from its LTR DNA template could associate in trans and regulate either in trans the transcription of unlinked genes loci or in cis the transcription of unlinked gene loci with nearby ERV-9 LTRs. Direct-responsive Genes 1 and 2–their RNA and protein products–in turn could up- or downregulate in trans the indirect-responsive genes without cis-linked ERV-9 LTRs.

Similar articles

Cited by

References

    1. Henikoff S., Greene E.A., Pietrokovski S., Bork P., Attwood T.K., Hood L.. Gene families: the taxonomy of protein paralogs and chimeras. Science. 1997; 278:609–614. - PubMed
    1. Lander E.S., Linton L.M., Birren B., Nusbaum C., Zody M.C., Baldwin J., Devon K., Dewar K., Doyle M., FitzHugh W. et al. . Initial sequencing and analysis of the human genome. Nature. 2001; 409:860–921. - PubMed
    1. Sela N., Mersch B., Gal-Mark N., Lev-Maor G., Hotz-Wagenblatt A., Ast G.. Comparative analysis of transposed element insertion within human and mouse genomes reveals Alu's unique role in shaping the human transcriptome. Genome Biol. 2007; 8:R127. - PMC - PubMed
    1. Kelley D.R., Rinn J.L.. Transposable elements reveal a stem cell specific class of long noncoding RNAs. Genome Biol. 2012; 13:R107. - PMC - PubMed
    1. Jern P., Coffin J.. Effects of retrotransposons on host genome function. Annu. Rev. Genet. 2008; 42:709–732. - PubMed

Publication types

MeSH terms