

5-aminolevulinic acid combined with ferrous ion reduces adiposity and improves glucose tolerance in diet-induced obese mice via enhancing mitochondrial function
- PMID: 28132645
- PMCID: PMC5278573
- DOI: 10.1186/s40360-016-0108-3
5-aminolevulinic acid combined with ferrous ion reduces adiposity and improves glucose tolerance in diet-induced obese mice via enhancing mitochondrial function
Abstract
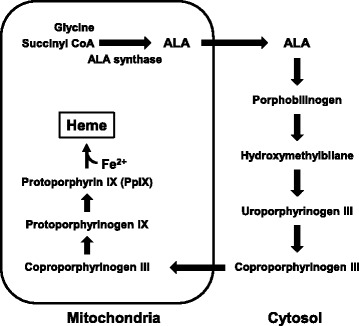
Background: Mitochondrial dysfunction is associated with obesity and various obesity-associated pathological conditions including glucose intolerance. 5-Aminolevulinic acid (ALA), a precursor of heme metabolites, is a natural amino acid synthesized in the mitochondria, and various types of cytochromes containing heme contribute to aerobic energy metabolism. Thus, ALA might have beneficial effects on the reduction of adiposity and improvement of glucose tolerance through its promotion of heme synthesis. In the present study, we investigated the effects of ALA combined with sodium ferrous citrate (SFC) on obesity and glucose intolerance in diet-induced obese mice.
Methods: We used 20-weeks-old male C57BL/6J diet-induced obesity (DIO) mice that had been fed high-fat diet from 4th week or wild-type C57BL/6J mice. The DIO mice were orally administered ALA combined with SFC (ALA/SFC) for 6 weeks. At the 4th and 5th week during ALA/SFC administration, mice were fasted for 5 h and overnight, respectively and used for oral glucose tolerance test. After the ALA/SFC administration, the plasma glucose levels, weight of white adipose tissue, and expression levels of mitochondrial oxidative phosphorylation (OXPHOS) complexes were examined. Furthermore, the effects of ALA/SFC on lipid content and glucose uptake were examined in vitro.
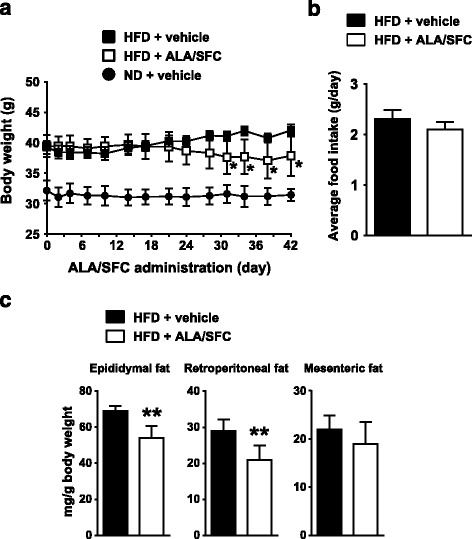
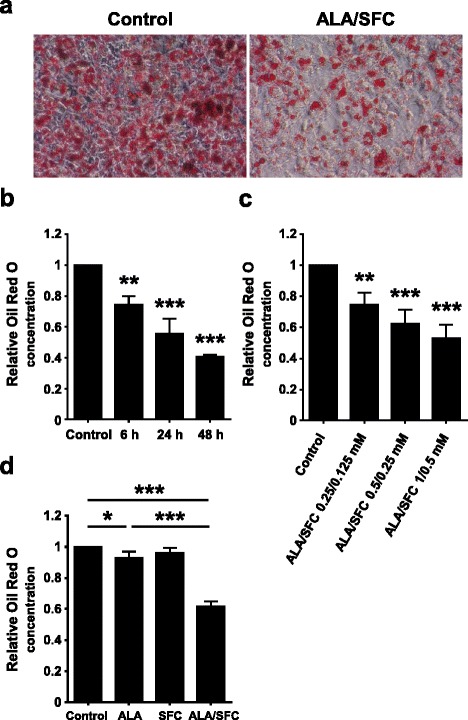
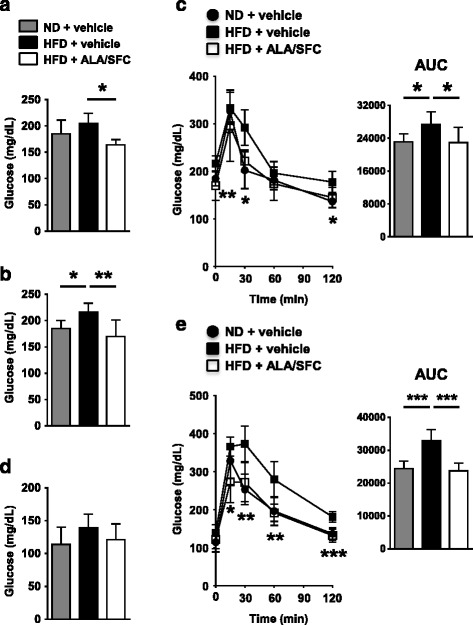
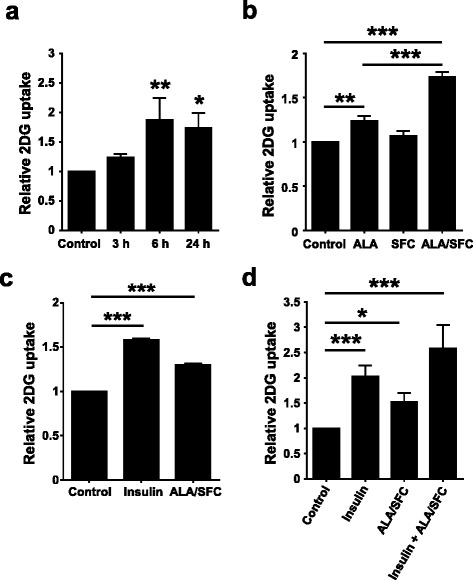
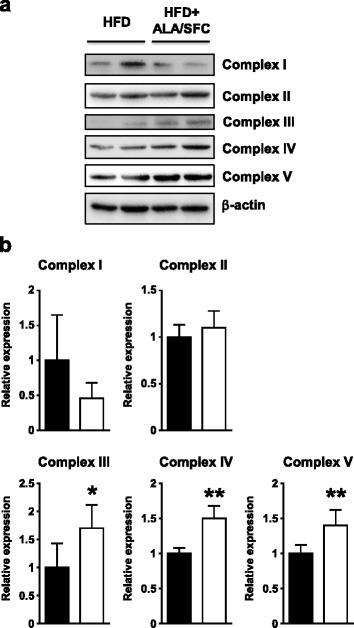
Results: Oral administration of ALA/SFC for 6 weeks reduced the body weight by about 10% and the weight of white adipose tissues in these animals. In vitro, ALA/SFC reduced lipid content in mouse 3T3-L1 adipocytes in a dose dependent manner, and enhanced glucose uptake in 3T3-L1 adipocytes by 70-90% and rat L6 myoblasts by 30% at 6 h. Additionally, oral administration of ALA/SFC reduced plasma glucose levels and improved glucose tolerance in DIO mice. Furthermore, ALA/SFC enhanced the expression of OXPHOS complexes III, IV, and V by 40-70% in white adipose tissues of DIO mice, improving mitochondrial function.
Conclusions: Our findings indicate that ALA/SFC is effective in the reduction of adiposity and improvement of glucose tolerance, and that the induction of mitochondrial OXPHOS complex III, IV, and V by ALA/SFC might be an essential component of the molecular mechanisms underlying these effects. ALA/SFC might be a useful supplement for obesity and obesity-related metabolic disease such as type 2 diabetes mellitus.
Keywords: 5-aminolevulinic acid; Diet-induced obese mice; Glucose tolerance; Glucose uptake; Mitochondrial oxidative phosphorylation complex; Obesity; White adipose tissue.
Figures
Similar articles
-
Combination of 5-aminolevulinic acid and ferrous ion reduces plasma glucose and hemoglobin A1c levels in Zucker diabetic fatty rats.FEBS Open Bio. 2016 Apr 29;6(6):515-28. doi: 10.1002/2211-5463.12048. eCollection 2016 Jun. FEBS Open Bio. 2016. PMID: 27239432 Free PMC article.
-
Sodium ferrous citrate and 5-aminolevulinic acid improve type 2 diabetes by maintaining muscle and mitochondrial health.Obesity (Silver Spring). 2023 Apr;31(4):1038-1049. doi: 10.1002/oby.23705. Epub 2023 Feb 23. Obesity (Silver Spring). 2023. PMID: 36823345
-
A single-arm, open-label, intervention study to investigate the improvement of glucose tolerance after administration of the 5-aminolevulinic acid (5-ALA) in the patients with mitochondrial diabetes mellitus.Medicine (Baltimore). 2021 Mar 12;100(10):e25100. doi: 10.1097/MD.0000000000025100. Medicine (Baltimore). 2021. PMID: 33725905 Free PMC article.
-
Therapeutic potential of 5-aminolevulinic acid in metabolic disorders: Current insights and future directions.iScience. 2024 Nov 26;27(12):111477. doi: 10.1016/j.isci.2024.111477. eCollection 2024 Dec 20. iScience. 2024. PMID: 39720526 Free PMC article. Review.
-
Putative role of adipose tissue in growth and metabolism of colon cancer cells.Front Oncol. 2014 Jun 26;4:164. doi: 10.3389/fonc.2014.00164. eCollection 2014. Front Oncol. 2014. PMID: 25019059 Free PMC article. Review.
Cited by
-
5-Aminolevulinic acid/sodium ferrous citrate enhanced the antitumor effects of programmed cell death-ligand 1 blockade by regulation of exhausted T cell metabolism in a melanoma model.Cancer Sci. 2021 Jul;112(7):2652-2663. doi: 10.1111/cas.14930. Epub 2021 May 22. Cancer Sci. 2021. PMID: 33934440 Free PMC article.
-
5-Aminolevulinic acid bypasses mitochondrial complex I deficiency and corrects physiological dysfunctions in Drosophila.Hum Mol Genet. 2023 Aug 7;32(16):2611-2622. doi: 10.1093/hmg/ddad092. Hum Mol Genet. 2023. PMID: 37364055 Free PMC article.
-
Pilot Trial on the Effect of 5-Aminolevulinic Acid on Glucose Tolerance in Patients with Maternally Inherited Diabetes and Deafness.Diabetes Ther. 2023 Feb;14(2):447-459. doi: 10.1007/s13300-022-01335-8. Epub 2022 Nov 22. Diabetes Ther. 2023. PMID: 36418716 Free PMC article.
-
5-Aminolevulinic Acid Attenuates Atherosclerotic Plaque Progression in Low-Density Lipoprotein Receptor-Deficient Mice by Heme Oxygenase-1 Induction.Circ Rep. 2019 Dec 12;2(1):60-68. doi: 10.1253/circrep.CR-19-0089. Circ Rep. 2019. PMID: 33693175 Free PMC article.
-
5-Aminolevulinic acid combined with sodium ferrous citrate mitigates effects of heat stress on bovine oocyte developmental competence.J Reprod Dev. 2022 Aug 1;68(4):271-277. doi: 10.1262/jrd.2021-145. Epub 2022 Jun 15. J Reprod Dev. 2022. PMID: 35705297 Free PMC article.
References
MeSH terms
Substances
LinkOut - more resources
Full Text Sources
Other Literature Sources
Medical
