. 2017 Feb 2;100(2):297-315.
doi: 10.1016/j.ajhg.2017.01.005. Epub 2017 Jan 26.

Neurocalcin Delta Suppression Protects against Spinal Muscular Atrophy in Humans and across Species by Restoring Impaired Endocytosis

Affiliations

Neurocalcin Delta Suppression Protects against Spinal Muscular Atrophy in Humans and across Species by Restoring Impaired Endocytosis

Markus Riessland et al. Am J Hum Genet. .

Abstract

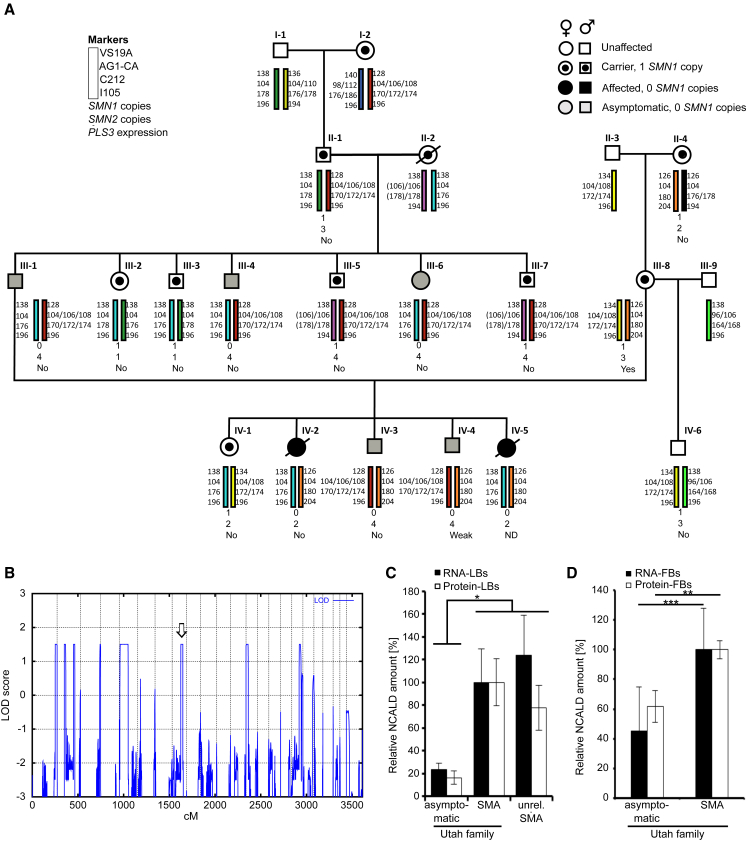
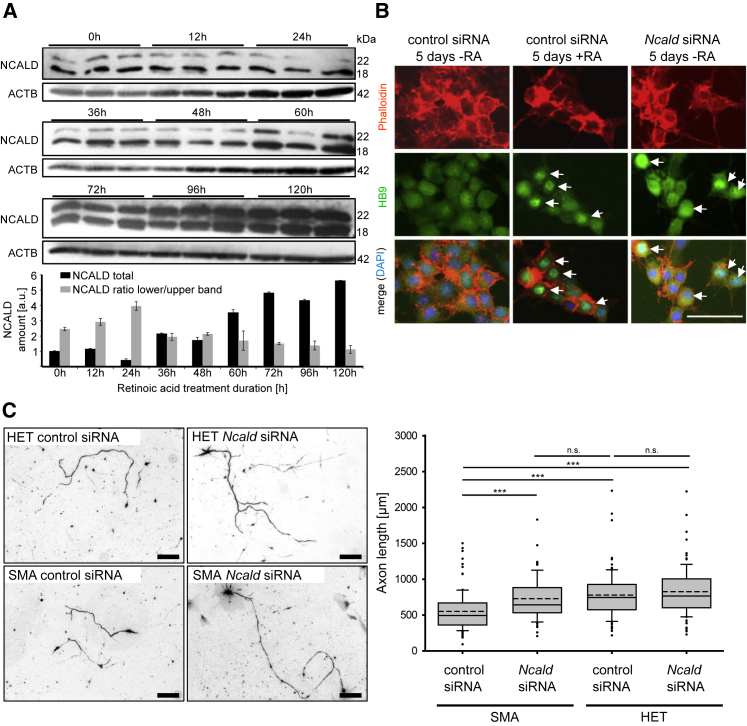
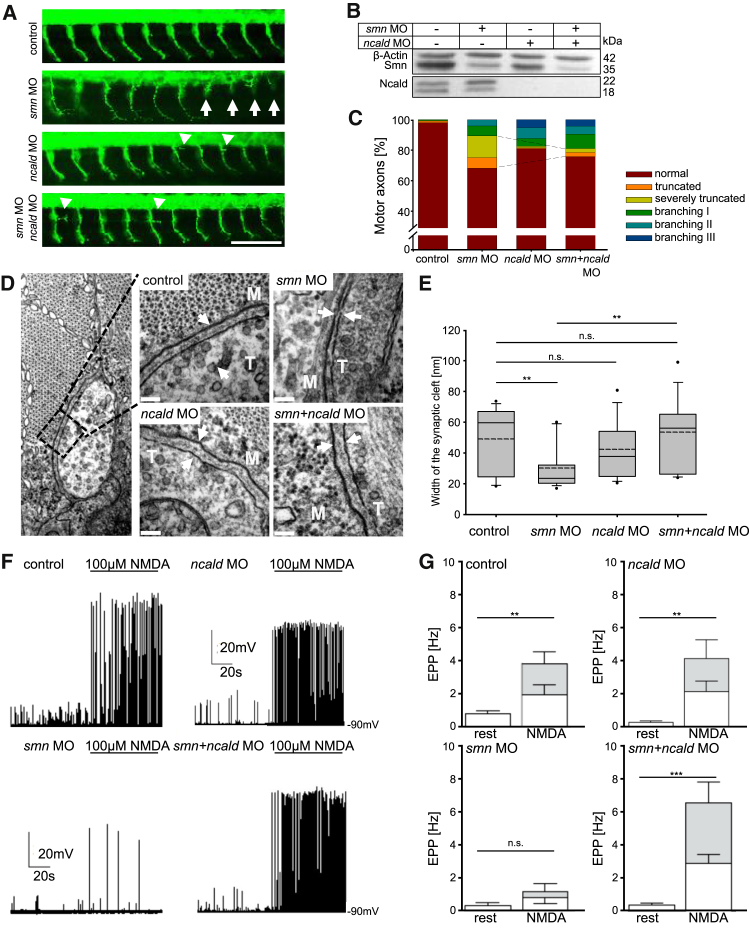
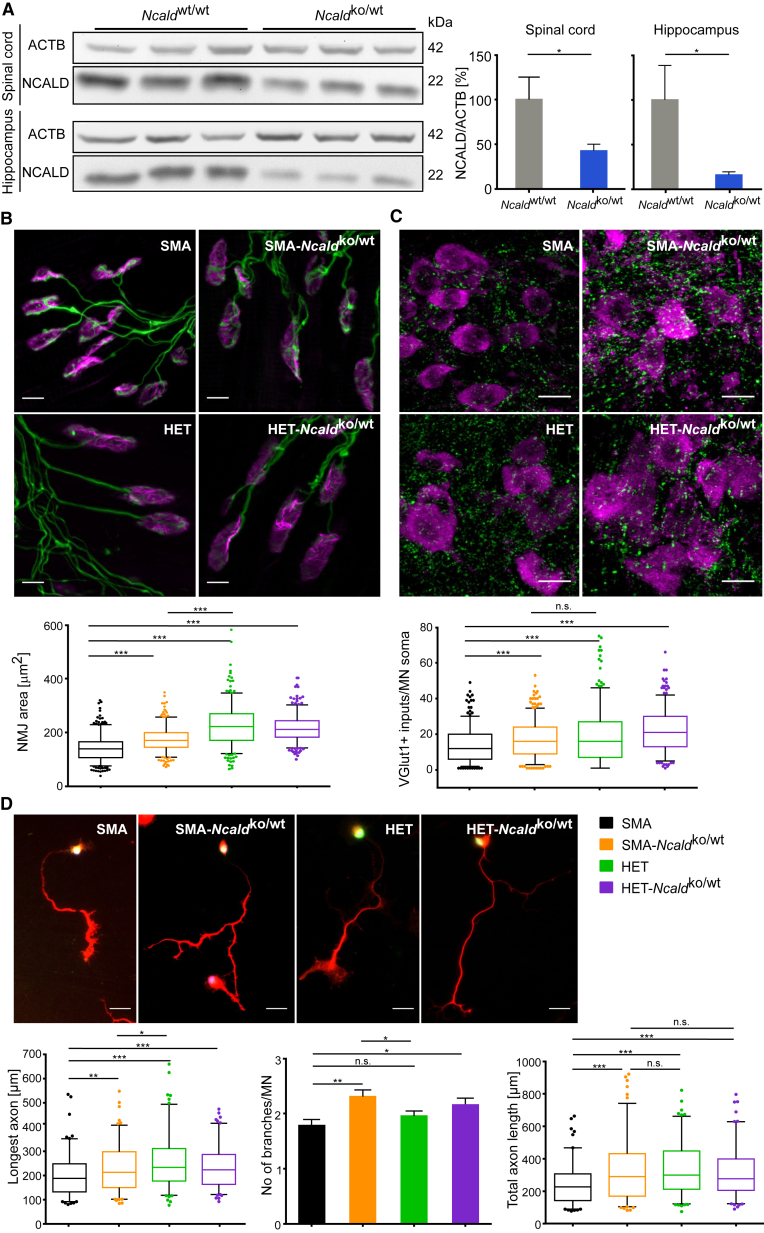
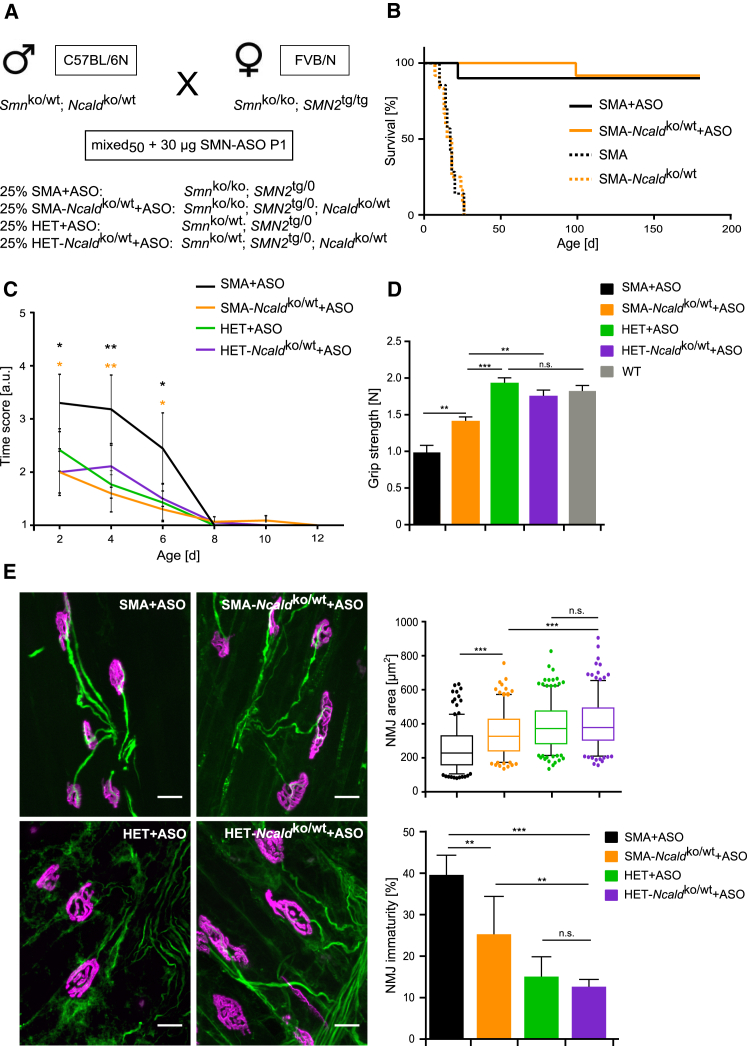
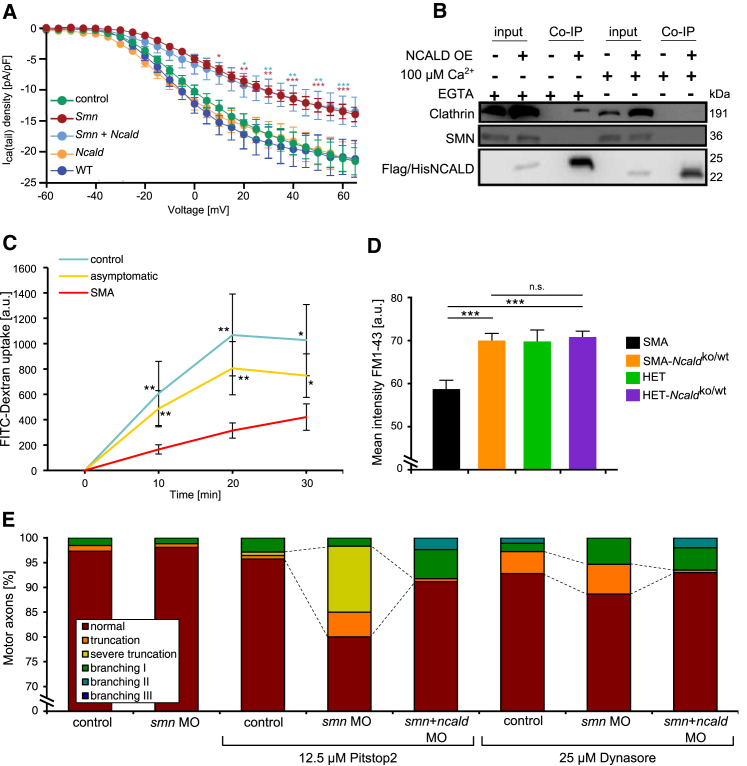
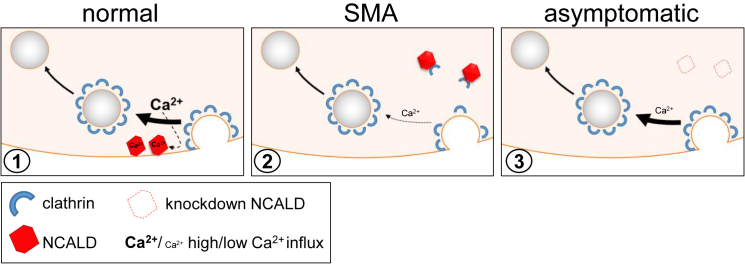
Homozygous SMN1 loss causes spinal muscular atrophy (SMA), the most common lethal genetic childhood motor neuron disease. SMN1 encodes SMN, a ubiquitous housekeeping protein, which makes the primarily motor neuron-specific phenotype rather unexpected. SMA-affected individuals harbor low SMN expression from one to six SMN2 copies, which is insufficient to functionally compensate for SMN1 loss. However, rarely individuals with homozygous absence of SMN1 and only three to four SMN2 copies are fully asymptomatic, suggesting protection through genetic modifier(s). Previously, we identified plastin 3 (PLS3) overexpression as an SMA protective modifier in humans and showed that SMN deficit impairs endocytosis, which is rescued by elevated PLS3 levels. Here, we identify reduction of the neuronal calcium sensor Neurocalcin delta (NCALD) as a protective SMA modifier in five asymptomatic SMN1-deleted individuals carrying only four SMN2 copies. We demonstrate that NCALD is a Ca2+-dependent negative regulator of endocytosis, as NCALD knockdown improves endocytosis in SMA models and ameliorates pharmacologically induced endocytosis defects in zebrafish. Importantly, NCALD knockdown effectively ameliorates SMA-associated pathological defects across species, including worm, zebrafish, and mouse. In conclusion, our study identifies a previously unknown protective SMA modifier in humans, demonstrates modifier impact in three different SMA animal models, and suggests a potential combinatorial therapeutic strategy to efficiently treat SMA. Since both protective modifiers restore endocytosis, our results confirm that endocytosis is a major cellular mechanism perturbed in SMA and emphasize the power of protective modifiers for understanding disease mechanism and developing therapies.

Keywords: NCALD; PLS3; SMA; SMN1; SMN2; asymptomatic; endocytosis; genetic modifier; incomplete penetrance; neuronal sensor protein; spinal muscular dystrophy.


Figures

Figure 1
Figure 1
Genome-wide Linkage and Transcriptome Analysis Uncovered NCALD as Candidate Modifier of SMA (A) Pedigree of the Utah family: haplotype analysis of microsatellite markers in the 5q13 SMA region and SMN1 and SMN2 copies are indicated. Black filled symbols indicate SMA-affected individuals; gray filled symbols indicate asymptomatic SMN1-deleted individuals; and symbols with a dot indicate SMA carriers. Quantification of PLS3 expression in LBs was done according to Oprea et al. Note that weak PLS3 have no impact on SMA phenotype. (B) Genome-wide linkage analysis identified eight regions with positive LOD scores. Open arrow marks 8q22.3 region containing NCALD. (C) Verification of microarray results (Table S2) of NCALD RNA and protein in lymphoblastoid (LB) cells (NCALD levels are relative to NCALD in SMA-affected individuals of the Utah family [set to 100%]). NCALD is represented by two independent probes on the expression array, showing a 4- to 5-fold downregulation in the asymptomatic group versus familial type 1 SMA or an independent type 3 SMA group. Three independent experiments including all 17 cell lines (asymptomatic, n = 5; symptomatic, n = 2; independent SMA-III, n = 10) were performed. Error bars indicate SD; p ≤ 0.05. (D) Expression analysis of NCALD RNA and proteins in fibroblasts (FB) derived from the Utah family (asymptomatic, n = 5; symptomatic, n = 2). Three independent experiments including all seven cell lines were performed. Error bars indicate SD; ∗∗p ≤ 0.01; ∗∗∗p ≤ 0.001.
Figure 2
Figure 2
NCALD Downregulation Restores Neurite Outgrowth Defect in SMN-Deficient Neuronal Cells (A) Western blot of NSC34 cells treated with 1 μM retinoic acid (RA) for 0–120 hr as a model of MN differentiation and maturation (n = 3 independent experiments). Error bars indicate SEM. (B) Ncald siRNA-treated NSC34 cells show signs of MN differentiation (HB9-positive staining, marked with white arrows) even in absence of RA (right). As positive control, cells were differentiated with RA and treated with control siRNA (middle). Negative control was treated only with control siRNA (left). Scale bar represents 100 μm. (C) Primary MNs from SMA or HET murine embryos were fixed at 8 DIV and stained with anti-neurofilament M (anti NF-M). Quantitative analysis of axon length of MNs. SMA: n = 7, HET: n = 6, n = 100 per measurement; ∗∗∗p ≤ 0.001; dashed line indicates mean; straight line indicates median; values covered from 25%–75% and dotted outliers at <5% and >95% CI. Scale bars represent 100 μm.
Figure 3
Figure 3
Ncald Reduction Corrects the Phenotype in Smn-Deficient Zebrafish (A) First 10 motor axons posterior to the yolk globule of 34 hpf zebrafish embryos injected with respective morpholinos (MO). White arrows mark truncated motor axons. Arrowheads mark extensive branching in ncald or smn+ncald morphants; green shows Znp1 staining, for motor axons. Scale bar represents 100 μm. (B) Western blot of lysates of zebrafish embryos injected with indicated MO. (C) Quantification of motor axon phenotype. Dashed lines mark the rescue of the truncation phenotype (∗∗p ≤ 0.01). smn+ncald and ncald morphants showed increased branching. n > 500 motor axons per MO injection. (D) TEM images of NMJs of 48 hpf zebrafish embryos injected with respective MO. White arrows mark synaptic clefts including basal lamina. M indicates muscle fiber, T indicates nerve terminal. Scale bars represent 100 nm. (E) Quantification of synaptic cleft width of MO-injected 48 hpf fish (n = 15 per treatment). ∗∗p ≤ 0.01, dashed line indicates mean; straight line indicates median; values covered 24%–75% and dotted outliers at <5% and >95% CI. (F and G) Whole-cell current clamp recordings EPPs (F) and quantification (G) of mean EPP frequencies in ventral fast muscle cells of control (n = 12), smn (n = 10), ncald (n = 11), and smn+ncald (n = 12) morphants under control conditions or NMDA induction. White bar parts reflect the mEPP frequencies, gray bar parts reflect the frequency of the TTX-sensitive large EPPs. ∗∗p ≤ 0.01; ∗∗∗p ≤ 0.001. Error bars indicate SEM.
Figure 4
Figure 4
Heterozygous Ncald KO Improves Axonal Outgrowth, Proprioceptive Input, and NMJ Size in Severe SMA Mice (A) Western blot and quantification of NCALD and ACTB (loading control) in spinal cord and hippocampus of P10 WT and Ncaldko/wt mice. p ≤ 0.05. Error bars indicate SD. (B) Representative images and quantification of NMJ area (μm2) in TVA muscle from P10 mice stained with antibodies against NF-M and SV2 (green, for presynaptic terminals) and Bungarotoxin (magenta, for postsynapse). NMJ area was analyzed with ImageJ software (N = 3, n = 100–120 NMJs/mouse). ∗∗∗p ≤ 0.001. Scale bars represent 10 μm. (C) Representative images and quantification of proprioceptive inputs (VGLUT1, green) on MN soma (CHAT, magenta) in lumbar spinal cord sections from P10 mice. Mean input number within 5 μm of MN soma was analyzed (N = 3, n = 100–120 MNs/mouse). ∗∗∗p ≤ 0.001. Scale bars represent 25 μm. Note, color code for genotypes is identical to (D). (D) Representative merged images of 6 DIV MNs isolated from E13.5 embryos and stained with DAPI (blue, for DNA) and antibodies against HB9 (green, for MN) and Tau (red, for axon). The longest axon and axonal branches were quantified with ImageJ (N = 3–5, n = 20–40 axons per mouse). Scale bars represent 25 μm. Each boxplot covers values from 25%–75% with line at median and dotted outliers at <5% and >95% CI. For each experiment, image analysis was double-blinded. n.s. indicates non-significant; p ≤ 0.05; ∗∗p ≤ 0.01; ∗∗∗p ≤ 0.001.
Figure 5
Figure 5
NCALD Reduction Improves Motoric Function, NMJ Size, and NMJ Architecture in SMA+ASO Mice (A) Breeding scheme to produce mixed50 SMA and HET mice. All mixed50 offspring were injected with 30 μg SMN-ASO at P1. (B) Kaplan-Meier curves of uninjected mixed50 mice show no differences in survival between SMA (17 days, N = 7) and SMA-Ncaldko/wt (16.5 days, N = 12). Injection of 30 μg SMN-ASO on P1 increases survival to >180 days for both SMA+ASO (N = 10) and SMA-Ncaldko/wt+ASO (N = 12) mice. (C) Righting reflex test shows improvement in SMA-Ncaldko/wt+ASO but not SMA+ASO mice during P2–P6 (n ≥ 12 per genotype). Error bars represent SEM; n.s. indicates non-significant, ∗∗p ≤ 0.01, ∗∗∗p ≤ 0.001. (D) Grip strength test performance at P73 reveals enhanced strength for SMA-Ncaldko/wt+ASO mice compared to SMA+ASO mice (N ≥ 12 per genotype). Error bars indicate SEM. p ≤ 0.05, ∗∗p ≤ 0.01, ∗∗∗p ≤ 0.001. (E) Representative images of NMJs of ASO-treated mixed50 mice at P21 stained with the antibody against NF-M (green, for presynaptic terminal) and Bungarotoxin (magenta, for postsynaptic terminal). Scale bars represent 20 μm. Boxplot shows quantification of NMJ area in μm2 in TVA muscle which was analyzed and represented as in Figure 4. Bar graph shows percentage of immature NMJs in TVA muscle (mean ± SD). N = 3 mice per genotype; n = 60–100 NMJs per mouse. n.s. indicates non-significant, p ≤ 0.05, ∗∗p ≤ 0.01, ∗∗∗p ≤ 0.001.
Figure 6
Figure 6
Interconnection between SMN, NCALD, Voltage-Dependent Ca2+ Influx, Endocytosis, and SMA (A) Measurement of I-V relations of Ca2+ tail currents in differentiated NSC34 cells treated with respective siRNAs and depolarized for 5 ms to 60 mV, in 5 mV increments, at holding potential −80 mV. Currents were not different between wild-type (n = 7), control siRNA (n = 33), and Ncald KD (n = 13) and were significantly reduced upon Smn KD (n = 15) and Smn+Ncald KD (n = 12) at current pulses above −35 mV. p ≤ 0.05; ∗∗p ≤ 0.01; ∗∗∗p ≤ 0.001. Error bars indicate SEM. (B) Western blot of co-immunoprecipitation experiment. NSC34 cells were transiently transfected with FLAG-His-NCALD or control vector. Co-immunoprecipitations with FLAG-M2 affinity beads were performed in the presence or absence of Ca2+. NCALD interacts with clathrin only in the absence of Ca2+ (addition of EGTA to the cell lysate) but not in the presence. Note the positive clathrin band in the test-Co-IP (fourth lane) in the absence but not in the presence of Ca2+ (last lane). (C) Quantification of endocytosis by FITC-dextran uptake in fibroblasts from SMA (n = 10), controls (n = 3), and asymptomatic individuals (n = 5); n = 50 per cell line and time point. Mean ± SD. p ≤ 0.05, ∗∗p ≤ 0.01. (D) Quantification of FM1-43 intensity at presynaptic terminals in TVA muscles under low-frequency stimulation (5 Hz, 1 s). n = 3 per genotype, n ≈100 per mouse. Mean ± SEM; n.s. indicates non-significant; ∗∗∗p ≤ 0.001. (E) Quantification of MN axon phenotype of zebrafish embryos treated with sub-phenotypical doses of smn MO (2 ng), ncald MO (2 ng), and the endocytosis inhibitors Pitstop2 and Dynasore, respectively. Dashed lines highlight the synergistic effect of smn MO and Pitstop2 and the effect of Dynasore on axon truncation. Additional ncald MO injection ameliorates the truncation defect. ∗∗∗p ≤ 0.001. Motor axons per treatment: Pitstop2: n ≥ 100, Dynasore: n ≥ 150.
Figure 7
Figure 7
NCALD Acts as a Ca2+-Dependent Regulator of Endocytosis in Synaptic Vesicle Recycling Diagrammatic presentation of the mode of action of NCALD in synaptic vesicle recycling in normal, SMA, and asymptomatic pre-synapse of neuronal cells. From left to right: (1) after neurotransmitter release, clathrin binds to empty vesicle membrane causing membrane bending and vesicle formation. High concentration of local Ca2+ which is present after vesicle release causes NCALD conformational change and thereby a release of clathrin so that it can perform its function. NCALD may fine-tune recycling speed and help to coordinate proper clathrin coating. (2) In SMA, voltage-dependent Ca2+ influx is reduced, decreasing NCALD-clathrin dissociation, thus inhibiting clathrin coating of vesicles. In our model NCALD regulates (increases) the Ca2+ dependence of clathrin function. (3) When NCALD level is reduced, the Ca2+ dependence is reduced too and even at relatively low intracellular Ca2+ levels, clathrin can mediate endocytosis.

References

    1. Wirth B., Garbes L., Riessland M. How genetic modifiers influence the phenotype of spinal muscular atrophy and suggest future therapeutic approaches. Curr. Opin. Genet. Dev. 2013;23:330–338. - PubMed
    1. Kaczmarek A., Schneider S., Wirth B., Riessland M. Investigational therapies for the treatment of spinal muscular atrophy. Expert Opin. Investig. Drugs. 2015;24:867–881. - PubMed
    1. Lefebvre S., Bürglen L., Reboullet S., Clermont O., Burlet P., Viollet L., Benichou B., Cruaud C., Millasseau P., Zeviani M. Identification and characterization of a spinal muscular atrophy-determining gene. Cell. 1995;80:155–165. - PubMed
    1. Wirth B. An update of the mutation spectrum of the survival motor neuron gene (SMN1) in autosomal recessive spinal muscular atrophy (SMA) Hum. Mutat. 2000;15:228–237. - PubMed
    1. Liu Q., Fischer U., Wang F., Dreyfuss G. The spinal muscular atrophy disease gene product, SMN, and its associated protein SIP1 are in a complex with spliceosomal snRNP proteins. Cell. 1997;90:1013–1021. - PubMed

Publication types

MeSH terms