. 2017 Feb 6;27(3):371-385.
doi: 10.1016/j.cub.2016.12.038. Epub 2017 Jan 26.

The ER-Mitochondria Tethering Complex VAPB-PTPIP51 Regulates Autophagy

Affiliations

The ER-Mitochondria Tethering Complex VAPB-PTPIP51 Regulates Autophagy

Patricia Gomez-Suaga et al. Curr Biol. .

Abstract

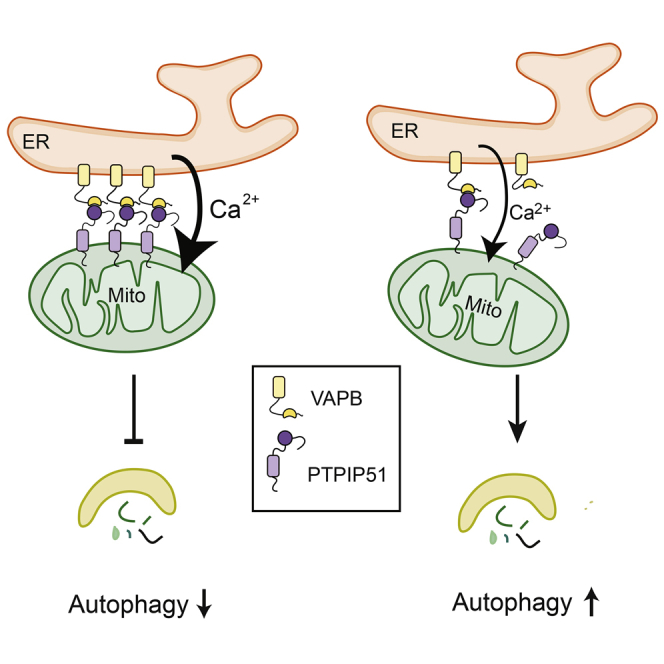
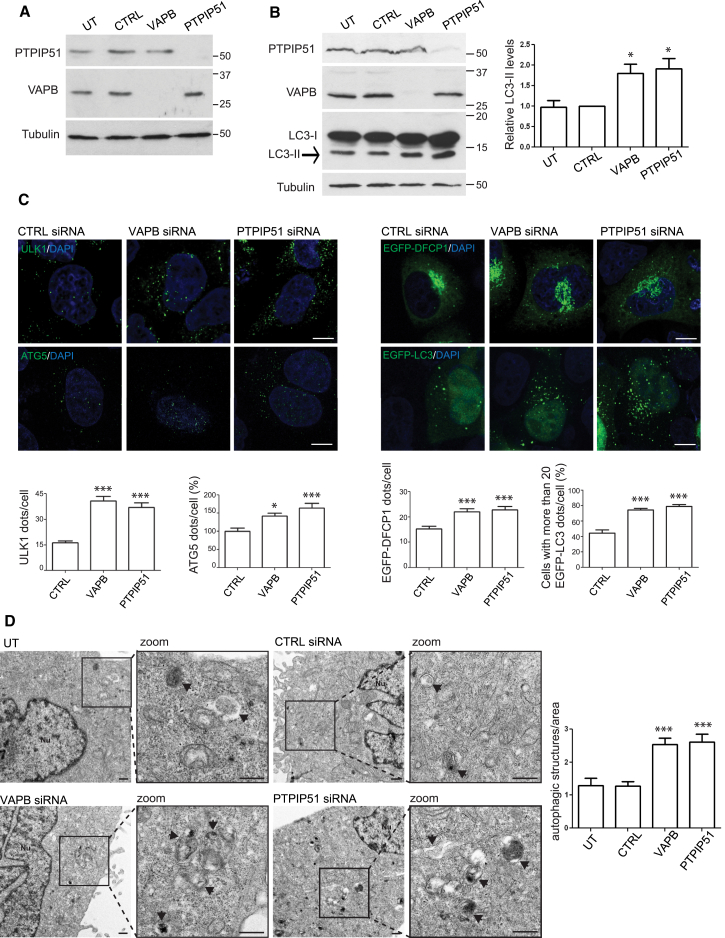
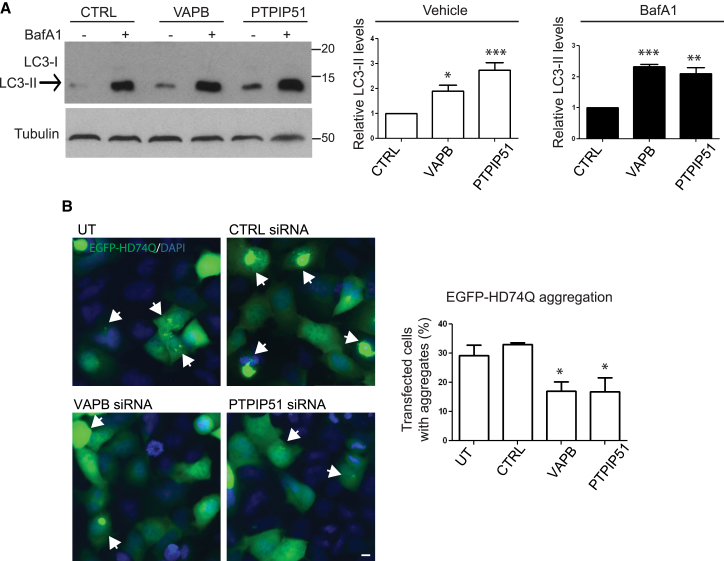
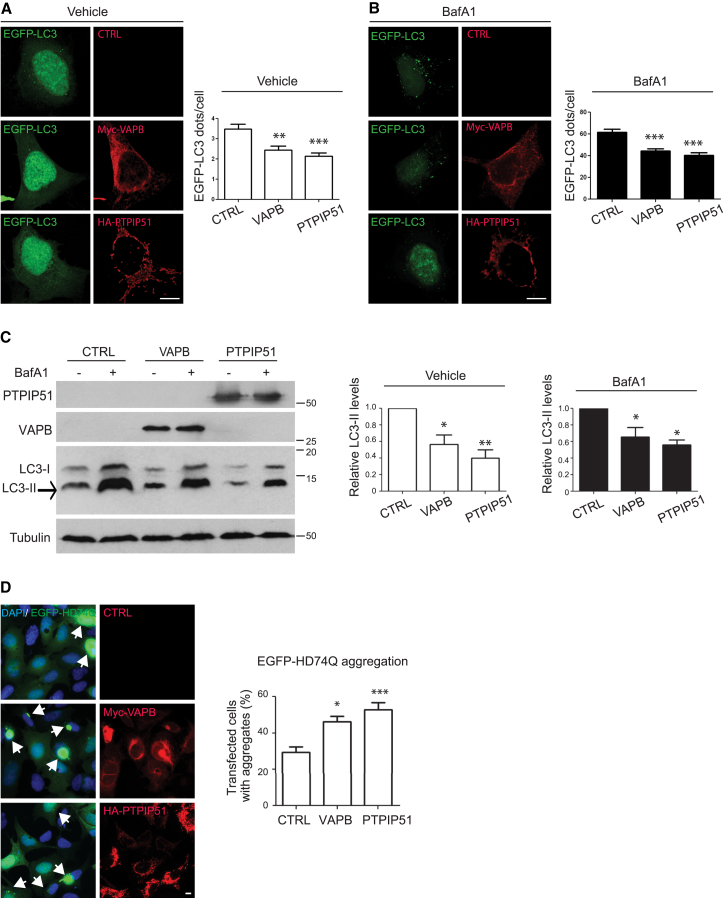
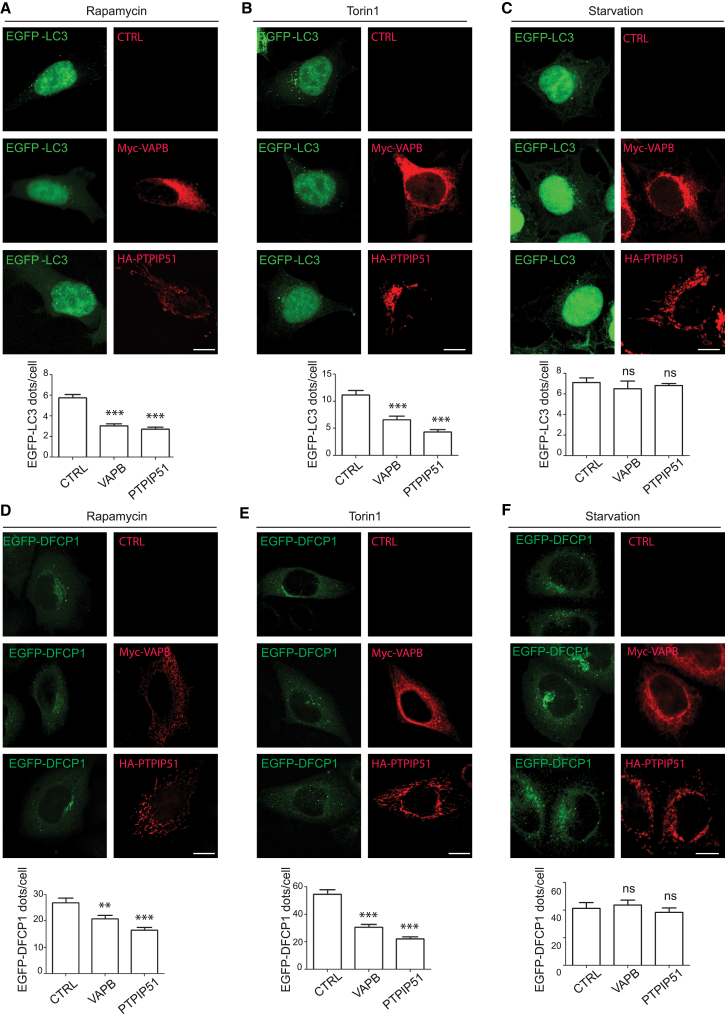
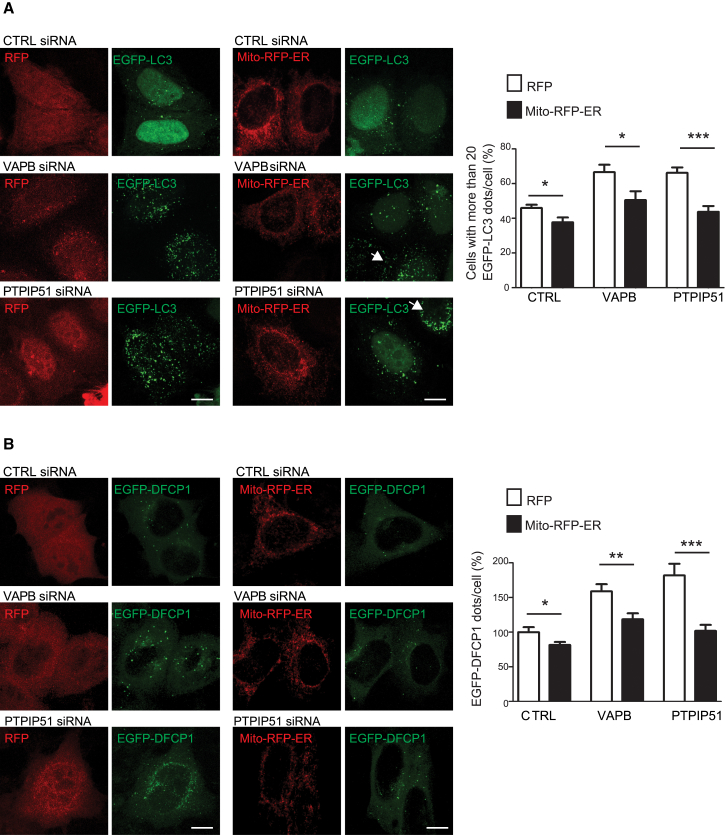
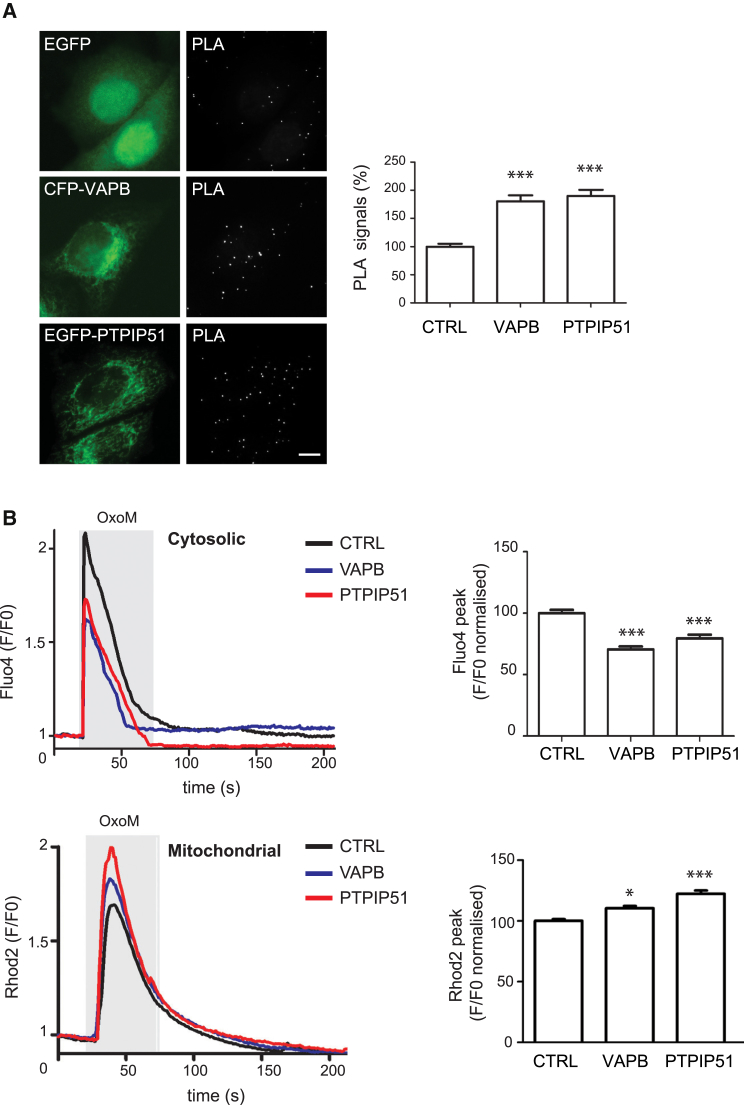
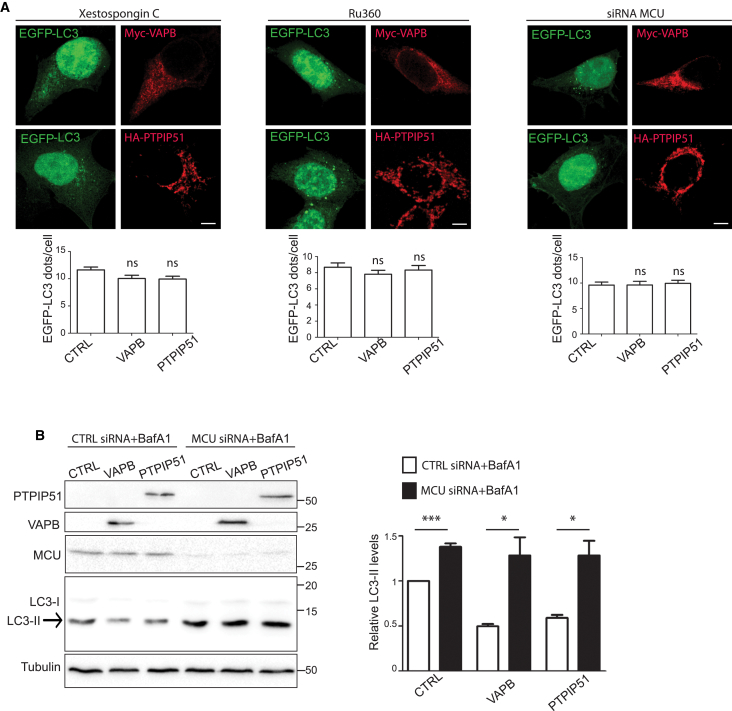
Mitochondria form close physical associations with the endoplasmic reticulum (ER) that regulate a number of physiological functions. One mechanism by which regions of ER are recruited to mitochondria involves binding of the ER protein VAPB to the mitochondrial protein PTPIP51, which act as scaffolds to tether the two organelles. Here, we show that the VAPB-PTPIP51 tethers regulate autophagy. We demonstrate that overexpression of VAPB or PTPIP51 to tighten ER-mitochondria contacts impairs, whereas small interfering RNA (siRNA)-mediated loss of VAPB or PTPIP51 to loosen contacts stimulates, autophagosome formation. Moreover, we show that expression of a synthetic linker protein that artificially tethers ER and mitochondria also reduces autophagosome formation, and that this artificial tether rescues the effects of siRNA loss of VAPB or PTPIP51 on autophagy. Thus, these effects of VAPB and PTPIP51 manipulation on autophagy are a consequence of their ER-mitochondria tethering function. Interestingly, we discovered that tightening of ER-mitochondria contacts by overexpression of VAPB or PTPIP51 impairs rapamycin- and torin 1-induced, but not starvation-induced, autophagy. This suggests that the regulation of autophagy by ER-mitochondria signaling is at least partly dependent upon the nature of the autophagic stimulus. Finally, we demonstrate that the mechanism by which the VAPB-PTPIP51 tethers regulate autophagy involves their role in mediating delivery of Ca2+ to mitochondria from ER stores. Thus, our findings reveal a new molecular mechanism for regulating autophagy.

Keywords: Alzheimer’s disease; MAM; PTPIP51; Parkinson’s disease; VAPB; amyotrophic lateral sclerosis; autophagy; calcium; endoplasmic reticulum; mitochondria.


Figures

None
Graphical abstract
Figure 1
Figure 1
siRNA Knockdown of VAPB or PTPIP51 Increases Autophagic Structures (A) Immunoblots showing siRNA knockdown of VAPB and PTPIP51 in HeLa cells. Cells were untreated (UT) or treated with either control (CTRL), VAPB, or PTPIP51 siRNAs and samples probed for PTPIP51, VAPB, or α-tubulin as a loading control. Protein molecular mass markers are indicated in kD. (B) siRNA knockdown of VAPB or PTPIP51 increases LC3-II levels in HEK293 cells. Cells were UT or treated with either CTRL, VAPB, or PTPIP51 siRNAs and samples probed for PTPIP51, VAPB, LC3, or α-tubulin as a loading control. Both LC3-I and LC3-II isoforms are shown; arrow indicates LC3-II isoform. Bar chart shows relative LC3-II levels following quantification of signals from immunoblots. LC3-II levels were normalized to α-tubulin signals. Protein molecular mass markers are indicated in kD. Data were analyzed by one-way ANOVA and Tukey’s post hoc test; n = 5. Error bars are SEM; p ≤ 0.05. (C) siRNA knockdown of VAPB or PTPIP51 increases autophagic structures in HeLa cells. Cells were transfected with CTRL, VAPB, or PTPIP51 siRNAs and the numbers of ULK1, ATG5, EGFP-DFCP1, and EGFP-LC3 autophagic structures quantified. Representative confocal images of cells are shown with DAPI-labeled nuclei; scale bars are 10 μm. Bar charts show quantification of autophagic structures (dots/cell). Data were analyzed by one-way ANOVA and Tukey’s post hoc test. For ULK1, EGFP-DFCP1, and ATG5, n = 45–200 cells; for EGFP-LC3, n = 401–466 cells per condition in five independent experiments. Error bars are SEM; p ≤ 0.05; ∗∗∗p ≤ 0.001. (D) siRNA knockdown of VAPB or PTPIP51 increases the number of autophagic structures detected in the EM. Representative EM images of UT HeLa cells or cells treated with CTRL, VAPB, or PTPIP51 siRNAs as indicated are shown. Both low- and high-power (zoom) images are displayed. Arrows indicate autophagic structures. The scale bar represents 500 nm. The bar chart shows number of autophagic structures/μm2. Data were analyzed by one-way ANOVA and Tukey’s post hoc test. n = 15–17 cells. Error bars are SEM; ∗∗∗p ≤ 0.001.
Figure 2
Figure 2
siRNA Knockdown of VAPB or PTPIP51 Induces Autophagic Flux (A) HeLa cells were treated with CTRL VAPB or PTPIP51 siRNAs and treated with either vehicle or bafilomycin A1 (±BafA1) as indicated and samples then probed on immunoblots for LC3 and α-tubulin as a loading control. Both LC3-I and LC3-II isoforms are shown; arrow indicates LC3-II isoform. Bafilomycin A1 increases the levels of LC3-II in control, VAPB, and PTPIP51 siRNA knockdown cells. Bar chart shows relative LC3-II levels following quantification of signals from immunoblots. LC3-II levels were normalized to α-tubulin signals. Protein molecular mass markers are indicated in kD. Data were analyzed by one-way ANOVA and Tukey’s post hoc test; n = 5 (vehicle) and n = 3 (bafilomycin A1). Error bars are SEM; p ≤ 0.05; ∗∗p ≤ 0.01; ∗∗∗p ≤ 0.001. (B) siRNA knockdown of VAPB or PTPIP51 decrease EGFP-HD74Q aggregation. Representative images of HEK293 cells transfected with EGFP-HDQ74 and either UT or treated with CTRL, VAPB, or PTPIP51 siRNAs are shown. Cells were analyzed 48 hr post EGFP-HDQ74 transfection. Arrows indicate cells containing EGFP-HDQ74 aggregates. Blue represents DAPI staining of nuclei. The scale bar represents 10 μm. Bar chart shows percentage of EGFP-HD74Q transfected cells displaying aggregates. Data were obtained from 300–550 EGFP-HD74Q-transfected cells per condition in three independent experiments. Data were analyzed by one-way ANOVA and Tukey’s post hoc test. Error bars are SEM; p ≤ 0.05.
Figure 3
Figure 3
VAPB or PTPIP51 Overexpression Inhibits Basal Autophagy and Autophagic Flux (A and B) Representative images of HEK293 cells co-transfected with EGFP-LC3 and either control empty vector (CTRL), Myc-VAPB, or HA-PTPIP51 and treated with either vehicle (A) or bafilomycin A1 (BafA1) (B) as indicated. Cells were immunostained for VAPB and PTPIP51 via their epitope tags and LC3 visualized via the EGFP tag. Transfection of VAPB or PTPIP51 decreases the numbers of EGFP-LC3 structures in both vehicle- and bafilomycin A1-treated cells. The scale bars represent 10 μm. The bar charts show numbers of EGFP-LC3 dots per cell in the different experiments. Data were analyzed by one-way ANOVA and Tukey’s post hoc test. n = 100–130 cells per condition from three independent experiments. Error bars are SEM; ∗∗p ≤ 0.01; ∗∗∗p ≤ 0.001. (C) VAPB or PTPIP51 overexpression inhibits autophagic flux. HeLa cells were transfected with either control empty vector (CTRL), Myc-VAPB, or HA-PTPIP51 and treated with either vehicle (−) or bafilomycin A1 (BafA1+) as indicated. Samples were then probed on immunoblots for LC3 and α-tubulin as a loading control. Protein molecular mass markers are indicated in kD. Both LC3-I and LC3-II isoforms are shown; arrow indicates LC3-II isoform. Also shown are immunoblots for PTPIP51 and VAPB, which were detected via their epitope tags. VAPB and PTPIP51 expression decreases the levels of LC3-II in both vehicle- and bafilomycin-A1-treated cells. The bar chart shows relative LC3-II levels following quantification of signals from immunoblots. LC3-II levels were normalized to α-tubulin signals. Data were analyzed by one-way ANOVA and Tukey’s post hoc test; n = 3. Error bars are SEM; p ≤ 0.05; ∗∗p ≤ 0.01. (D) VAPB and PTPIP51 expression increases EGFP-HD74Q aggregation in HEK293T cells. Cells were co-transfected with EGFP-HD74Q and either control empty vector (CTRL), Myc-VAPB, or HA-PTPIP5 and immunostained for VAPB and PTPIP51 via their epitope tags. Cells were analyzed 48 hr post-transfection. Arrows indicate cells containing EGFP-HDQ74 aggregates; blue represents DAPI staining of nuclei. The scale bar represents 10 μm. The bar chart shows percentage of EGFP-HD74Q-transfected cells displaying aggregates. Data were obtained from 320-580 EGFP-HD74Q-transfected cells per condition from five independent experiments. Data were analyzed by one-way ANOVA and Tukey’s post hoc test. Error bars are SEM; p ≤ 0.05; ∗∗∗p ≤ 0.001.
Figure 4
Figure 4
VAPB and PTPIP51 Overexpression Inhibits Rapamycin- and Torin-1-Induced, but Not Starvation-Induced, Autophagy (A–C) Representative images of HEK293T cells co-transfected with EGFP-LC3 and either control empty vector (CTRL), Myc-VAPB, or HA-PTPIP51 as indicated and treated with rapamycin (A), torin 1 (B), or starvation (C). Cells were immunostained for VAPB and PTPIP51 via their epitope tags and LC3 visualized via the EGFP tag. The bar charts show number of EGFP-LC3 dots per cell in the different experiments. Data were analyzed by one-way ANOVA and Tukey’s post hoc test. n = 80–192 cells per condition from three independent experiments. Error bars are SEM; ∗∗∗p ≤ 0.001; ns, not significant. (D–F) Representative images of HeLa cells co-transfected with EGFP-DFCP1 and either control empty vector (CTRL), Myc-VAPB, or HA-PTPIP51 and treated with rapamycin (D), torin 1 (E), or starvation (F). Cells were immunostained for VAPB and PTPIP51 via their epitope tags and DFCP1 visualized via the EGFP tag. The bar charts show number of EGFP-DFCP1 dots per cell in the different experiments. Data were analyzed by one-way ANOVA and Tukey’s post hoc test. n = 75–100 cells per condition from three independent experiments. Error bars are SEM; ∗∗p ≤ 0.01; ∗∗∗p ≤ 0.001. Scale bars represent 10 μm. See also Figure S2.
Figure 5
Figure 5
Artificially Tethering ER and Mitochondria by Transfection of Mito-RFP-ER Reduces the Effect of siRNA Loss of VAPB or PTPIP51 on Autophagosome Formation (A) Representative images of HEK293 cells treated with either control, VAPB, or PTPIP51 siRNAs and then transfected with EGFP-LC3+control RFP or EGFP-LC3+Mito-RFP-ER as indicated; arrows show non-transfected cells for comparison. The scale bars represent 10 μm. (B) Representative images of HeLa cells treated with either control, VAPB, or PTPIP51 siRNAs and then transfected with EGFP-DFCP1+RFP or EGFP-DFCP1+Mito-RFP-ER as indicated. The scale bars represent 10 μm. The bar charts show quantification of EGFP-LC3 (A) and EGFP-DFCP1 (B) autophagic structures (dots/cell). Data were analyzed by Student’s t test. n = 71–264 cells per condition in three to five independent experiments. Error bars are SEM; p ≤ 0.05; ∗∗p ≤ 0.01; ∗∗∗p ≤ 0.001. See also Figure S1.
Figure 6
Figure 6
Overexpression of VAPB or PTPIP51 Increases IP3 Receptor3-VDAC1 Interactions and ER-Mitochondria Ca2+ Exchange (A) HeLa cells were transfected with control EGFP vector, CFP-VAPB, or EGFP-PTPIP51 and proximity ligation assays (PLAs) for IP3 receptor3-VDAC1 interactions then performed. Representative images with PLA signals in the different transfected cells are shown. The scale bar represents 10 μm. The bar chart shows quantification of PLA signals. Data were analyzed by one-way ANOVA and Tukey’s post hoc test. n = 77–142 cells per condition from three independent experiments. Error bars are SEM; ∗∗∗p ≤ 0.001. (B) Cytosolic (upper) and mitochondrial (lower) Ca2+ levels following oxotremorine-M (OxoM)-induced Ca2+ release from ER stores. HEK293 cells were co-transfected with M3R and either control empty vector (CTRL), Myc-VAPB, or HA-PTPIP51 and treated with oxotremorine-M. Representative traces of Fluo4 (cytosolic) and Rhod2 (mitochondrial) fluorescence are shown on the left, and normalized peak values are shown on the right. Fluo4 and Rhod2 fluorescence shows transient increases in cytosolic and mitochondrial Ca2+ levels upon OxoM-induced Ca2+ release from ER stores. Compared to control, VAPB and PTPIP51 expression decreased peak cytosolic and increased peak mitochondrial Ca2+ levels. Data were analyzed by one-way ANOVA and Tukey’s post hoc test. n = 48–81 cells from three independent experiments. Error bars are SEM; p ≤ 0.05; ∗∗∗p ≤ 0.001. See also Figure S3.
Figure 7
Figure 7
Inhibiting IP3 Receptor-Mediated Ca2+ Delivery to Mitochondria Abrogates the Effects of VAPB and PTPIP51 Overexpression on Autophagosome Formation (A) Representative images of HEK293 cells co-transfected with EGFP-LC3 and either myc-VAPB or HA-PTPIP51 and treated with either the IP3 receptor inhibitor Xestospongin C, the mitochondrial Ca2+ uniporter (MCU) blocker Ruthenium-360 (Ru360), or MCU siRNAs. For MCU siRNAs, cells were first treated with siRNAs and then transfected with plasmids. Cells were immunostained for VAPB and PTPIP51 via their epitope tags and LC3 visualized via the EGFP tag. The scale bars represent 10 μm. Bar charts show numbers of EGFP-LC3 dots per cell in the different experiments. Data were analyzed by one-way ANOVA. n = 118–187 cells in three or four independent experiments. Error bars are SEM. (B) siRNA loss of MCU increases LC3-II levels and abrogates the effects of VAPB and PTPIP51 overexpression on LC3-II levels in bafilomycin-A1-treated HeLa cells. Cells were treated with CTRL or MCU siRNAs, transfected with either myc-VAPB or HA-PTPIP51, and treated with bafilomycin A1 (BafA1) as indicated. Samples were then probed on immunoblots for LC3, MCU, VAPB, PTPIP51, and α-tubulin as a loading control. VAPB and PTPIP51 were detected via their epitope tags. Both LC3-I and LC3-II isoforms are shown; arrow indicates LC3-II isoform. Molecular mass markers are indicated in kD. The bar chart shows relative LC3-II levels following quantification of signals from immunoblots. LC3-II levels were normalized to α-tubulin signals. Data were analyzed by one-way ANOVA and Tukey’s post hoc test; n = 3. Error bars are SEM; p ≤ 0.05; ∗∗∗p ≤ 0.001. See also Figure S4.

Comment in

References

    1. Mizushima N. Autophagy: process and function. Genes Dev. 2007;21:2861–2873. - PubMed
    1. Rubinsztein D.C., Codogno P., Levine B. Autophagy modulation as a potential therapeutic target for diverse diseases. Nat. Rev. Drug Discov. 2012;11:709–730. - PMC - PubMed
    1. Lamb C.A., Yoshimori T., Tooze S.A. The autophagosome: origins unknown, biogenesis complex. Nat. Rev. Mol. Cell Biol. 2013;14:759–774. - PubMed
    1. Westrate L.M., Lee J.E., Prinz W.A., Voeltz G.K. Form follows function: the importance of endoplasmic reticulum shape. Annu. Rev. Biochem. 2015;84:791–811. - PubMed
    1. Phillips M.J., Voeltz G.K. Structure and function of ER membrane contact sites with other organelles. Nat. Rev. Mol. Cell Biol. 2016;17:69–82. - PMC - PubMed

MeSH terms