. 2017 Feb 20;27(4):602-609.
doi: 10.1016/j.cub.2017.01.011. Epub 2017 Jan 26.

Systematic Mapping of RNA-Chromatin Interactions In Vivo

Affiliations

Systematic Mapping of RNA-Chromatin Interactions In Vivo

Bharat Sridhar et al. Curr Biol. .

Erratum in

Abstract

RNA molecules can attach to chromatin. It remains difficult to know what RNAs are associated with chromatin and where the genomic target loci of these RNAs are. Here, we present MARGI (mapping RNA-genome interactions), a technology to massively reveal native RNA-chromatin interactions from unperturbed cells. The gist of this technology is to ligate chromatin-associated RNAs (caRNAs) with their target genomic sequences by proximity ligation, forming RNA-DNA chimeric sequences, which are converted to a sequencing library for paired-end sequencing. Using MARGI, we produced RNA-genome interaction maps for human embryonic stem cells (ESCs) and human embryonic kidney (HEK) cells. MARGI revealed hundreds of caRNAs, including previously known XIST, SNHG1, NEAT1, and MALAT1, as well as each caRNA's genomic interaction loci. Using a cross-species experiment, we estimated that approximately 2.2% of MARGI-identified interactions were false positives. In ESCs and HEK cells, the RNA ends of more than 5% of MARGI read pairs were mapped to distal or inter-chromosomal locations as compared to the locations of their corresponding DNA ends. The majority of transcription start sites are associated with distal or inter-chromosomal caRNAs. Chromatin-immunoprecipitation-sequencing (ChIP-seq)-reported H3K27ac and H3K4me3 levels are positively correlated, while H3K9me3 is negatively correlated, with MARGI-reported RNA attachment levels. The MARGI technology should facilitate revealing novel RNA functions and their genomic target regions.

Keywords: RNA; RNA-chromatin interactions; chromatin; chromatin-associated RNA; proximity ligation.


Figures

Figure 1
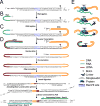
Figure 1. Schema for the MARGI technology
(A) Linker sequence. The linker is composed of double-stranded DNA in the center and single-stranded DNA on the two ends. The top strand of the linker is 11 bases longer than the bottom strand, leaving 10 bases of single-stranded DNA at the 5′ end and 1 base of single-stranded DNA at the 3′ end. The 5′ end of the top strand is adenylated (5′ App) and the 5′ end of the bottom strand is phosphorylated (Phos). N: random base. Letters in blue: BamHI restriction site. (B) RNA-Linker ligation. RNA with 3′-OH was produced by T4 PNK treatment. (C) Linker-DNA ligation. A single base “A” tail (in red) is added to the 3′ end of DNA, which enables a sticky-end ligation to the linker. (D) Circularization and re-linearization. After BamH1 digestion, the linker sequence is split and re-allocated to the two ends, which were by design complementary to the library construction primers. (E) Another perspective of the ligation and reverse transcription steps as shown in A-D. See also Figure S1.
Figure 2
Figure 2. MARGI identified caRNAs
(A-B) Composition of the four nucleotide bases on every position of paired-end reads in a HaeIII library (A) and in a sonication library (B). Arrow: increased proportions of Cytosine (C) in the first two positions, which is specific to Read 2 (DNA end) of the HaeIII library. (C-F) Scatter plots of lincRNAs with MARGI RNA-end read counts per gene (y axis) plotted against gene length (x axis). (G-J) Numbers of non-coding pxRNAs (G-H) and diRNAs (I-J) categorized by RNA type. Proc_transcripts: processed transcripts, misc_RNA: miscellaneous other RNA. See also Figure S4.
Figure 3
Figure 3. Genome view of mapped MARGI read pairs
The mapped MARGI reads are plotted with Genome Interaction Visualizer (GIVe, http://give.genemo.org/?hg38), where the reference genome is plotted horizontally, twice (top and bottom bars). The top and the bottom bars can be zoomed in or out independent of each other. The mapped RNA ends are shown on the top bar (genome), and the DNA ends are shown on the bottom bar (genome). Each MARGI read pair is represented as a line linking the locations of RNA end (top) and the DNA end (bottom). The HEK diMARGI data at are shown with MALAT1 locus (top) versus the entire Chromosome 11 (bottom) (A), the SNHG1 locus versus the entire Chromosome 11 (B), and the XIST locus versus the entire Chromosome X (C). Red arrows point to known caRNAs.
Figure 4
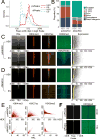
Figure 4. caRNA associated genomic regions
(A) Size distributions of pxPeaks (red) and diPeaks (blue) from HEK (solid) and ES cells (dashed curve). (B) Proportions of pxPeaks and diPeaks in promoters, UTRs, exons, introns, downstream regions, and distal intergenic regions. (C-D) RNA attachment levels (RAL) (white) in 20,000 bp flanking regions of all (34,475) non-redundant TSSs (GRCh38), as derived from pxMARGI (C), diMARGI (D) in descending orders. Shown in parallel are H3K4me3 (red), H3K27ac (orange), H3K9me3 (green), and H3K27me3 (blue, ES only, no available data in HEK) intensities, and gene expression levels. Yellow curve: smoothed average of gene expression levels. TSS: transcription start site. (E) Scatter plots of 1,000 bp genomic windows with histone modification levels (y axis) versus RALs (x axis). Each data point represents the average of 100 windows. (F) RAL were plotted for all identified pxPeaks and diPeaks and their 20,000 flanking regions (white). Shown in parallel are H3K9me3 levels on the same regions (green). See also Figures S2, S3.

References

    1. Yin S, Ho CK, Shuman S. Structure-function analysis of T4 RNA ligase 2. The Journal of biological chemistry. 2003;278:17601–17608. - PubMed
    1. Helwak A, Kudla G, Dudnakova T, Tollervey D. Mapping the human miRNA interactome by CLASH reveals frequent noncanonical binding. Cell. 2013;153:654–665. - PMC - PubMed
    1. Nagano T, Lubling Y, Stevens TJ, Schoenfelder S, Yaffe E, Dean W, Laue ED, Tanay A, Fraser P. Single-cell Hi-C reveals cell-to-cell variability in chromosome structure. Nature. 2013;502:59–64. - PMC - PubMed
    1. Lieberman-Aiden E, van Berkum NL, Williams L, Imakaev M, Ragoczy T, Telling A, Amit I, Lajoie BR, Sabo PJ, Dorschner MO, et al. Comprehensive mapping of long-range interactions reveals folding principles of the human genome. Science. 2009;326:289–293. - PMC - PubMed
    1. Engreitz JM, Pandya-Jones A, McDonel P, Shishkin A, Sirokman K, Surka C, Kadri S, Xing J, Goren A, Lander ES, et al. The Xist lncRNA exploits three-dimensional genome architecture to spread across the X chromosome. Science. 2013;341:1237973. - PMC - PubMed