. 2017 Feb 8;93(3):522-532.e5.
doi: 10.1016/j.neuron.2016.12.035. Epub 2017 Jan 26.

Studying Brain Circuit Function with Dynamic Causal Modeling for Optogenetic fMRI

Affiliations

Studying Brain Circuit Function with Dynamic Causal Modeling for Optogenetic fMRI

David Bernal-Casas et al. Neuron. .

Abstract

Defining the large-scale behavior of brain circuits with cell type specificity is a major goal of neuroscience. However, neuronal circuit diagrams typically draw upon anatomical and electrophysiological measurements acquired in isolation. Consequently, a dynamic and cell-type-specific connectivity map has never been constructed from simultaneous measurements across the brain. Here, we introduce dynamic causal modeling (DCM) for optogenetic fMRI experiments-which uniquely allow cell-type-specific, brain-wide functional measurements-to parameterize the causal relationships among regions of a distributed brain network with cell type specificity. Strikingly, when applied to the brain-wide basal ganglia-thalamocortical network, DCM accurately reproduced the empirically observed time series, and the strongest connections were key connections of optogenetically stimulated pathways. We predict that quantitative and cell-type-specific descriptions of dynamic connectivity, as illustrated here, will empower novel systems-level understanding of neuronal circuit dynamics and facilitate the design of more effective neuromodulation therapies.

Keywords: basal ganglia; direct and indirect pathways; dynamic causal modeling; ofMRI; optogenetic fMRI.


Figures

Figure 1
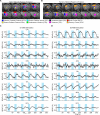
Figure 1. Anatomical masks and time series extracted from regions of interest (ROIs) within the basal ganglia-thalamocortical network
A,B, Anatomical masks for time series extraction and model estimation of the MCX and SCX network models, respectively. C,D, Time series extracted from ROIs of the left (ipsi-stimulation) hemisphere during D1- and D2-MSN stimulations, respectively. Time series are zero-mean, and represent average signal changes across all voxels and subjects (D1-MSN stimulation: n = 12, D2-MSN stimulation: n = 11). Error bars represent the standard error of the mean activation values across subjects. The blue rectangles overlying time series here and in all future panels represent the 20 s periods of optogenetic activation, delivered every minute for six minutes.
Figure 2
Figure 2. Basal ganglia-thalamocortical network model
A, Schematic representation of the a priori generative network model employed in this study. u(t) denotes input to the CPu network node modeling optogenetic stimulation. B, Graphical representation of the matrix A that describes extrinsic (between region) anatomical connections.
Figure 3
Figure 3. The D1-MSN stimulation network reveals connectivity estimates consistent with the direct pathway
A,D, Significant connections during D1-MSN stimulations for MCX and SCX network models, respectively. The greatest connections for either model were from CPu to GPi and SN, which define the direct pathway. Matrices to the right of each network schematic provide a graphical representation of significant connections. For simplicity, self-connections were not included. B,E, Observed and predicted BOLD responses for MCX and SCX network models, respectively. Predicted responses closely fit the observed time series. C,F, According to Bayesian model selection, the stochastic modeling fits the observed BOLD responses better than the deterministic modeling for both MCX and SCX networks. Significance levels were corrected for multiple comparisons by means of FDR.
Figure 4
Figure 4. The D2-MSN stimulation network reveals connectivity estimates consistent with the indirect pathway
A,D, Significant connections during D2-MSN stimulations for MCX and SCX network models, respectively. The connection from GPe to STN, which in part defines the indirect pathway, was the greatest connection within either model. Matrices to the right of each network schematic provide a graphical representation of connection strengths. For simplicity, self-connections were not included. B,E, Observed and predicted BOLD responses for MCX and SCX network models, respectively. Predicted responses closely fit the observed time series. C,F, According to Bayesian model selection, the stochastic modeling fit the observed BOLD responses better than the deterministic modeling in a majority of animals for both MCX and SCX network models. Significance levels were corrected for multiple comparisons by means of FDR.
Figure 5
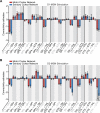
Figure 5. Comparison of connectivity estimates between MCX and SCX network models
A, Comparison of connectivity estimates during D1-MSN stimulations between MCX and SCX network models. No significant differences were observed in the connectivity estimates during D1-MSN stimulations between MCX and SCX network models. B, Comparison of connectivity estimates during D2-MSN stimulations between MCX and SCX network models. No differences were observed in the connectivity estimates during D2-MSN stimulations with the exception of the self-connection within CTX. Error bars represent the standard error of the connectivity estimates over subjects. “cts” indicates a close-to-significant difference across subjects after applying a multiple comparison correction across a priori connections with FDR (P < 0.10).
Figure 6
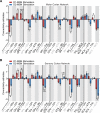
Figure 6. Comparison of connectivity estimates between D1- and D2-MSN stimulation network models
A, Comparison of connectivity estimates between D1- and D2-MSN stimulations for the MCX network model. Statistical differences were observed in the connectivity estimates between D1- and D2-MSN stimulations. B, Comparison of connectivity estimates between D1- and D2-MSN stimulations for the SCX network model. Statisticaldifferences were observed in the connectivity estimates between D1- and D2-MSN stimulations. Error bars represent the standard error of the connectivity estimates over subjects. * indicates P < 0.05 and *** indicates P < 0.001 across subjects after applying a multiple comparison correction across a priori connections with FDR; “cts” indicates a close-to-significant difference (P < 0.10).

Similar articles

Cited by

References

    1. Abe Y, Sekino M, Terazono Y, Ohsaki H, Fukazawa Y, Sakai S, Yawo H, Hisatsune T. Opto-fMRI analysis for exploring the neuronal connectivity of the hippocampal formation in rats. Neuroscience research. 2012;74:248–255. - PubMed
    1. Albin RL, Young AB, Penney JB. The functional anatomy of basal ganglia disorders. Trends in neurosciences. 1989;12:366–375. - PubMed
    1. Amirnovin R, Williams ZM, Cosgrove GR, Eskandar EN. Visually guided movements suppress subthalamic oscillations in Parkinson's disease patients. The Journal of neuroscience : the official journal of the Society for Neuroscience. 2004;24:11302–11306. - PMC - PubMed
    1. Bandettini PA. Twenty years of functional MRI: the science and the stories. Neuroimage. 2012;62:575–588. - PubMed
    1. Bandettini PA. Neuronal or hemodynamic? Grappling with the functional MRI signal. Brain connectivity. 2014;4:487–498. - PMC - PubMed

MeSH terms