. 2017 May 4;20(5):635-647.e7.
doi: 10.1016/j.stem.2016.12.015. Epub 2017 Jan 26.

Nicotinamide Ameliorates Disease Phenotypes in a Human iPSC Model of Age-Related Macular Degeneration

Affiliations

Nicotinamide Ameliorates Disease Phenotypes in a Human iPSC Model of Age-Related Macular Degeneration

Janmeet S Saini et al. Cell Stem Cell. .

Abstract

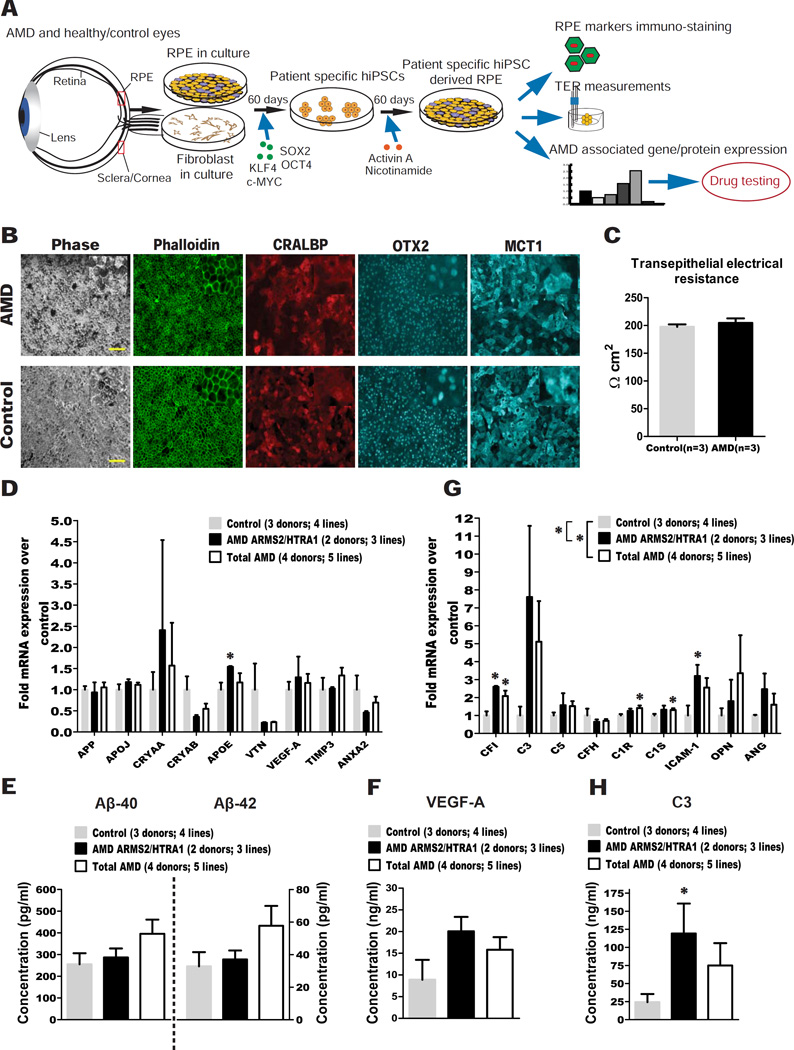
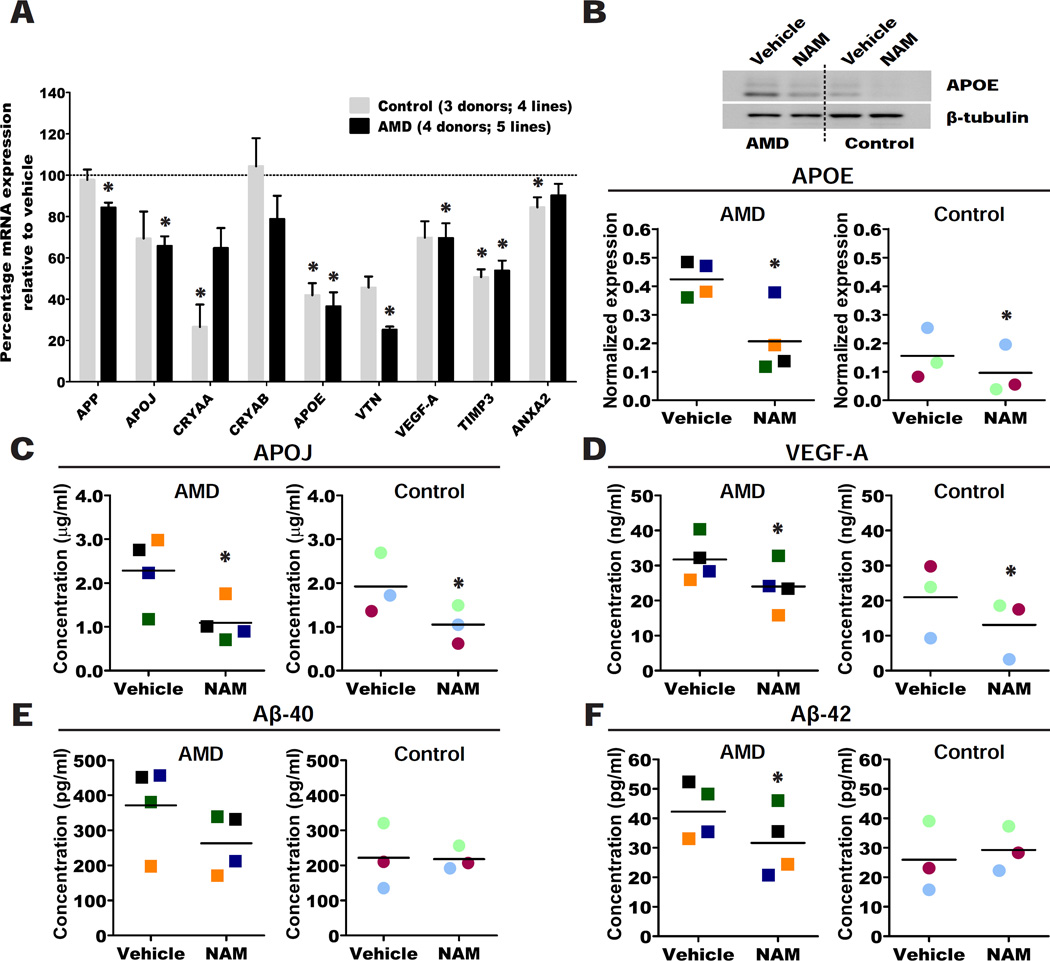
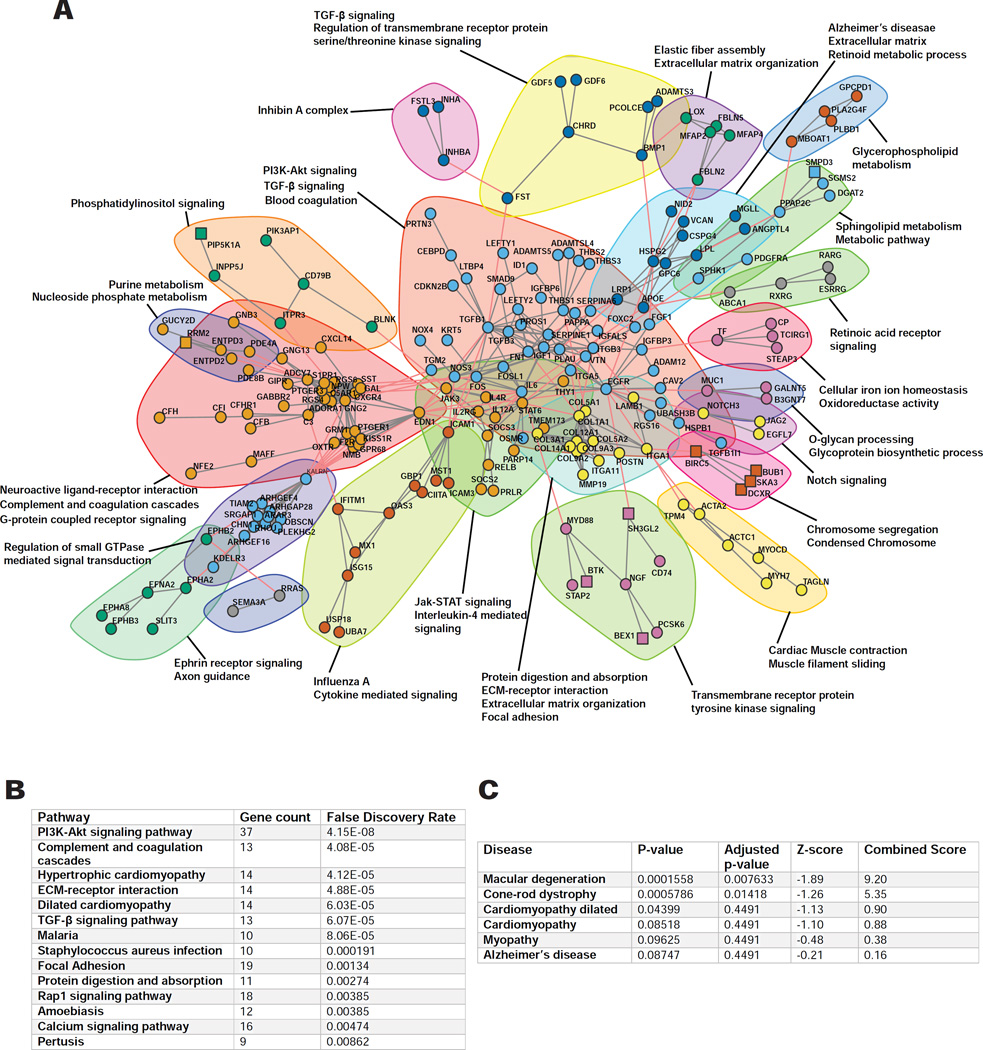
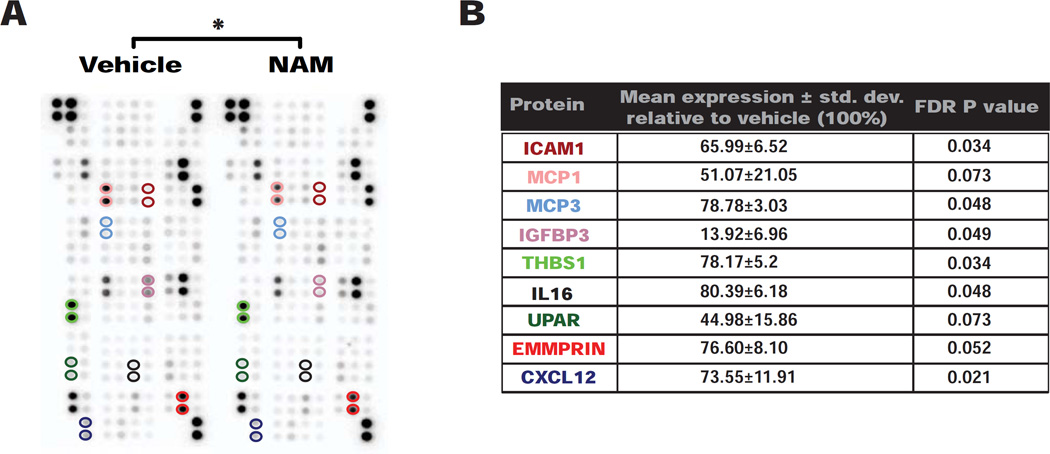
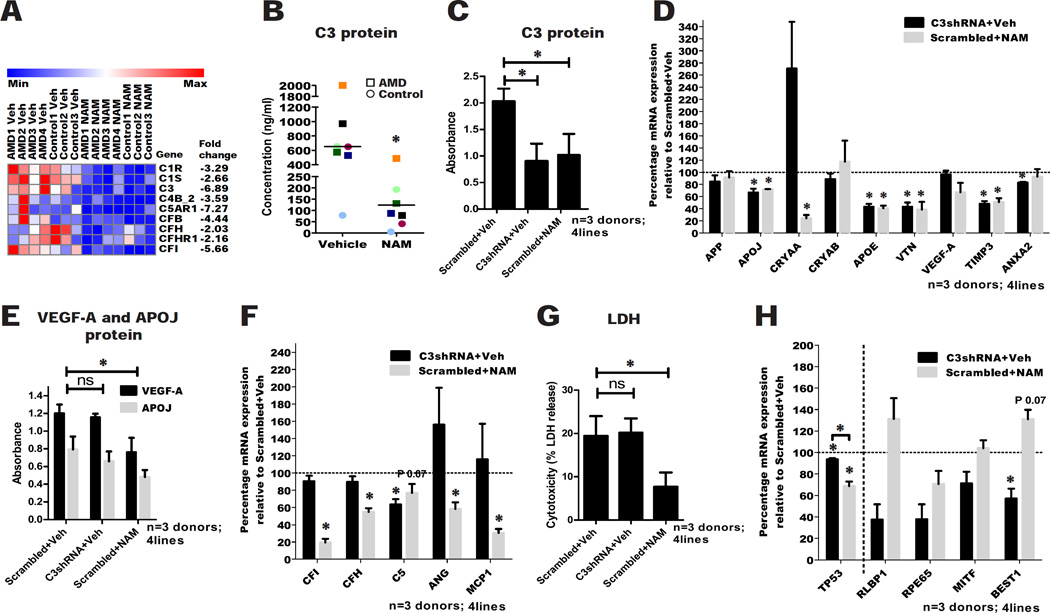
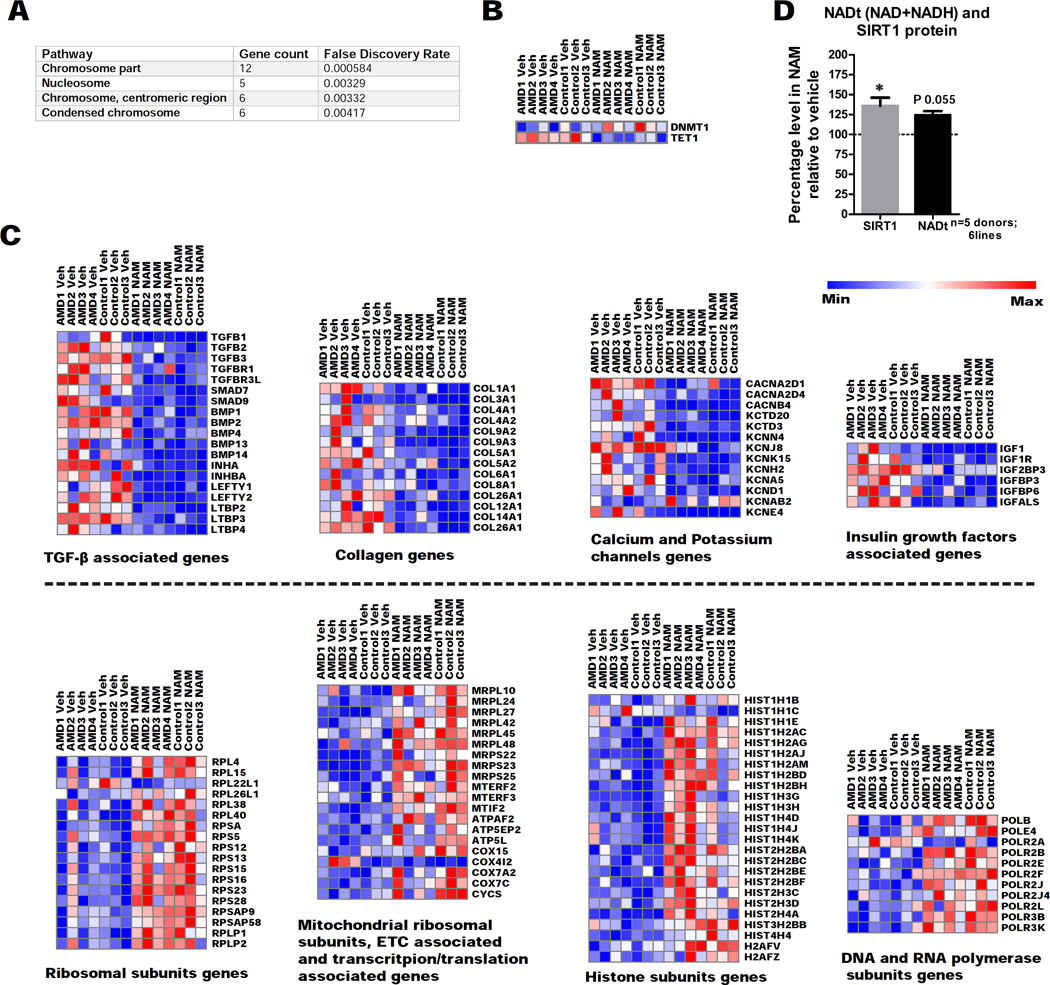
Age-related macular degeneration (AMD) affects the retinal pigment epithelium (RPE), a cell monolayer essential for photoreceptor survival, and is the leading cause of vision loss in the elderly. There are no disease-altering therapies for dry AMD, which is characterized by accumulation of subretinal drusen deposits and complement-driven inflammation. We report the derivation of human-induced pluripotent stem cells (hiPSCs) from patients with diagnosed AMD, including two donors with the rare ARMS2/HTRA1 homozygous genotype. The hiPSC-derived RPE cells produce several AMD/drusen-related proteins, and those from the AMD donors show significantly increased complement and inflammatory factors, which are most exaggerated in the ARMS2/HTRA1 lines. Using a panel of AMD biomarkers and candidate drug screening, combined with transcriptome analysis, we discover that nicotinamide (NAM) ameliorated disease-related phenotypes by inhibiting drusen proteins and inflammatory and complement factors while upregulating nucleosome, ribosome, and chromatin-modifying genes. Thus, targeting NAM-regulated pathways is a promising avenue for developing therapeutics to combat AMD.

Keywords: age-related macular degeneration; aging; complement; drusen; human induced pluripotent stem cells; nicotinamide; retina; retinal pigment epithelium.


Figures

Figure 1
Figure 1. hiPSC-RPE from total AMD and AMD ARMS2/HTRA1 donors express higher levels of disease-related markers compared to controls
(A) Experiment schematic. (B) AMD and control hiPSC-RPE stained for Phalloidin, and the RPE markers CRALBP, OTX2 and MCT1 (Scale bar: 100µM). Insets show digitally zoomed high magnification images. (C) AMD and control hiPSC-RPE showed similar TER. (D) qPCR analysis of AMD ARMS2/HTRA1 hiPSC-RPE and total AMD hiPSC-RPE versus control hiPSC-RPE for AMD/drusen transcripts. (E-F) ELISA testing of culture supernatant from AMD ARMS2/HTRA1, total AMD and control hiPSC-RPE obtained 60–72 hours after the last medium change for secretion of Aβ peptides (E) and VEGF-A (F). (G) qPCR analysis of AMD ARMS2/HTRA1 hiPSC-RPE and total AMD hiPSC-RPE versus control hiPSC-RPE for complement/inflammatory transcripts. (H) ELISA testing of culture supernatant from AMD ARMS2/HTRA1, total AMD and control hiPSC-RPE obtained 60–72 hours after the last medium change for secretion of C3. Data are expressed as mean± SEM. Unpaired Student’s t test (one-tailed) (D–H) and two-way ANOVA (D, G) were used for statistical analysis (*= p<0.05). See also Figure S1 and Table S1.
Figure 2
Figure 2. NAM suppresses production of AMD-related disease markers in AMD and control hiPSC-RPE
(A) Percentage mRNA expression for AMD/drusen transcripts analyzed by qPCR in AMD and control hiPSC-RPE treated with 10mM NAM relative to vehicle (baseline defined as 100%). Data are expressed as mean± SEM. (B) Representative western blot of APOE protein in AMD and control hiPSC-RPE treated with 10mM NAM or vehicle; (quantification of western blot in Figure S2B, lower panel). (C-F) Secretion of APOJ (C), VEGF-A (D), Aβ-40 (E) and Aβ-42 (F) measured by ELISA into the culture supernatant 60–72 hours after the last medium change in AMD and control hiPSC-RPE treated with 10mM NAM or vehicle. Data are expressed as mean of all samples (line), and individual sample values are plotted: AMD hiPSC-RPE are represented by squares (n=4 AMD donors; 5 lines) and control hiPSC-RPE by circles (n=3 control donors; 4 lines). Colors correspond to hiPSC-RPE samples in Table S1; each sample is color matched across NAM and vehicle treatment. Paired Student’s t test (one-tailed) was used for statistical analysis (*= p<0.05). See also Figure S2 and Table S1.
Figure 3
Figure 3. RNA-seq analysis of action of NAM on hiPSC-RPE
(A) Gene interaction network (confidence level=0.9) of the differentially expressed genes in NAM treated hiPSC-RPE compared to vehicle from RNA-seq analysis, using the STRING database (n=7 donors; 4 AMD and 3 control; 7 lines). Subnetworks (Neighborhoods) are colored and annotated with enriched functional categories. Gray lines: connections within a neighborhood; Red lines: connections between neighborhoods; Squares: Upregulated genes; Circles: Downregulated genes. (B-C) GO enrichment for KEGG pathways (B) and disease associations (C) of the differentially expressed genes (n=7 donors; 4 AMD and 3 control; 7 lines). See also Figure S3.
Figure 4
Figure 4. NAM reduces production of pro-inflammatory cytokines from hiPSC-RPE cells
(A) Representative image of an array analyzed for 102 human cytokines in supernatant collected 60–72 hours after the last medium change from AMD and control hiPSC-RPE lines treated with 10mM NAM or vehicle (Figure S4B) (n=4 donors; 2 AMD and 2 control; 4 lines). Colored circles represent proteins that showed a significant change, also listed in Figure 4B. (B) Nine cytokines showed significantly differential secretion in hiPSC-RPE treated with 10mM NAM relative to vehicle, their mean expression ± std. dev. relative to vehicle (baseline defined as 100%) (Figure S4C) and P values. Protein names are color-matched to the circles highlighting the cytokine localization on the array in Figure 4A. Paired Student’s t test (two-tailed) with FDR adjustment and two-way ANOVA were used for statistical analysis (*= p<0.05). See also Figure S4 and Table S3.
Figure 5
Figure 5. NAM effectively reduces production of complement factors
(A) Altered expression of several genes in the complement pathway detected by RNA-seq analysis of NAM treatment (n=7 donors; 4 AMD and 3 control; 7 lines). (B) Secretion of C3 into the culture supernatant 60–72 hours after the last medium change in AMD and control hiPSC-RPE treated with 10mM NAM or vehicle. Data are expressed as mean of all samples (line), and individual sample values are plotted: AMD hiPSC-RPE are represented by squares and control hiPSC-RPE by circles (n=7 donors; 4 AMD and 3 control; 9 lines). Colors correspond to hiPSC-RPE samples in Table S1; each sample is color matched across NAM and vehicle treatment. (C) ELISA measurement of secretion of C3 into the culture supernatant 60–72 hours after the last medium change in vehicle, 10mM NAM and C3shRNA treated hiPSC-RPE. Data are expressed as mean± SEM of absorbance from ELISA assay (n=3 donors; 2 AMD and 1 control; 4 lines). (D) qPCR analysis of AMD/drusen associated protein transcripts in C3shRNA and 10mM NAM treated hiPSC-RPE relative to vehicle (baseline defined as 100%). Data are expressed as mean± SEM (n=3 donors; 2 AMD and 1 control; 4 lines). (E) ELISA measurement of secretion of VEGF-A and APOJ into the culture supernatant 60–72 hours after the last medium change in vehicle, 10mM NAM and C3shRNA treated hiPSC-RPE. Data are expressed as mean± SEM of absorbance from ELISA assay (n=3 donors; 2 AMD and 1 control; 4 lines). (F) qPCR analysis of complement and inflammation associated protein transcripts in C3shRNA and 10mM NAM treated hiPSC-RPE relative to vehicle (baseline defined as 100%). Data are expressed as mean± SEM (n=3 donors; 2 AMD and 1 control; 4 lines). (G) LDH release into the culture supernatant of vehicle, 10mM NAM and C3shRNA treated hiPSC-RPE. Data are expressed as mean± SEM (n=3 donors; 2 AMD and 1 control; 4 lines). (H) qPCR analysis of TP53 and RPE genes expression in C3shRNA and 10mM NAM treated hiPSC-RPE relative to vehicle (baseline defined as 100%). Data are expressed as mean± SEM (n=3 donors; 2 AMD and 1 control; 4 lines). Paired Student’s t test (two-tailed) was used for statistical analysis. Paired Student’s t test (one-tailed) was used for statistical analysis, unless stated otherwise above (*= p<0.05). ns: not significant; veh: vehicle. See also Figure S5 and Table S1.
Figure 6
Figure 6. NAM acts on aging associated pathways and increases expression of SIRT1 protein and NAD biosynthetic pathway in hiPSC-RPE
(A) GO functional enrichment for cellular components of exclusively upregulated genes in NAM treated hiPSC-RPE compared to vehicle from RNA-seq analysis, using the STRING database (n=7 donors; 4 AMD and 3 control; 7 lines). (B) Altered expression of DNA methylation associated genes detected by RNA-seq analysis of NAM treatment (veh: vehicle) (n=7 donors; 4 AMD and 3 control; 7 lines). (C) Altered expression of functionally related genes detected by RNA-seq analysis of NAM treatment (veh: vehicle) (n=7 donors; 4 AMD and 3 control; 7 lines). (D) SIRT1 protein and total NAD (NAD+NADH) levels measured 40–48 hours and 12–18 hours, respectively after the last medium change from 10mM NAM treated hiPSC-RPE relative to vehicle (baseline defined as 100%). Data are expressed as mean± SEM (n=5 donors; 2 AMD and 3 Control; 6 lines). Paired Student’s t-test (two-tailed) was used for statistical analysis (*= p<0.05).

Comment in

References

    1. Alcazar O, Hawkridge AM, Collier TS, Cousins SW, Bhattacharya SK, Muddiman DC, Marin-Castano ME. Proteomics characterization of cell membrane blebs in human retinal pigment epithelium cells. Molecular & cellular proteomics : MCP. 2009;8:2201–2211. - PMC - PubMed
    1. Ambati J, Atkinson JP, Gelfand BD. Immunology of age-related macular degeneration. Nature reviews Immunology. 2013;13:438–451. - PMC - PubMed
    1. An E, Lu X, Flippin J, Devaney JM, Halligan B, Hoffman EP, Strunnikova N, Csaky K, Hathout Y. Secreted proteome profiling in human RPE cell cultures derived from donors with age related macular degeneration and age matched healthy donors. Journal of proteome research. 2006;5:2599–2610. - PubMed
    1. An E, Sen S, Park SK, Gordish-Dressman H, Hathout Y. Identification of novel substrates for the serine protease HTRA1 in the human RPE secretome. Investigative ophthalmology & visual science. 2010;51:3379–3386. - PMC - PubMed
    1. Blenkinsop TA, Saini JS, Maminishkis A, Bharti K, Wan Q, Banzon T, Lotfi M, Davis J, Singh D, Rizzolo LJ, et al. Human Adult Retinal Pigment Epithelial Stem Cell-Derived RPE Monolayers Exhibit Key Physiological Characteristics of Native Tissue. Investigative ophthalmology & visual science. 2015;56:7085–7099. - PMC - PubMed

Publication types

MeSH terms