. 2017 Feb 16;65(4):761-774.e5.
doi: 10.1016/j.molcel.2016.12.024. Epub 2017 Jan 26.

Active Interaction Mapping Reveals the Hierarchical Organization of Autophagy

Affiliations

Active Interaction Mapping Reveals the Hierarchical Organization of Autophagy

Michael H Kramer et al. Mol Cell. .

Abstract

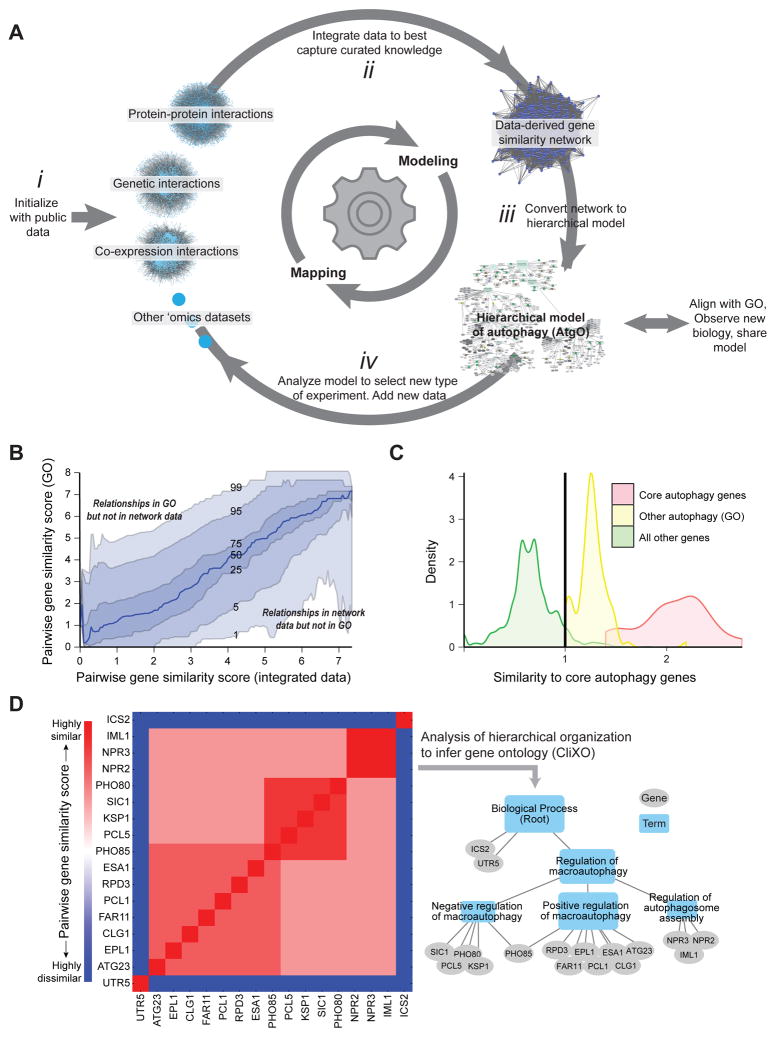
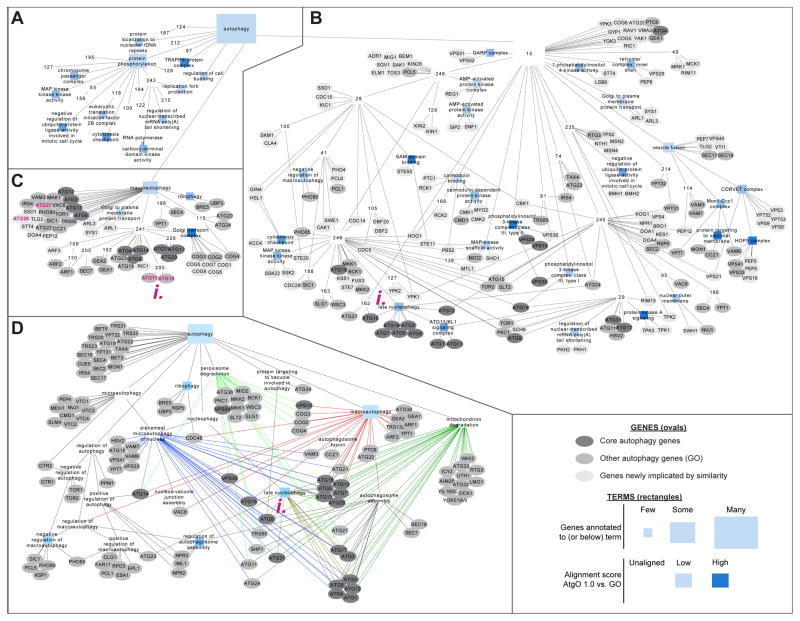
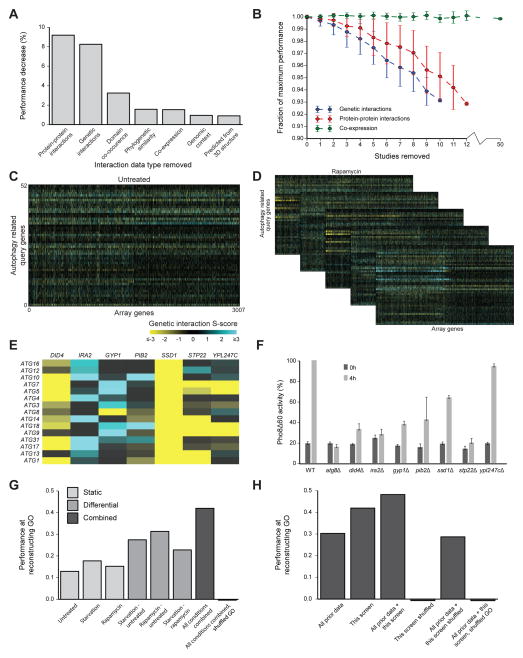
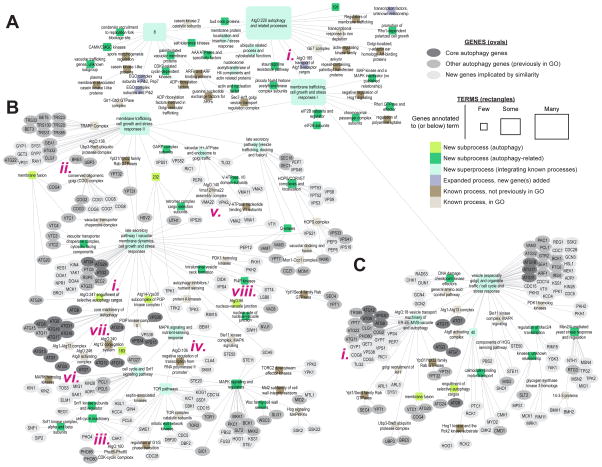
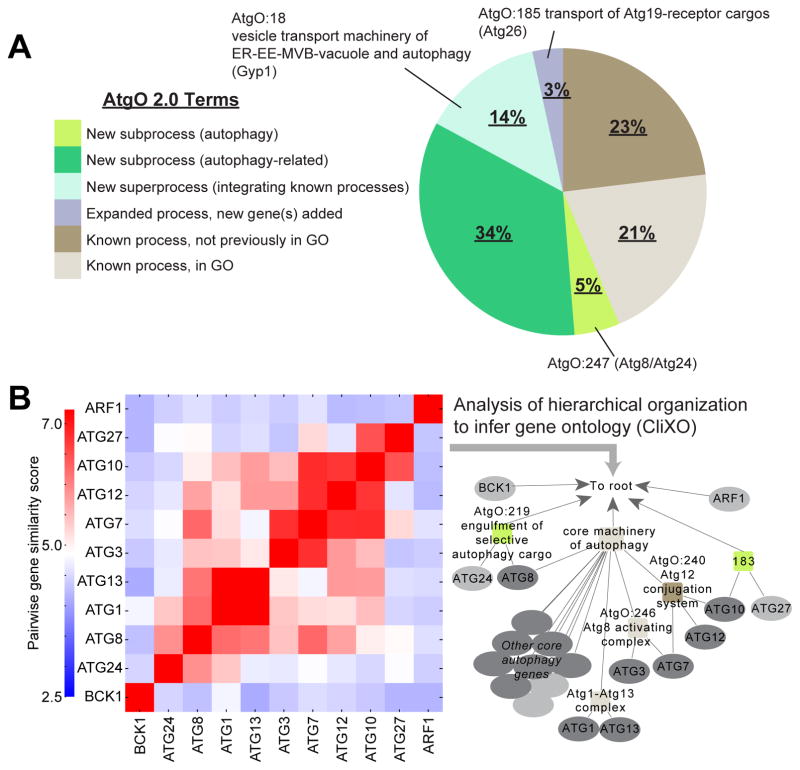
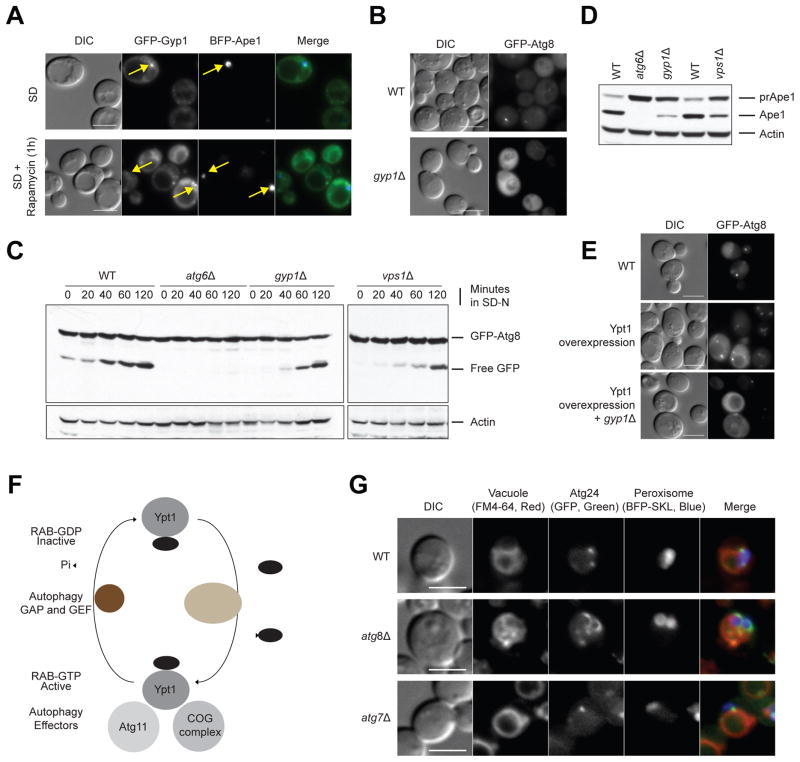
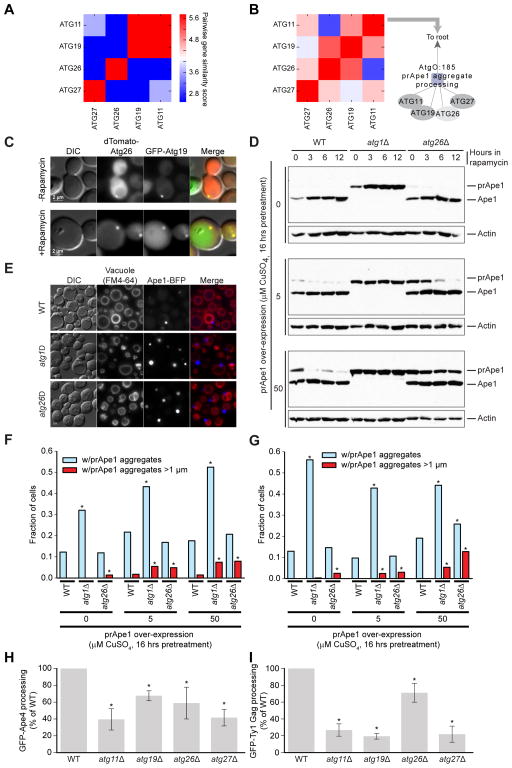
We have developed a general progressive procedure, Active Interaction Mapping, to guide assembly of the hierarchy of functions encoding any biological system. Using this process, we assemble an ontology of functions comprising autophagy, a central recycling process implicated in numerous diseases. A first-generation model, built from existing gene networks in Saccharomyces, captures most known autophagy components in broad relation to vesicle transport, cell cycle, and stress response. Systematic analysis identifies synthetic-lethal interactions as most informative for further experiments; consequently, we saturate the model with 156,364 such measurements across autophagy-activating conditions. These targeted interactions provide more information about autophagy than all previous datasets, producing a second-generation ontology of 220 functions. Approximately half are previously unknown; we confirm roles for Gyp1 at the phagophore-assembly site, Atg24 in cargo engulfment, Atg26 in cytoplasm-to-vacuole targeting, and Ssd1, Did4, and others in selective and non-selective autophagy. The procedure and autophagy hierarchy are at http://atgo.ucsd.edu/.

Keywords: active interaction mapping; autophagy; hierarchical modeling; human; systems biology; yeast.


Figures

Figure 1
Figure 1. Program for Active Interaction Mapping
(A) After initialization with public data sets (i), the approach proceeds by progressive iterations of data integration (ii), hierarchical model assembly (iii), and adaptive generation of new data (iv). (B) Pairwise gene similarity scores from curated knowledge (GO) versus the integrated data. Curves track percentiles in GO similarity scores at a given level of data similarity. (C) Selection of 492 autophagy-related genes. Twenty genes (red) are assigned to “core autophagy” by (Jin and Klionsky, 2013); another 102 genes (yellow) are annotated to GO:autophagy (GO:0006914). For all other genes (green) the average similarity score to core autophagy genes is calculated from the network data; a similarity threshold (vertical line) is set to select 370 genes at least as similar to core genes as those in GO:autophagy. (D) Inference of the hierarchical model from (idealized) pairwise similarity scores using CliXO.
Figure 2
Figure 2. First-generation autophagy ontology
(A–C) AtgO 1.0 model of terms (rectangles), genes (ovals), and hierarchical interrelations among these (links). Rectangle size shows number of genes annotated to that term; its color shows term alignment to GO: darker blue indicates higher similarity to GO, white terms/red outlines do not align. Oval color indicates gene status. For compactness, gene annotations are displayed only for terms AtgO:15 (B, no GO alignment) and AtgO:18 (C, aligned to GO: “macroautophagy”). (D) Comparison to the Gene Ontology as curated from literature, showing GO terms and annotations for GO:0006914:“autophagy” and its descendants. Links of the same color are relations with the same parent term.
Figure 3
Figure 3. Active analysis of data types leads to conditional genetic interaction maps
(A) Performance decrease in AtgO 1.0 when all data of one type are excluded from the model. Performance is measured as the Pearson correlation between pairwise similarity scores derived from integrated data versus GO, focusing on gene pairs within the 492 autophagy-related genes (see main text). (B) Performance degradation as single studies of the indicated type (color) are cumulatively excluded. The mean (points) and standard deviation (error bars) are calculated over 50 random sets of removed studies. See also Figure S1. (C–D) New genetic interaction maps between 52 autophagy query genes and 3007 non-essential array genes in untreated conditions (rich media, C) as well as rapamycin and starvation conditions (D). Differential maps between each pair of conditions are also displayed. See also Table S1. (E) Differential genetic interactions (rapamycin – untreated) between core autophagy genes and implicated array genes. (F) Pho8Δ60 enzymatic activity measurement of gene deletions in (E). Samples were collected from growing cells (0h; mid-log phase in YPD) and after nitrogen starvation (4h SD–N). All activity measurements were normalized to Pho8Δ60 activity in the WT 4h sample (100%). Error bars indicate SD of three replicates. (G–H) Performance of reconstructing GO, using new data only (G) or integrating new with prior data (H). Performance is measured over gene pairs within the set of 52 autophagy query genes, in comparison to randomized data or GO (mean of 100 trials).
Figure 4
Figure 4. Second-generation ontology
(A) AtgO 2.0 hierarchical model. AtgO:220:“autophagy and related processes” and its descendants are displayed. Gene annotations are shown for branches beneath AtgO:11:“membrane trafficking, cell growth and stress responses II” (B) and AtgO:14:“vesicle (especially golgi) and organelle traffic/cell cycle and stress response” (C). Term names have been manually curated by our team, thus may differ from previous versions of AtgO or GO. See also Table S2, Table S3, Figure S2.
Figure 5
Figure 5. Characterization of AtgO 2.0
(A) Summary of AtgO terms by types of biological findings. (B) Pairwise gene similarity matrix and resulting AtgO 2.0 hierarchy for a subset of core autophagy genes.
Figure 6
Figure 6. Analysis of Gyp1 and Atg8/Atg24
(A) Co-localization (yellow arrows) of Gyp1 and the PAS marker Ape1 in wild-type cells under nominal conditions (SD) or after rapamycin (SD+rapamycin) treatment, using fluorescence microscopy. (B) Atg8 localization in wild-type and gyp1Δ cells. (C) Atg8 cleavage and (D) prApe1 maturation assay in wild-type, atg6Δ (positive control), gyp1Δ and vps1Δ strains. (E) Atg8 localization in context of wild-type, Ypt1 overexpression, and gyp1Δ with Ypt1 overexpression after rapamycin treatment for 1 hour. (F) Model proposing the conversion of GDP-bound Ypt1 into the GTP-bound, active form, catalyzed by guanidine nucleotide exchange factor TRAPPIII during autophagy. Ypt1-GTP is recognized by at least two autophagy effectors, Atg11 and the COG complex, and is converted back to the GDP-bound, inactive form by the GTPase-activating protein Gyp1. (G) Localization of Atg24 in wild-type, atg7Δ and atg8Δ strains of P. pastoris under pexophagy conditions. Bar scale is 5 μm.
Figure 7
Figure 7. Analysis of Atg26 involvement in the transport of Atg19-receptor cargos
(A–B) The refinement of AtgO 1.0 (A) to AtgO 2.0 (B), resulting in expansion of AtgO:185 which we name “transport of Atg19-receptor cargos”. (C) Co-localization of dTomato-Atg26 and GFP-Atg19 in wild-type cells before and after 1 hour of rapamycin treatment. (D) Western blot of prApe1 and Ape1 across genetic backgrounds (wild-type, atg1Δ, atg26Δ) with prApe1 expressed from a copper-inducible promoter and incubated 16 hours in SD–Cu media plus copper (CuSO4) followed by removal from CuSO4 and treatment with rapamycin for indicated times. (E) Fluorescence micrographs of cells expressing endogenous prApe1, prApe1-BFP from the endogenous promoter, and prApe1 from the copper-inducible promoter. Cells incubated 16 hours in SD–Cu +50μm CuSO4 followed by 14 hours in SD–Cu media +rapamycin. (F) Analysis of cells with constructs as in (E). Fraction of cells with observed prApe1 aggregates (light blue) and large prApe1 aggregates >1μM (red) after 16 hours incubation in SD–Cu media + indicated CuSO4, followed by 14 hours incubation in SD–Cu + rapamycin. >250 cells were analyzed. Asterisk indicates significant difference from wild-type under the same condition as judged by Fisher’s exact test. (G) Same as (F) but pre-treatment in CuSO4 followed by 14 hours incubation in SD–Cu +rapamycin. (H, I) Quantitative analysis of processed GFP for GFP-Ape4 and GFP-GAG Ty processing assay. Error bars represent SD of three replicates. Asterisks indicate significant difference compared to wild-type as judged by the one sided t-test (p < 0.05).

Similar articles

Cited by

References

    1. Ano Y, Hattori T, Oku M, Mukaiyama H, Baba M, Ohsumi Y, Kato N, Sakai Y. A sorting nexin PpAtg24 regulates vacuolar membrane dynamics during pexophagy via binding to phosphatidylinositol-3-phosphate. Molecular biology of the cell. 2005;16:446–457. - PMC - PubMed
    1. Ashburner M, Ball CA, Blake JA, Botstein D, Butler H, Cherry JM, Davis AP, Dolinski K, Dwight SS, Eppig JT, et al. Gene ontology: tool for the unification of biology. The Gene Ontology Consortium. Nature genetics. 2000;25:25–29. - PMC - PubMed
    1. Atias N, Gershenzon M, Labazin K, Sharan R. Experimental design schemes for learning Boolean network models. Bioinformatics. 2014;30:i445–452. - PMC - PubMed
    1. Bacon RA, Salminen A, Ruohola H, Novick P, Ferro-Novick S. The GTP-binding protein Ypt1 is required for transport in vitro: the Golgi apparatus is defective in ypt1 mutants. The Journal of cell biology. 1989;109:1015–1022. - PMC - PubMed
    1. Bandyopadhyay S, Mehta M, Kuo D, Sung MK, Chuang R, Jaehnig EJ, Bodenmiller B, Licon K, Copeland W, Shales M, et al. Rewiring of genetic networks in response to DNA damage. Science. 2010;330:1385–1389. - PMC - PubMed

MeSH terms

Substances

LinkOut - more resources