. 2017 Jun:39:15-23.
doi: 10.1016/j.mri.2017.01.017. Epub 2017 Jan 27.

Improved performance of prostate DCE-MRI using a 32-coil vs. 12-coil receiver array

Affiliations

Improved performance of prostate DCE-MRI using a 32-coil vs. 12-coil receiver array

Stephen J Riederer et al. Magn Reson Imaging. 2017 Jun.

Abstract

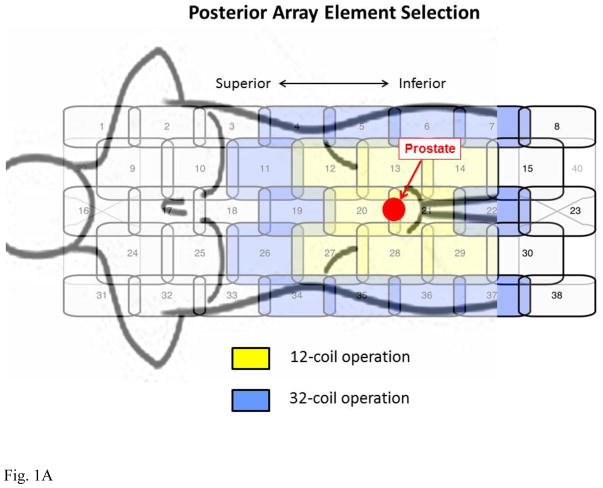
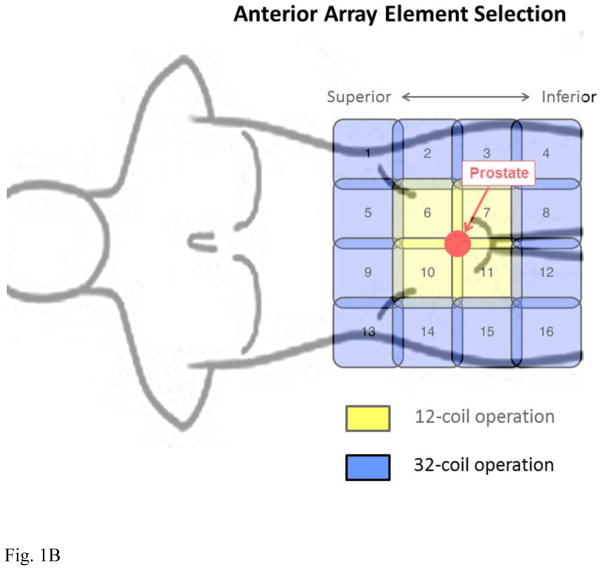
Purpose: To assess whether acquisition with 32 receiver coils rather than the vendor-recommended 12 coils provides significantly improved performance in 3D dynamic contrast-enhanced MRI (DCE-MRI) of the prostate.

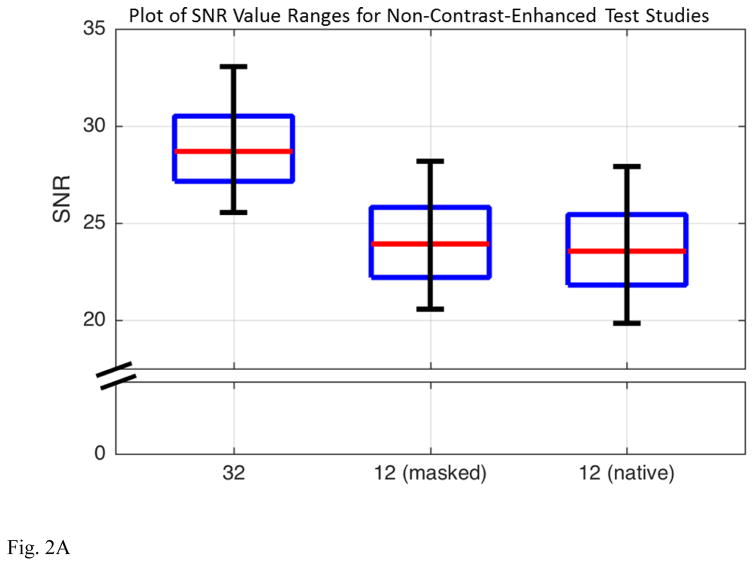
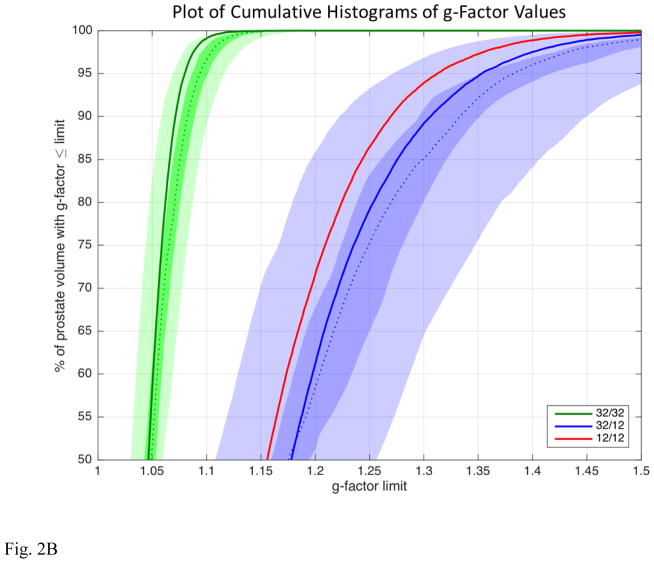
Materials: The study was approved by the institutional review board and was compliant with HIPAA. 50 consecutive male patients in whom prostate MRI was clinically indicated were prospectively imaged in March 2015 with an accelerated DCE-MRI sequence in which image reconstruction was performed using 12 and 32 coil elements. The two reconstructions were compared quantitatively and qualitatively. The first was done using signal-to-noise ratio (SNR) and g-factor analysis to assess sensitivity to acceleration. The second was done using a five-point scale by two experienced radiologists using criteria of perceived SNR, artifact, sharpness, and overall preference. Significance was assessed with the Wilcoxon signed rank test. Extension to T2-weighted spin-echo and diffusion sequences was assessed in phantom studies.

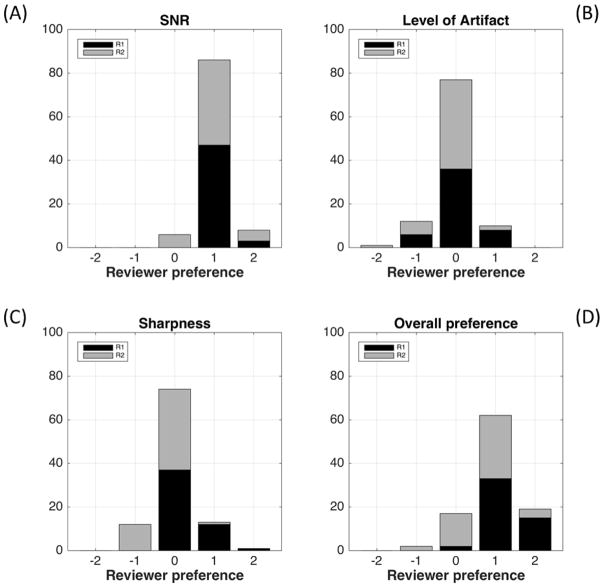
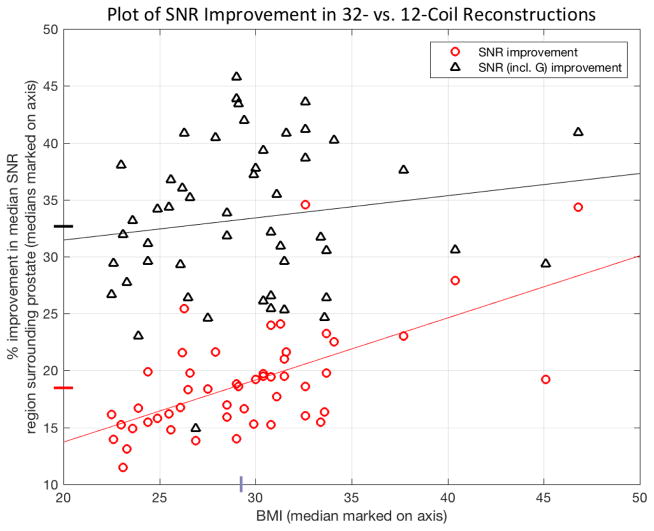
Results: Reconstruction using 32 vs. 12 coil elements provided improved performance in DCE-MRI based on intrinsic SNR (18% higher) and g-factor statistics (14% higher), with a median 32% higher overall SNR within the prostate volume over all subjects. Reconstruction using 32 coils was qualitatively rated significantly improved (p<0.001) vs. 12 coils on the basis of perceived SNR and radiologist preference and equivalent for sharpness and artifact. Phantom studies suggested the improvement in intrinsic SNR could extend to T2-weighted spin-echo and diffusion sequences.

Conclusions: Reconstruction of 3D accelerated DCE-MRI studies of the prostate using 32 independent receiver coils provides improved overall performance vs. using 12 coils.

Keywords: DCE-MRI; Multi-element receiver coil; Prostate MRI.


Figures

Figure 1
Figure 1
Schematics of coil elements and element selection for 12-coil and 32-coil operation. (A) 40-element GEM array contained within the patient table and located posterior to the supine patient. (B) Schematic of 16-element array placed anteriorly to the supine patient. For 12-channel operation the coil elements shown in yellow are selected, eight from the posterior array and four from the anterior array. For 32-channel operation all coils in yellow and additionally those in blue are selected. For the posterior GEM array signals from the lateral-most elements are paired (4 with 34, 5 with 35, etc.) and combined in hardware into one virtual coil per pair. For 32-channel operation all 16 elements of the anterior array are used.
Figure 1
Figure 1
Schematics of coil elements and element selection for 12-coil and 32-coil operation. (A) 40-element GEM array contained within the patient table and located posterior to the supine patient. (B) Schematic of 16-element array placed anteriorly to the supine patient. For 12-channel operation the coil elements shown in yellow are selected, eight from the posterior array and four from the anterior array. For 32-channel operation all coils in yellow and additionally those in blue are selected. For the posterior GEM array signals from the lateral-most elements are paired (4 with 34, 5 with 35, etc.) and combined in hardware into one virtual coil per pair. For 32-channel operation all 16 elements of the anterior array are used.
Figure 2
Figure 2
(A) Box and whisker plots of the reconstructed SNR values from the non-contrast-enhanced test case evaluating reconstructions (i) 32-coil acquisition with 32-coil reconstruction, (ii) 32-coil acquisition with 12-coil reconstruction (“masked”), and (iii) 12-coil acquisition with 12-coil reconstruction (“native”). Each figure shows the median, ±25% values (box boundaries), and ±45% boundaries (whiskers). Median values are 28.7, 23.9, and 23.5 (a.u.). (B) Plot of the cumulative g-factor statistics for the 32-channel acquisition with 32-coil (green lines and curves) and 12-coil (blue lines and curves) reconstructions and for the 12-channel acquisition with 12-coil reconstruction (solid red line). The three solid curves are for the non-contrast-enhanced test scans. The shaded green and blue zones show the ranges of g-factor values measured across the 32-coil and 12-coil reconstructions for all 50 patient studies, respectively. The dotted green and blue lines correspond to the median values, the dark shaded zones to ±12.5% about the median and the light shaded zones to ±37.5% about the median. For all plots the statistics are measured over the 3D volume encompassing the prostate.
Figure 2
Figure 2
(A) Box and whisker plots of the reconstructed SNR values from the non-contrast-enhanced test case evaluating reconstructions (i) 32-coil acquisition with 32-coil reconstruction, (ii) 32-coil acquisition with 12-coil reconstruction (“masked”), and (iii) 12-coil acquisition with 12-coil reconstruction (“native”). Each figure shows the median, ±25% values (box boundaries), and ±45% boundaries (whiskers). Median values are 28.7, 23.9, and 23.5 (a.u.). (B) Plot of the cumulative g-factor statistics for the 32-channel acquisition with 32-coil (green lines and curves) and 12-coil (blue lines and curves) reconstructions and for the 12-channel acquisition with 12-coil reconstruction (solid red line). The three solid curves are for the non-contrast-enhanced test scans. The shaded green and blue zones show the ranges of g-factor values measured across the 32-coil and 12-coil reconstructions for all 50 patient studies, respectively. The dotted green and blue lines correspond to the median values, the dark shaded zones to ±12.5% about the median and the light shaded zones to ±37.5% about the median. For all plots the statistics are measured over the 3D volume encompassing the prostate.
Figure 3
Figure 3
Histograms showing the results of the radiological review for perceived SNR (A), level of artifact (B), sharpness (C), and overall preference (D). For SNR (A) and overall preference (D) the preference for the 32-coil reconstruction (positive scores) was significant (p<.001) for both reviewers individually and in aggregate. For artifact (B) and sharpness (C) there was no significant preference.
Figure 4
Figure 4
Plot of the ratio of median reconstructed SNR values without (red circles) and with (black triangles) the additional effect of g-factor improvements for the 32-coil and 12-coil reconstructions plotted vs. BMI of the patient. In each case values were computed from a volume encompassing the prostate. The median increase for each is shown in the corresponding colored hashmark on the ordinate, and trend lines of each with BMI, as determined from least square regression, are also noted.
Figure 5
Figure 5
Comparison of 12-coil (left) and 32-coil (right) reconstructions of prostate DCE-MRI in a patient with BMI 26.6. Prostate is identified within the white ellipse. Radiologists #1 and #2 both assigned scores of (+2, 0, 0, +2) for (perceived SNR, artifact level, sharpness, overall preference) where positive scores reflect preference for the 32-coil result.
Figure 6
Figure 6
Comparison of 12-coil (left) and 32-coil (right) reconstructions of prostate DCE-MRI in a patient with BMI 30.4. Radiologists #1 and #2 assigned scores of (+1, 0, 0, +1) and (+1, 0, 0, +2).
Figure 7
Figure 7
Comparison of 12-coil (left) and 32-coil (right) reconstructions of prostate DCE-MRI in a patient with BMI 33.4 and with implanted seeds for brachytherapy (black dropouts, e.g. short white arrows). In this exam an endorectal coil used for sequences other than DCE-MRI was applied within a gel-filled insert (long white arrow) but not active for the DCE-MRI sequence. Radiologists #1 and #2 assigned scores of (+1, 0, 0, +1) and (0, 0, 0, 0).
Figure 8
Figure 8
(A) Photograph of phantom used for assessment of prostate MRI. Superior/inferior levels of bladder and prostate inclusions are noted. (B) Axial image of the phantom at the level of prostate inclusion (dashed circle) showing relative percent improvement in SNR of 32- vs. 12-coil acquisition. (C) Coronal T2SE images of the phantom acquired using 12- (left) and 32-coil (right) acquisitions. The observed 9.7% SNR increase is difficult to visualize, but the images show the size and location of the prostate inclusion. ROI used for SNR measurement is indicated as dashed ellipse (left image).
Figure 8
Figure 8
(A) Photograph of phantom used for assessment of prostate MRI. Superior/inferior levels of bladder and prostate inclusions are noted. (B) Axial image of the phantom at the level of prostate inclusion (dashed circle) showing relative percent improvement in SNR of 32- vs. 12-coil acquisition. (C) Coronal T2SE images of the phantom acquired using 12- (left) and 32-coil (right) acquisitions. The observed 9.7% SNR increase is difficult to visualize, but the images show the size and location of the prostate inclusion. ROI used for SNR measurement is indicated as dashed ellipse (left image).

Similar articles

Cited by

References

    1. Delongchamps NB, Rouanne M, Flam T, et al. Multiparametric magnetic resonance imaging for the detection and localization of prostate cancer: combination of T2-weighted, dynamic contrast-enhanced and diffusion-weighted imaging. BJU International. 2010;107:1411–8. - PubMed
    1. Dickinson L, Ahmed HU, Allen C, et al. Magnetic resonance imaging for the detection, localization, and characterization of prostate cancer: recommendations from a European consensus meeting. Eur Urology. 2011;59:477–94. - PubMed
    1. Barentz JO, Richenberg J, Clements R, et al. ESUR prostate MR guidelines 2012. Eur Radiol. 2012;22:746–57. - PMC - PubMed
    1. Franiel T, Hamm B, Hricak H. Dynamic contrast-enhanced magnetic resonance imaging and pharmacokinetic models in prostate cancer. Eur Radiol. 2011;21:616–26. - PubMed
    1. Verma S, Turkbey B, Muradyan N, et al. Overview of dynamic contrast-enhanced MRI in prostate cancer diagnosis and management. AJR. 2012;198:1277–88. - PMC - PubMed