

The impact of cruciferous vegetable isothiocyanates on histone acetylation and histone phosphorylation in bladder cancer
- PMID: 28132875
- PMCID: PMC5324139
- DOI: 10.1016/j.jprot.2017.01.013
The impact of cruciferous vegetable isothiocyanates on histone acetylation and histone phosphorylation in bladder cancer
Abstract
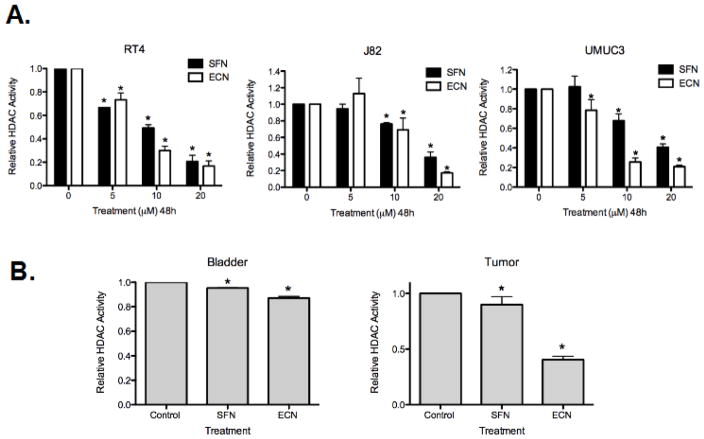
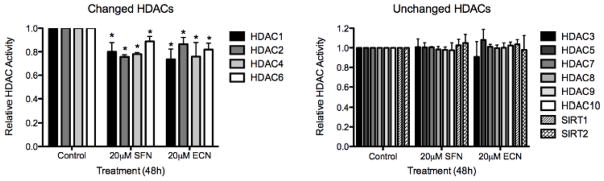
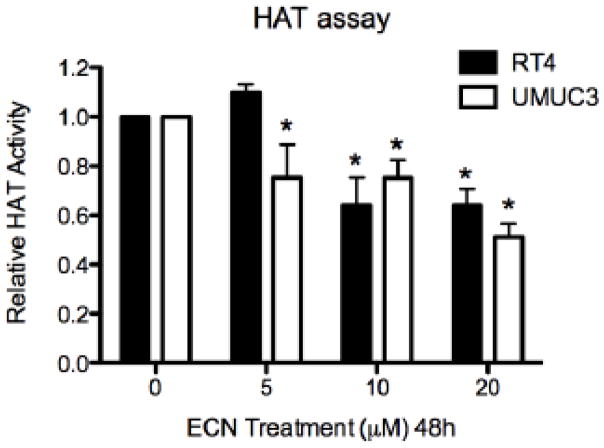
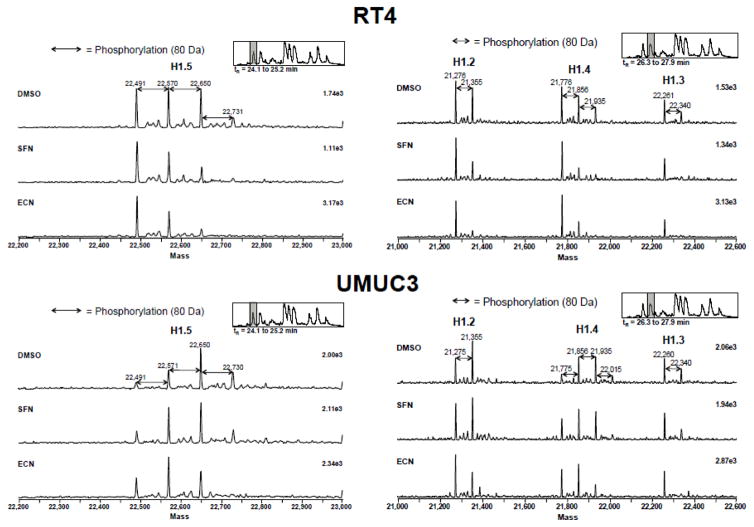
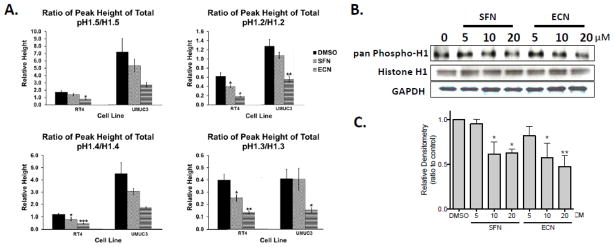
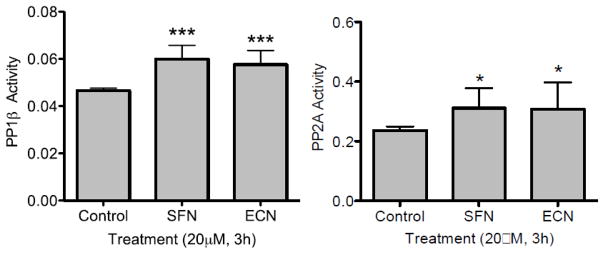
Cruciferous vegetable intake is associated with reduced risk of bladder cancer, yet mechanisms remain unclear. Cruciferous vegetable isothiocyanates (ITCs), namely sulforaphane (SFN) and erucin (ECN), significantly inhibit histone deacetylase (HDAC) activity in human bladder cancer cells representing superficial to invasive biology (59-83% inhibition with 20μM, 48h treatment), and in bladder cancer xenografts (59±3% ECN inhibition). Individual HDACs inhibited by SFN and ECN include HDACs 1, 2, 4 and 6. Interestingly, global acetylation status of histones H3 or H4 remain unaltered. The interplay between HDAC inhibition and modest modulation of AcH3 and AcH4 status is partially explained by decreased histone acetyl transferase activity (48.8±5.3%). In contrast, a significant decrease in phosphorylation status of all isoforms of histone H1 was observed, concomitant with increased phosphatase PP1β and PP2A activity. Together, these findings suggest that ITCs modulate histone status via HDAC inhibition and phosphatase enhancement. This allows for reduced levels of histone H1 phosphorylation, a marker correlated with human bladder cancer progression. Therefore, ITC-mediated inhibition of histone H1 phosphorylation presents a novel direction of research in elucidating epidemiological relationships and supports future food-based prevention strategies.
Significance: Collectively, our findings suggest that the cruciferous vegetable isothiocyanates: sulforaphane (SFN) and erucin (ECN), impact histones status in bladder cancer cells by modulating specific HDACs and HATs, and enhancing phosphatase activity, resulting in reduction of histone H1 phosphorylation. These findings are significant due to the fact that our previous work positively correlated histone H1 phosphorylation with bladder cancer carcinogenesis and progression. Therefore, we propose that SFN and ECN may inhibit bladder carcinogenesis via epigenetic modulation of gene expression associated with histone H1 phosphorylation. These efforts may elucidate biomarkers useful in epidemiologic studies related to cruciferous vegetable intake and cancer risk or provide intermediate biomarkers for food-based clinical intervention studies in high-risk cohorts.
Keywords: Bladder cancer; Broccoli; Cruciferous vegetables; Erucin; Histone acetylation; Histone phosphorylation; Isothiocyanates; Sulforaphane.
Copyright © 2017 Elsevier B.V. All rights reserved.
Conflict of interest statement
The authors have no conflict of interest to declare.
Figures

Similar articles
-
Inhibition of bladder cancer by broccoli isothiocyanates sulforaphane and erucin: characterization, metabolism, and interconversion.Mol Nutr Food Res. 2012 Nov;56(11):1675-87. doi: 10.1002/mnfr.201200276. Epub 2012 Oct 5. Mol Nutr Food Res. 2012. PMID: 23038615 Free PMC article.
-
Cruciferous Vegetables, Isothiocyanates, and Bladder Cancer Prevention.Mol Nutr Food Res. 2018 Sep;62(18):e1800079. doi: 10.1002/mnfr.201800079. Epub 2018 Aug 29. Mol Nutr Food Res. 2018. PMID: 30079608 Free PMC article. Review.
-
Modulation of histone deacetylase activity by dietary isothiocyanates and allyl sulfides: studies with sulforaphane and garlic organosulfur compounds.Environ Mol Mutagen. 2009 Apr;50(3):213-21. doi: 10.1002/em.20454. Environ Mol Mutagen. 2009. PMID: 19197985 Free PMC article. Review.
-
Heterocyclic Analogs of Sulforaphane Trigger DNA Damage and Impede DNA Repair in Colon Cancer Cells: Interplay of HATs and HDACs.Mol Nutr Food Res. 2018 Sep;62(18):e1800228. doi: 10.1002/mnfr.201800228. Epub 2018 Jul 19. Mol Nutr Food Res. 2018. PMID: 29924908 Free PMC article.
-
Sulforaphane modulates telomerase activity via epigenetic regulation in prostate cancer cell lines.Biochem Cell Biol. 2016 Feb;94(1):71-81. doi: 10.1139/bcb-2015-0038. Epub 2015 Sep 9. Biochem Cell Biol. 2016. PMID: 26458818
Cited by
-
Tumor Microenvironment: Lactic Acid Promotes Tumor Development.J Immunol Res. 2022 Jun 12;2022:3119375. doi: 10.1155/2022/3119375. eCollection 2022. J Immunol Res. 2022. PMID: 35733921 Free PMC article. Review.
-
Plant-Derived Sulforaphane Suppresses Growth and Proliferation of Drug-Sensitive and Drug-Resistant Bladder Cancer Cell Lines In Vitro.Cancers (Basel). 2022 Sep 26;14(19):4682. doi: 10.3390/cancers14194682. Cancers (Basel). 2022. PMID: 36230603 Free PMC article.
-
Reviewing cancer's biology: an eclectic approach.J Egypt Natl Canc Inst. 2021 Nov 1;33(1):32. doi: 10.1186/s43046-021-00088-y. J Egypt Natl Canc Inst. 2021. PMID: 34719756 Review.
-
Moringa isothiocyanate complexed with α-cyclodextrin: a new perspective in neuroblastoma treatment.BMC Complement Altern Med. 2017 Jul 14;17(1):362. doi: 10.1186/s12906-017-1876-z. BMC Complement Altern Med. 2017. Retraction in: BMC Complement Med Ther. 2023 Mar 7;23(1):75. doi: 10.1186/s12906-023-03908-x. PMID: 28705212 Free PMC article. Retracted.
-
Maternal Epigenetic Regulation Contributes to Prevention of Estrogen Receptor-negative Mammary Cancer with Broccoli Sprout Consumption.Cancer Prev Res (Phila). 2020 May;13(5):449-462. doi: 10.1158/1940-6207.CAPR-19-0491. Epub 2020 Mar 17. Cancer Prev Res (Phila). 2020. PMID: 32184225 Free PMC article.
References
-
- Rodrigues D, Jeronimo C, Henrique R, Belo L, de Lourdes Bastos M, de Pinho PG, Carvalho M. Biomarkers in bladder cancer: A metabolomic approach using in vitro and ex vivo model systems. International journal of cancer. 2016;139(2):256–68. - PubMed
-
- Harb-de la Rosa A, Acker M, Kumar RA, Manoharan M. Epigenetics application in the diagnosis and treatment of bladder cancer. The Canadian journal of urology. 2015;22(5):7947–51. - PubMed
-
- Kim WJ, Kim YJ. Epigenetics of bladder cancer. Methods in molecular biology. 2012;863:111–8. - PubMed
MeSH terms
Substances
Grants and funding
LinkOut - more resources
Full Text Sources
Other Literature Sources
Medical
Research Materials
Miscellaneous
