

Inhibition of the Proteasome β2 Site Sensitizes Triple-Negative Breast Cancer Cells to β5 Inhibitors and Suppresses Nrf1 Activation
- PMID: 28132893
- PMCID: PMC5341617
- DOI: 10.1016/j.chembiol.2016.12.016
Inhibition of the Proteasome β2 Site Sensitizes Triple-Negative Breast Cancer Cells to β5 Inhibitors and Suppresses Nrf1 Activation
Abstract
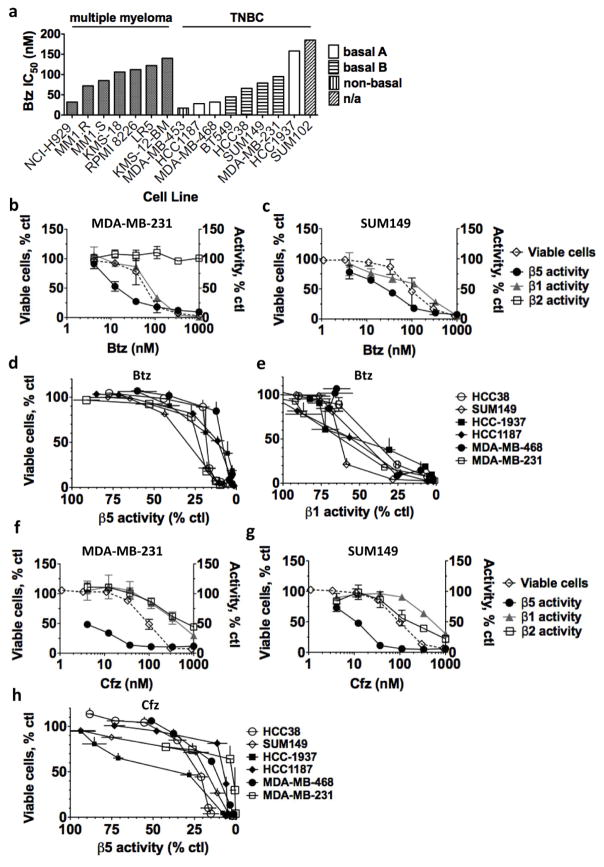
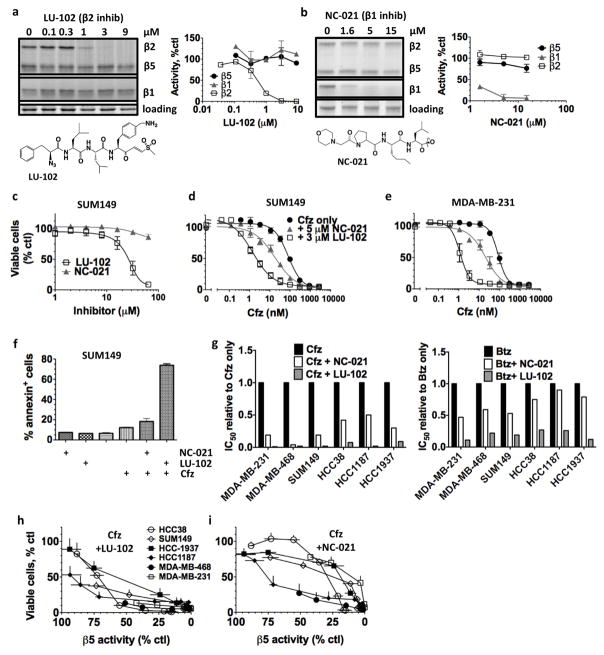
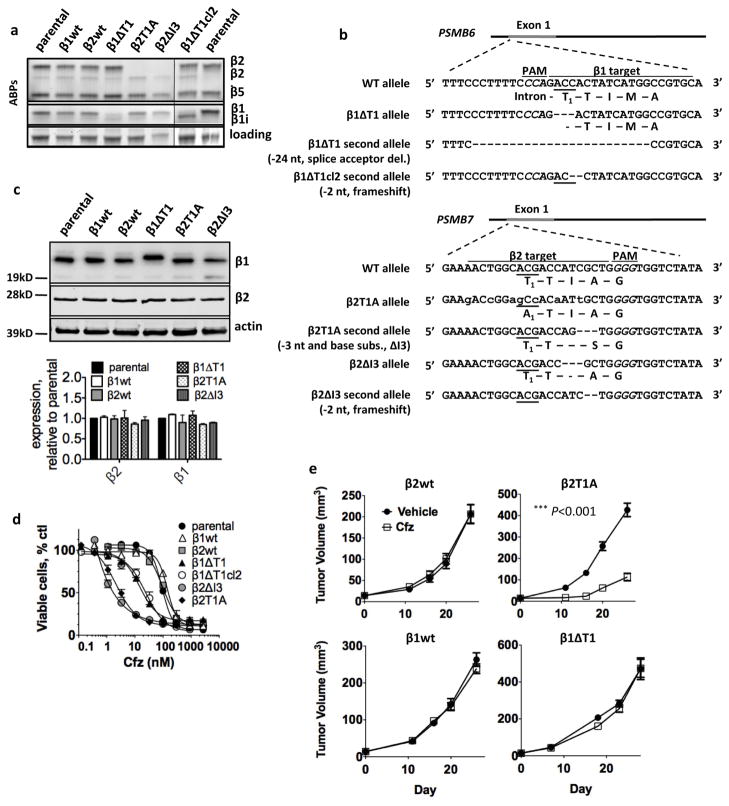
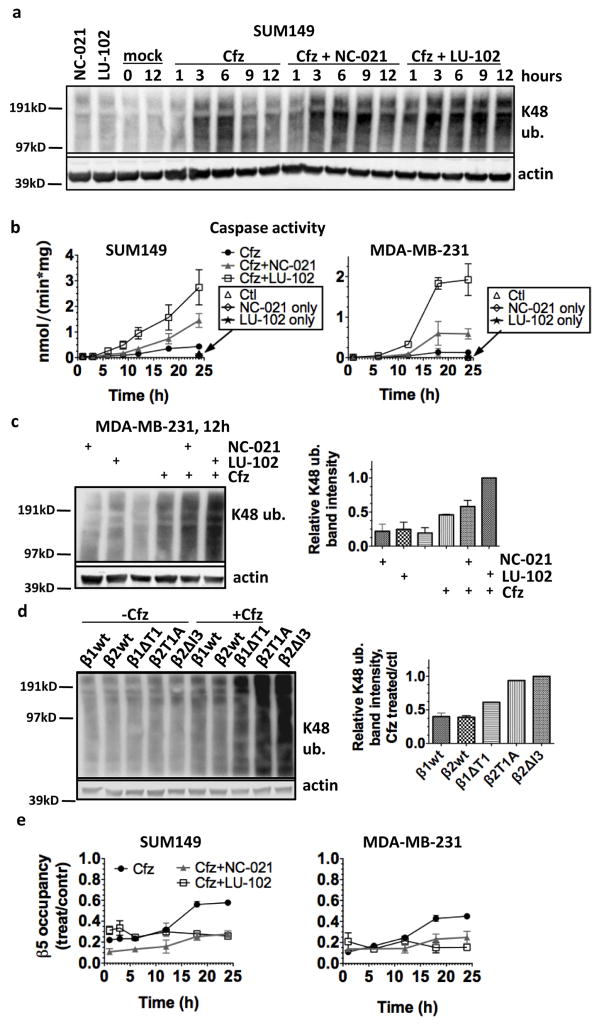
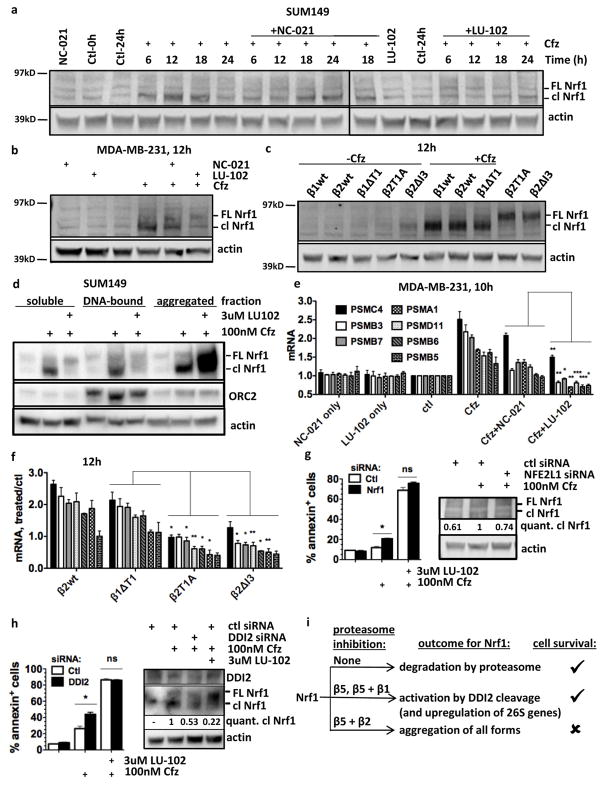
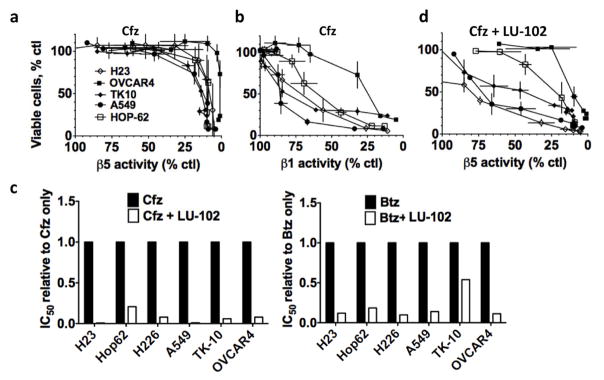
The proteasome inhibitors carfilzomib (Cfz) and bortezomib (Btz) are used successfully to treat multiple myeloma, but have not shown clinical efficacy in solid tumors. Here we show that clinically achievable inhibition of the β5 site of the proteasome by Cfz and Btz does not result in loss of viability of triple-negative breast cancer cell lines. We use site-specific inhibitors and CRISPR-mediated genetic inactivation of β1 and β2 to demonstrate that inhibiting a second site of the proteasome, particularly the β2 site, sensitizes cell lines to Btz and Cfz in vitro and in vivo. Inhibiting both β5 and β2 suppresses production of the soluble, active form of the transcription factor Nrf1 and prevents the recovery of proteasome activity through induction of new proteasomes. These findings provide a strong rationale for the development of dual β5 and β2 inhibitors for the treatment of solid tumors.
Keywords: CRISPR; NFE2L1; Nrf1; bortezomib; carfilzomib; proteasome; triple-negative breast cancer; ubiquitin.
Copyright © 2017 Elsevier Ltd. All rights reserved.
Figures
Comment in
-
The Holy Grail: Solid Tumor Efficacy by Proteasome Inhibition.Cell Chem Biol. 2017 Feb 16;24(2):125-126. doi: 10.1016/j.chembiol.2017.01.007. Cell Chem Biol. 2017. PMID: 28212756
Similar articles
-
Discovery of a novel dipeptidyl boronic acid proteasome inhibitor for the treatment of multiple myeloma and triple-negative breast cancer.Org Biomol Chem. 2019 Jan 16;17(3):683-691. doi: 10.1039/c8ob02668h. Org Biomol Chem. 2019. PMID: 30601533
-
Disabling the Protease DDI2 Attenuates the Transcriptional Activity of NRF1 and Potentiates Proteasome Inhibitor Cytotoxicity.Int J Mol Sci. 2020 Jan 3;21(1):327. doi: 10.3390/ijms21010327. Int J Mol Sci. 2020. PMID: 31947743 Free PMC article.
-
P-Glycoprotein Inhibition Sensitizes Human Breast Cancer Cells to Proteasome Inhibitors.J Cell Biochem. 2017 May;118(5):1239-1248. doi: 10.1002/jcb.25783. Epub 2017 Jan 10. J Cell Biochem. 2017. PMID: 27813130 Free PMC article.
-
Site-Specific Proteasome Inhibitors.Biomolecules. 2021 Dec 31;12(1):54. doi: 10.3390/biom12010054. Biomolecules. 2021. PMID: 35053202 Free PMC article. Review.
-
Proteasome Inhibitor Drugs.Annu Rev Pharmacol Toxicol. 2020 Jan 6;60:457-476. doi: 10.1146/annurev-pharmtox-010919-023603. Epub 2019 Sep 3. Annu Rev Pharmacol Toxicol. 2020. PMID: 31479618 Review.
Cited by
-
The Role of the APC/C and Its Coactivators Cdh1 and Cdc20 in Cancer Development and Therapy.Front Genet. 2022 Jun 27;13:941565. doi: 10.3389/fgene.2022.941565. eCollection 2022. Front Genet. 2022. PMID: 35832196 Free PMC article. Review.
-
A clinically relevant pulse treatment generates a bortezomib-resistant myeloma cell line that lacks proteasome mutations and is sensitive to Bcl-2 inhibitor venetoclax.Sci Rep. 2022 Jul 27;12(1):12788. doi: 10.1038/s41598-022-17239-3. Sci Rep. 2022. PMID: 35896610 Free PMC article.
-
Cellular Responses to Proteasome Inhibition: Molecular Mechanisms and Beyond.Int J Mol Sci. 2019 Jul 10;20(14):3379. doi: 10.3390/ijms20143379. Int J Mol Sci. 2019. PMID: 31295808 Free PMC article. Review.
-
Loss of correlated proteasomal subunit expression selectively promotes the 20SHigh state which underlies luminal breast tumorigenicity.Commun Biol. 2025 Jan 15;8(1):55. doi: 10.1038/s42003-024-07432-7. Commun Biol. 2025. PMID: 39814910 Free PMC article.
-
PSMB2 knockdown suppressed proteasome activity and cell proliferation, promoted apoptosis, and blocked NRF1 activation in gastric cancer cells.Cytotechnology. 2022 Aug;74(4):491-502. doi: 10.1007/s10616-022-00538-y. Epub 2022 Jun 27. Cytotechnology. 2022. PMID: 36110152 Free PMC article.
References
-
- Adams J, Palombella VJ, Sausville EA, Johnson J, Destree A, Lazarus DD, Maas J, Pien CS, Prakash S, Elliott PJ. Proteasome inhibitors: a novel class of potent and effective antitumor agents. Cancer Res. 1999;59:2615–2622. - PubMed
-
- Bertucci F, Finetti P, Cervera N, Esterni B, Hermitte F, Viens P, Birnbaum D. How basal are triple-negative breast cancers? Int J Cancer. 2008;123:236–240. - PubMed
-
- Bianchi G, Oliva L, Cascio P, Pengo N, Fontana F, Cerruti F, Orsi A, Pasqualetto E, Mezghrani A, Calbi V, et al. The proteasome load versus capacity balance determines apoptotic sensitivity of multiple myeloma cells to proteasome inhibition. Blood. 2009;113:3040–3049. - PubMed
MeSH terms
Substances
Grants and funding
LinkOut - more resources
Full Text Sources
Other Literature Sources
