. 2017 Jun;1864(6):1009-1017.
doi: 10.1016/j.bbamcr.2017.01.015. Epub 2017 Jan 26.

Pathological consequences of MICU1 mutations on mitochondrial calcium signalling and bioenergetics

Affiliations

Pathological consequences of MICU1 mutations on mitochondrial calcium signalling and bioenergetics

Gauri Bhosale et al. Biochim Biophys Acta Mol Cell Res. 2017 Jun.

Abstract

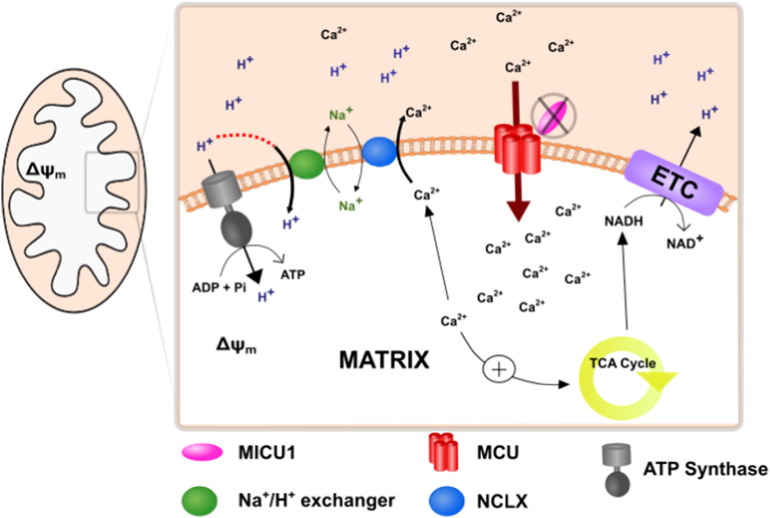
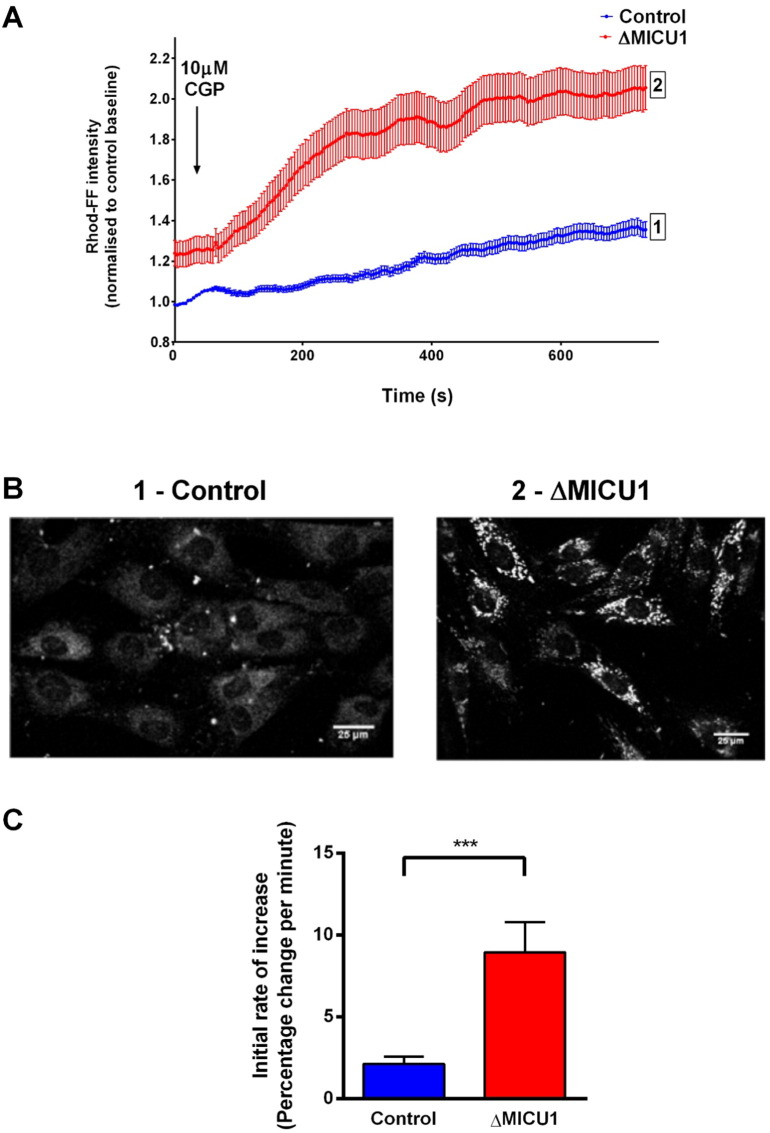
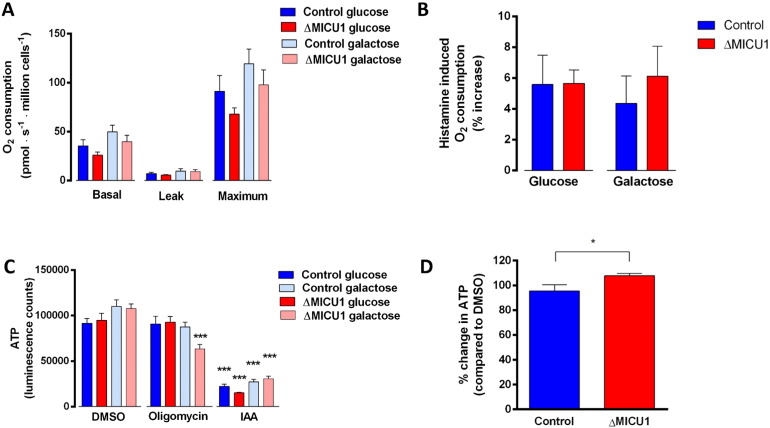
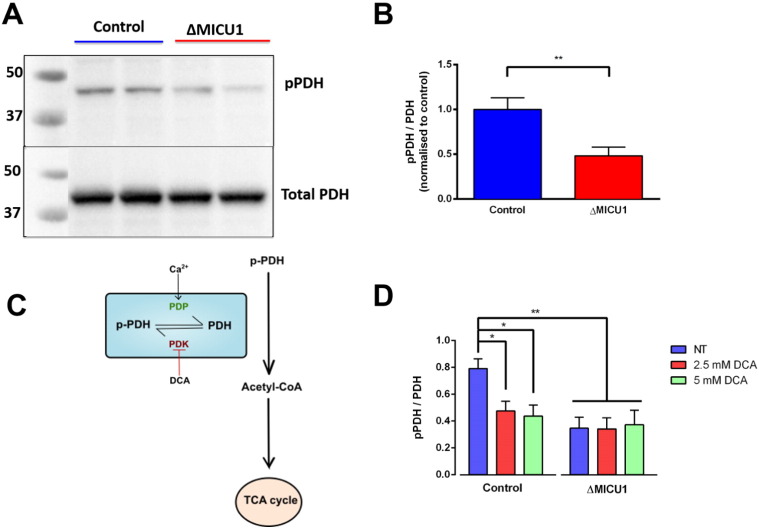
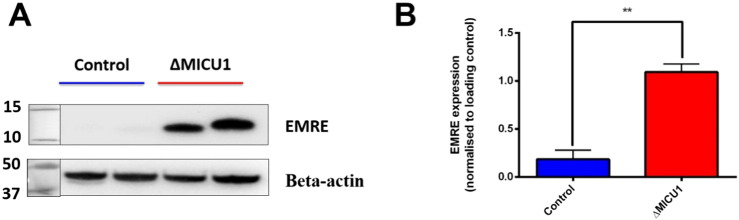
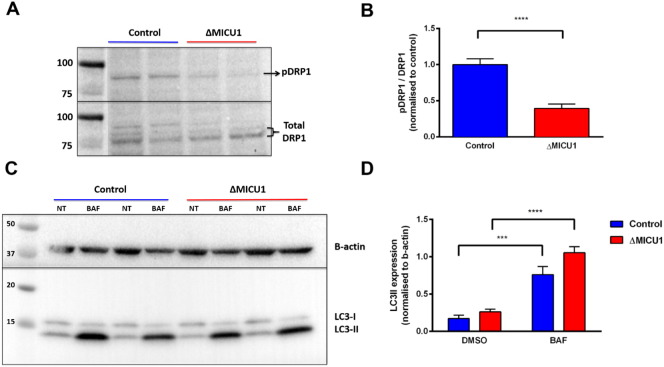
Loss of function mutations of the protein MICU1, a regulator of mitochondrial Ca2+ uptake, cause a neuronal and muscular disorder characterised by impaired cognition, muscle weakness and an extrapyramidal motor disorder. We have shown previously that MICU1 mutations cause increased resting mitochondrial Ca2+ concentration ([Ca2+]m). We now explore the functional consequences of MICU1 mutations in patient derived fibroblasts in order to clarify the underlying pathophysiology of this disorder. We propose that deregulation of mitochondrial Ca2+ uptake through loss of MICU1 raises resting [Ca2+]m, initiating a futile Ca2+ cycle, whereby continuous mitochondrial Ca2+ influx is balanced by Ca2+ efflux through the sodium calcium exchanger (NLCXm). Thus, inhibition of NCLXm by CGP-37157 caused rapid mitochondrial Ca2+ accumulation in patient but not control cells. We suggest that increased NCLX activity will increase sodium/proton exchange, potentially undermining oxidative phosphorylation, although this is balanced by dephosphorylation and activation of pyruvate dehydrogenase (PDH) in response to the increased [Ca2+]m. Consistent with this model, while ATP content in patient derived or control fibroblasts was not different, ATP increased significantly in response to CGP-37157 in the patient but not the control cells. In addition, EMRE expression levels were altered in MICU1 patient cells compared to the controls. The MICU1 mutations were associated with mitochondrial fragmentation which we show is related to altered DRP1 phosphorylation. Thus, MICU1 serves as a signal-noise discriminator in mitochondrial calcium signalling, limiting the energetic costs of mitochondrial Ca2+ signalling which may undermine oxidative phosphorylation, especially in tissues with highly dynamic energetic demands. This article is part of a Special Issue entitled: ECS Meeting edited by Claus Heizmann, Joachim Krebs and Jacques Haiech.

Keywords: Calcium; MICU1; Mitochondria; PDH.


Figures

Fig. 1
Fig. 1
Schematic diagram to demonstrate the futile Ca2+ cycle established in the absence of MICU1, resulting in a deficit in ATP production.
Fig. 2
Fig. 2
Effect of blocking the NCLX on mitochondrial Ca2+ uptake. (A) Representative traces of one experimental day, after normalising each time point to the resting rhod-FF intensity of the control. (B) Representative confocal images of galactose-cultured, rhod-FF loaded control and ΔMICU1 fibroblasts after approximately 7 mins of 10 μM CGP-37157 incubation. (C) The initial rate of increase was analysed as percentage change per minute over the first 2 min, after normalising to baseline of each cell. n > 100 cells from 3 independent experiments (***P ≤ 0.001).
Fig. 3
Fig. 3
Effect of loss of function of MICU1 on oxygen consumption rate and ATP production. (A) Oxygen consumption rate of ΔMICU1 and control fibroblasts grown in glucose and galactose. (B) Oxygen consumption rate of ΔMICU1 and control fibroblasts after 10 μM histamine stimulation. Leak was measured following the addition of 2.5 μM oligomycin A and maximal respiratory capacity was measured following addition of 1 μM FCCP. n = 6 replicates pooled from both cell lines (2 control and 2 ΔMICU1 cell lines were measured on 3 experimental days). (C) Measurements of cellular ATP: ΔMICU1 and control fibroblasts grown in glucose or galactose were pre-treated with DMSO, 5 μM oligomycin and 1 mM IAA. (D) Cells were treated with DMSO and 10 μM CGP-37157 for 60 min. before having total ATP content quantified. Luminescence values were normalised to DMSO treatment. n = 6 replicates pooled from both cell lines (2 control and 2 ΔMICU1 cell lines were measured on 3 experimental days) (*P ≤ 0.05, ***P ≤ 0.001).
Fig. 4
Fig. 4
PDH is dephosphorylated in ΔMICU1 cells. (A) Whole cell lysates were immunoblotted for pPDH (PDH-E1α pS293) and total PDH (PDH-E1α). (B) The ratio of band intensities was normalised to the average control ratio on each experimental day. n = 8 replicates pooled from both cell lines (2 control and 2 ΔMICU1 cell lines were measured on 4 experimental days) (** P < 0.01). (C) Schematic diagram to demonstrate the regulation of PDH activity by Ca2+. DCA inhibits PDH kinase, therefore effectively activating PDH by limiting phosphorylation. Pyruvate dehydrogenase phosphatase (PDP), which increases PDH activity, is physiologically activated by Ca2+. (D) Cells were pre-treated with DCA before performing protein extraction. n = 5 for controls and n = 4 for patients pooled from both cell lines (1 control and 1 ΔMICU1 cell line on 4 separate days) (* P < 0.05, ** P < 0.01).
Fig. 5
Fig. 5
Levels of EMRE expression in control and ΔMICU1 fibroblasts (A) Whole cell lysates were immunoblotted for EMRE and beta-actin (B)The ratio of band intensities was normalised to beta actin as the loading control on each experimental day. n = 8 replicates (2 control and 2 ΔMICU1 cell lines were measured on 4 experimental days) (2 control and 2 ΔMICU1 cell lines on 4 separate days) (** P < 0.01).
Fig. 6
Fig. 6
Immunoblots from whole cell lysates from galactose-cultured control and ΔMICU1 cells. (A) Immunoblot of DRP1 (S637) and total DRP1. (B) The ratio of band intensities was normalised to the average control ratio on each experimental day. n = 8 replicates pooled from both cell lines (2 control and 2 ΔMICU1 cell lines were measured on 4 experimental days). (C) Immunoblots for LC3. Cells were treated with 1 μL/mL DMSO (NT) or 100 nM bafilomycin A1 (BAF) for 5 h prior to protein extraction. (D) Intensity of the LC3-II band at 14 kDa was normalised to b-actin loading control. n = 6 replicates pooled from both cell lines (2 control and 2 ΔMICU1 cell lines were measured on 3 experimental days) (*** P < 0.001, **** P < 0.0001).

Similar articles

Cited by

References

    1. Lehninger A.L., Reynafarje B., Vercesi A., Tew W.P. Transport and accumulation of calcium in mitochondria. Ann. N. Y. Acad. Sci. 1978;307:160–176. - PubMed
    1. Carafoli E. Calcium ion transport in mitochondria. Biochem. J. 1970;116:2P–3P. - PMC - PubMed
    1. Deluca H.F., Engstrom G.W. Calcium uptake by rat kidney mitochondria. Proc. Natl. Acad. Sci. U. S. A. 1961;47:1744–1750. - PMC - PubMed
    1. Crompton M.S., Sigel E., Salzmann M., Carafoli E. A kinetic study of the energy-linked influx of Ca2+ into heart mitochondria. Eur. J. Biochem. 1976;69
    1. King M.P., Attardi G. Human cells lacking mtDNA: repopulation with exogenous mitochondria by complementation. Science. 1989;246:500–503. - PubMed

Publication types

Substances

LinkOut - more resources